Environmental Response Management Mapping Tool

From The Encyclopedia of Earth
Jump to: navigation, search
Environmental & Resource Management (main)


ERMA® is an online mapping tool that integrates both static and real-time data, such as Environmental Sensitivity Index (ESI) maps, ship locations, weather, and ocean currents, in a centralized, easy-to-use format for environmental responders and decision makers.

ERMA enables a user to quickly and securely upload, manipulate, export, and display spatial data in a Geographic Information System (GIS) map.

Developed by NOAA and the University of New Hampshire with the U.S. Environmental Protection Agency, U.S. Coast Guard, and the Department of Interior, ERMA provides environmental resource managers with the data necessary to make informed decisions for environmental response.

Learn more about how NOAA and its partners developed ERMA using open-source software.

Find out how NOAA is helping the Arctic region prepare for any climate change and possible oil spills using ERMA.

Caribbean ERMA was used during a regional oil spill drill (for training purposes) and has been used to map small vessel groundings near coral reefs.

This online mapping tool for the Gulf of Mexico integrates static and real time response data from the Deepwater Horizon/BP oil spill.

The original ERMA pilot project has been expanded and continues to be developed for the Northeast region of the USA.

Pacific Islands ERMA is primarily focused on impacts from coastal storms and marine debris.

NOAA initially developed Pacific Northwest ERMA with funding for its CAPRI program in Washington's Puget Sound, which looks at environmental vulnerability due to forecast changes in climate conditions.

Southwest ERMA contains data used in an oil spill drill in the coastal California region in order to help responders prepare for impacts from potential spills.

Arctic-erma-noaa.jpg

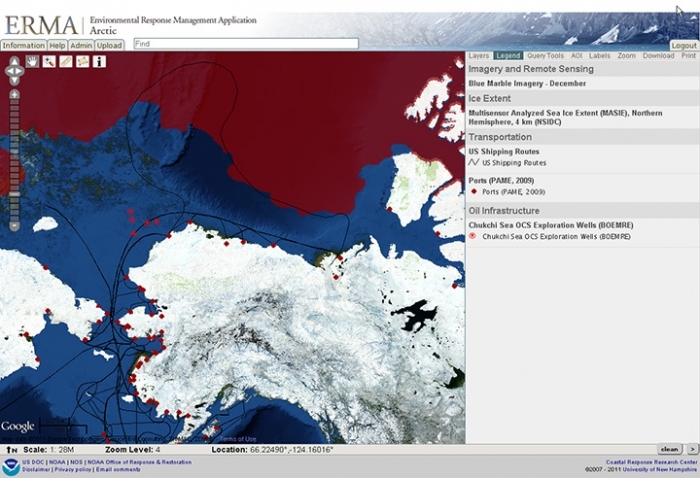
Arctic ERMA enables emergency planners and responders to present in a spatial environment depictions of sea ice concentrations from the National Snow and Ice Data Center together with aerial observations of changing ice flows. This flexibility and adaptability provides stakeholders in the Arctic with crucial information about where sea ice is thinning in an easy-to-understand way.

Citation

Draggan, S. (2012). Environmental Response Management Mapping Tool. Retrieved from http://editors.eol.org/eoearth/wiki/Environmental_Response_Management_Mapping_Tool