Energy balance of Earth
The Earth’s climate is a solar powered system. Globally, over the course of the year, the Earth system—land surfaces, oceans, and atmosphere—absorbs an average of about 240 watts of solar power (Solar radiation) per square meter (one watt is one joule of energy every second). The absorbed sunlight drives photosynthesis, fuels evaporation, melts snow and ice, and warms the Earth system.
The Sun doesn’t heat the Earth evenly. Because the Earth is a sphere, the Sun heats equatorial regions more than polar regions. The atmosphere and ocean work non-stop to even out solar heating imbalances through evaporation of surface water, convection, rainfall, winds, and ocean circulation. This coupled atmosphere and ocean circulation is known as Earth’s heat engine.
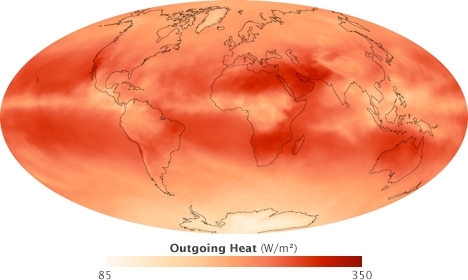
The climate’s heat engine must not only redistribute solar heat from the equator toward the poles, but also from the Earth’s surface and lower atmosphere back to space. Otherwise, Earth would endlessly heat up. Earth’s temperature doesn’t infinitely rise because the surface and the atmosphere are simultaneously radiating heat to space. This net flow of energy into and out of the Earth system is Earth’s energy budget.
|
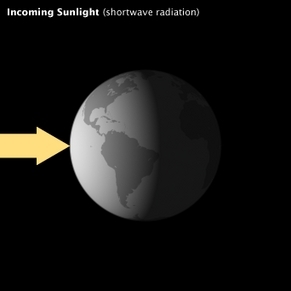
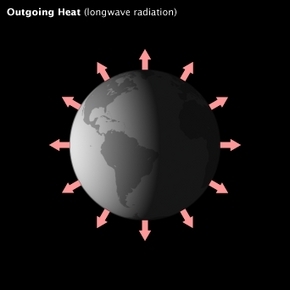
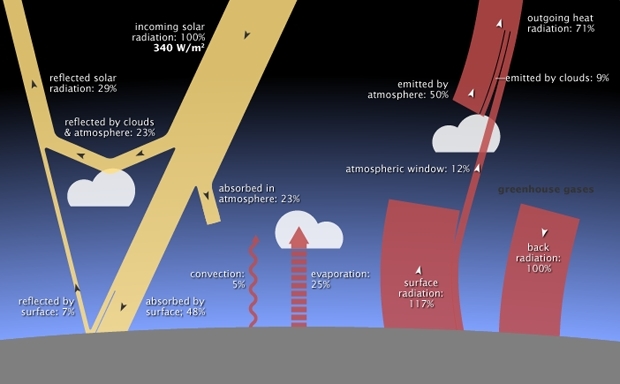
Figure 1. The energy that Earth receives from sunlight is balanced by an equal amount of energy radiating into space. The energy escapes in the form of thermal infrared radiation: like the energy you feel radiating from a heat lamp. (NASA illustrations by Robert Simmon.) | |
When the flow of incoming solar energy is balanced by an equal flow of heat to space, Earth is in radiative equilibrium, and global temperature is relatively stable. Anything that increases or decreases the amount of incoming or outgoing energy disturbs Earth’s radiative equilibrium; global temperatures rise or fall in response.
Contents
- 1 Incoming Sunlight
- 2 Global Patterns of Insolation (Incident Solar Radiation)
- 3 Heating Imbalances
- 4 Earth’s Energy Budget
- 5 Surface Energy Budget
- 6 Global Heat Balance: Introduction to Heat Fluxes
- 7 The Atmosphere’s Energy Budget
- 8 The Natural Greenhouse Effect
- 9 Effect on Surface Temperature
- 10 Climate Forcings and Global Warming
- 11 References
Incoming Sunlight
All matter in the universe that has a temperature above absolute zero (the temperature at which all atomic or molecular motion stops) radiates energy across a range of wavelengths in the electromagnetic spectrum. The hotter something is, the shorter its peak wavelength of radiated energy is. The hottest objects in the universe radiate mostly gamma rays and x-rays. Cooler objects emit mostly longer-wavelength radiation, including visible light, thermal infrared, radio, and microwaves.
The surface of the Sun has a temperature of about 5,800 Kelvin (about 5,500 degrees Celsius, or about 10,000 degrees Fahrenheit). At that temperature, most of the energy the Sun radiates is visible and near-infrared light. At Earth’s average distance from the Sun (about 150 million kilometers), the average intensity of solar energy reaching the top of the atmosphere directly facing the Sun is about 1,360 watts per square meter, according to measurements made by the most recent NASA satellite missions. This amount of power is known as the total solar irradiance. (Before scientists discovered that it varies by a small amount during the sunspot cycle, total solar irradiance was sometimes called “the solar constant.”) Solar irradiance falling on a given area, or "incident solar radiation" is commonly known as "insolation".
A watt is measurement of power, or the amount of energy that something generates or uses over time. How much power is 1,360 watts? An incandescent light bulb uses anywhere from 40 to 100 watts. A microwave uses about 1000 watts. If for just one hour, you could capture and re-use all the solar energy arriving over a single square meter at the top of the atmosphere directly facing the Sun—an area no wider than an adult’s outstretched arm span—you would have enough to run a refrigerator all day.
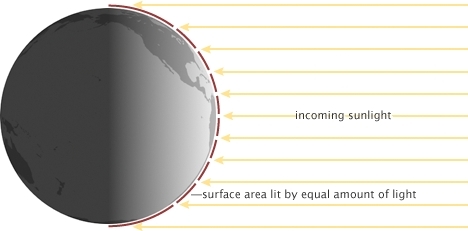
The total solar irradiance is the maximum possible power that the Sun can deliver to a planet at Earth’s average distance from the Sun; basic geometry limits the actual solar energy intercepted by Earth. Only half the Earth is ever lit by the Sun at one time, which halves the total solar irradiance.
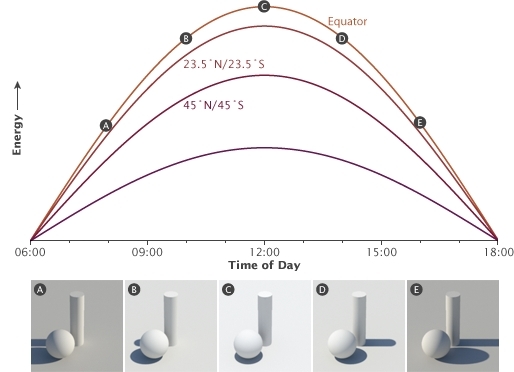
In addition, the total solar irradiance is the maximum power the Sun can deliver to a surface that is perpendicular to the path of incoming light. Because the Earth is a sphere, only areas near the equator at midday come close to being perpendicular to the path of incoming light. Everywhere else, the light comes in at an angle. The progressive decrease in the angle of solar illumination with increasing latitude reduces the average solar irradiance by an additional one-half.
Averaged over the entire planet, the amount of sunlight arriving at the top of Earth’s atmosphere is only one-fourth of the total solar irradiance, or approximately 340 watts per square meter.
When the flow of incoming solar energy is balanced by an equal flow of heat to space, Earth is in radiative equilibrium, and global temperature is relatively stable. Anything that increases or decreases the amount of incoming or outgoing energy disturbs Earth’s radiative equilibrium; global temperatures must rise or fall in response.
Global Patterns of Insolation (Incident Solar Radiation)
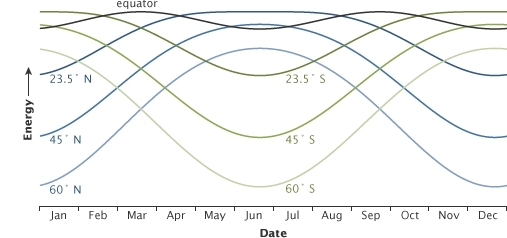
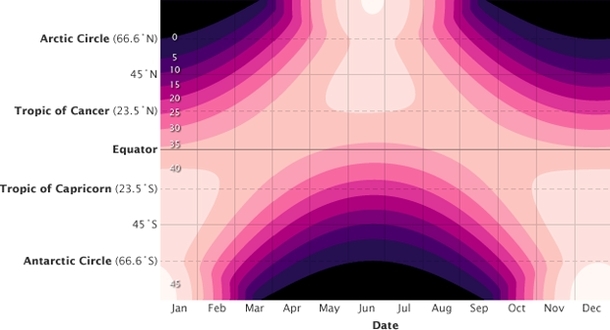
Three hundred forty watts per square meter of incoming solar power is a global average; solar illumination varies in space and time. The annual amount of incoming solar energy varies considerably from tropical latitudes to polar latitudes. At middle and high latitudes, it also varies considerably from season to season.
If the Earth’s axis of rotation were vertical with respect to the path of its orbit around the Sun, the size of the heating imbalance between equator and the poles would be the same year round, and the seasons we experience would not occur. Instead Earth’s axis is tilted off vertical by about 23 degrees. As the Earth orbits the Sun, the tilt causes one hemisphere and then the other to receive more direct sunlight and to have longer days.
In the “summer hemisphere,” the combination of more direct sunlight and longer days means the pole can receive more incoming sunlight than the tropics, but in the winter hemisphere, it gets none. Even though illumination increases at the poles in the summer, bright white snow and sea ice reflect a significant portion of the incoming light, reducing the potential solar heating. In addition, variations in cloud cover over different types of land cover and oceans impact the amount of sunlight reaching the surface. The net result is that:
- Highest values of surface insolation occur in tropical latitudes. Within this zone there are localized maximums over the tropical oceans and deserts where the atmosphere (Atmosphere layers) has virtually no cloud development for most of the year. Insolation quantities at the equator over land during the solstices are approximately the same as values found in the middle latitudes during their summer.
Outside the tropics, annual receipts of solar radiation generally decrease with increasing latitude. Minimum values occur at the poles. This pattern is primarily the result of Earth-sun geometric relationships and its effect on the duration and intensity of solar radiation received.
In middle and high latitudes, insolation values over the ocean, as compared to those at the same latitude over the land, are generally higher. Greater cloudiness over land surfaces accounts for this variation.
See Box 1. for additional details about global patterns of insolation.
|
Box 1. Global Patterns of Insolation (Incident Solar Radiation) NASA's Surface Radiation Budget Project has used satellite data, computer models, and meteorological data to determine shortwave (solar) surface radiation fluxes for the period July 1983 to June 1991. The following images display these fluxes for January and July globally. In the accompanying equations, the mathematical terms have the following definitions:
| |
|
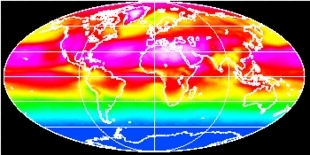
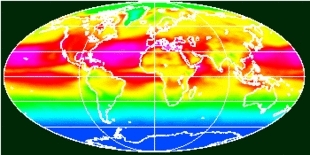
Figure 6: Average Available Solar insolation at the Earth's Surface: January 1984-1991 (K + k) -- Highest values of available solar insolation occur at the South Pole due to high solar input and little cloud cover. High values also occur along the subtropical oceans of the Southern Hemisphere. Color range: blue - red - white, Values: 0 - 350 W/m2. Global mean = 187 W/m2, Minimum = 0 W/m2, Maximum = 426 W/m2. (Source: NASA Surface Radiation Budget Project). |
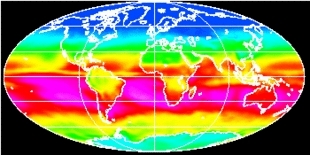
Figure 7: Average Available Solar Insolation at the Earth's Surface: July 1983-1990 (K + k) -- Highest values of available solar insolation over Greenland due to high solar input and low cloud amounts. High values also occur along the subtropics of the Northern Hemisphere. Color range: blue - red - white, Values: 0 - 350 W/m2. Global mean = 180 W/m2, Minimum = 0 W/m2, Maximum = 351 W/m2. (Source: NASA Surface Radiation Budget Project). |
|
Figure 8: Average Absorbed Solar Insolation at the Earth's Surface: January 1984-1991 + k)(1 - a) -- Highest values occur along the subtropical oceans of the Southern Hemisphere. Lowest values occur over areas of high surface reflection such as the South Pole, cloudy regions, and areas of low solar input like the high latitudes of the Northern Hemisphere. Color range: blue - red - white, Values: 0 - 350 W/m2. Global mean = 162 W/m2, Minimum = 0 W/m2, Maximum = 315 W/m2. (Source: NASA Surface Radiation Budget Project). |
Figure 9: Average Absorbed Solar Insolation at the Earth's Surface: July 1983-1990 + k)(1 - a) -- Highest values occur over the subtropical oceans of the Northern Hemisphere due to high solar input and little cloud coverage. Lowest values occur in areas of high surface reflection such as snow/ice covered surfaces like Greenland, cloudy regions such as storm tracks, and areas of low solar input like the high latitudes of the Southern Hemisphere. Color range: blue - red - white, Values: 0 - 350 W/m2. Global mean = 158 W/m2, Minimum = 0 W/m2, Maximum = 323 W/m2. (Source: NASA Surface Radiation Budget Project) |
Heating Imbalances
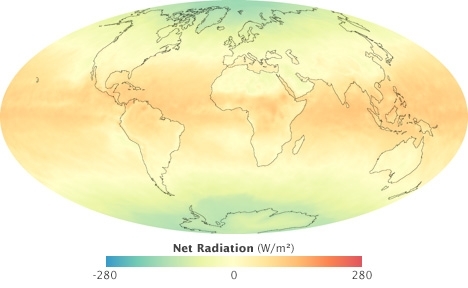
The differences in reflectiveness (albedo) and solar illumination at different latitudes lead to net heating imbalances throughout the Earth system. At any place on Earth, the net heating is the difference between the amount of incoming sunlight and the amount heat radiated by the Earth back to space (more below). In the tropics there is a net energy surplus because the amount of sunlight absorbed is larger than the amount of heat radiated. In the polar regions, however, there is an annual energy deficit because the amount of heat radiated to space is larger than the amount of absorbed sunlight.
The net heating imbalance between the equator and poles drives an atmospheric and oceanic circulation that climate scientists describe as a “heat engine.” (In our everyday experience, we associate the word engine with automobiles, but to a scientist, an engine is any device or system that converts energy into motion.) The climate is an engine that uses heat energy to keep the atmosphere and ocean moving. Evaporation, convection, rainfall, winds, and ocean currents are all part of the Earth’s heat engine.
Earth’s Energy Budget
Note: Determining exact values for energy flows in the Earth system is an area of ongoing climate research. Different estimates exist, and all estimates have some uncertainty. Estimates come from satellite observations, ground-based observations, and numerical weather models. The numbers in this article rely most heavily on direct satellite observations of reflected sunlight and thermal infrared energy radiated by the atmosphere and the surface.
Earth’s heat engine does more than simply move heat from one part of the surface to another; it also moves heat from the Earth’s surface and lower atmosphere back to space. This flow of incoming and outgoing energy is Earth’s energy budget. For Earth’s temperature to be stable over long periods of time, incoming energy and outgoing energy have to be equal. In other words, the energy budget at the top of the atmosphere must balance. This state of balance is called radiative equilibrium.
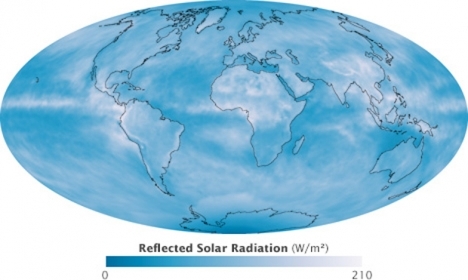
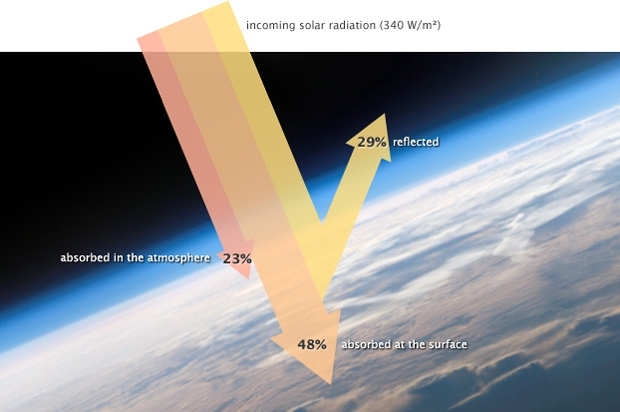
About 29 percent of the solar energy that arrives at the top of the atmosphere is reflected back to space by clouds, atmospheric particles, or bright ground surfaces like sea ice and snow. This energy plays no role in Earth’s climate system. About 23 percent of incoming solar energy is absorbed in the atmosphere by water vapor, dust, and ozone, and 48 percent passes through the atmosphere and is absorbed by the surface. Thus, about 71 percent of the total incoming solar energy is absorbed by the Earth system.
When matter absorbs energy, the atoms and molecules that make up the material become excited; they move around more quickly. The increased movement raises the material’s temperature. If matter could only absorb energy, then the temperature of the Earth would be like the water level in a sink with no drain where the faucet runs continuously.
Temperature doesn’t infinitely rise, however, because atoms and molecules on Earth are not just absorbing sunlight, they are also radiating thermal infrared energy (heat). The amount of heat a surface radiates is proportional to the fourth power of its temperature. If temperature doubles, radiated energy increases by a factor of 16 (2 to the 4th power). If the temperature of the Earth rises, the planet rapidly emits an increasing amount of heat to space. This large increase in heat loss in response to a relatively smaller increase in temperature—referred to as radiative cooling—is the primary mechanism that prevents runaway heating on Earth.
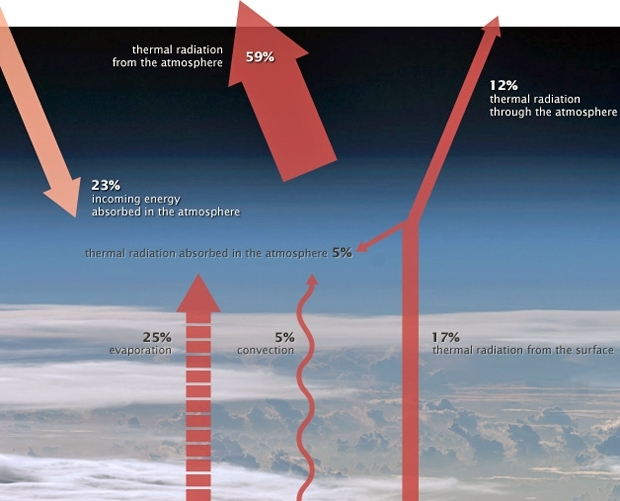
The atmosphere and the surface of the Earth together absorb 71 percent of incoming solar radiation, so together, they must radiate that much energy back to space for the planet’s average temperature to remain stable. However, the relative contribution of the atmosphere and the surface to each process (absorbing sunlight versus radiating heat) is asymmetric. The atmosphere absorbs 23 percent of incoming sunlight while the surface absorbs 48. The atmosphere radiates heat equivalent to 59 percent of incoming sunlight; the surface radiates only 12 percent. In other words, most solar heating happens at the surface, while most radiative cooling happens in the atmosphere. How does this reshuffling of energy between the surface and atmosphere happen?
Surface Energy Budget
To understand how the Earth’s climate system balances the energy budget, we have to consider processes occurring at the three levels: the surface of the Earth, where most solar heating takes place; the edge of Earth’s atmosphere, where sunlight enters the system; and the atmosphere in between. At each level, the amount of incoming and outgoing energy, or net flux, must be equal.
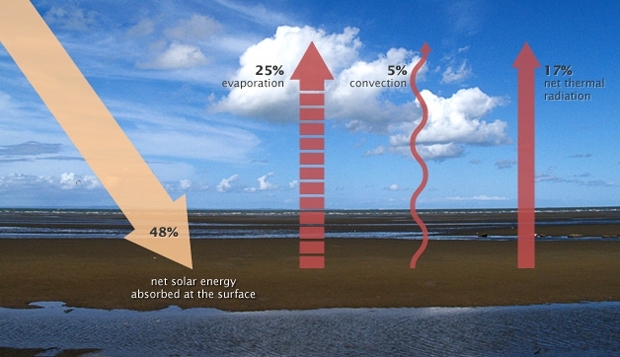
Remember that about 29 percent of incoming sunlight is reflected back to space by bright particles in the atmosphere or bright ground surfaces, which leaves about 71 percent to be absorbed by the atmosphere (23 percent) and the land (48 percent). For the energy budget at Earth’s surface to balance, processes on the ground must get rid of the 48 percent of incoming solar energy that the ocean and land surfaces absorb. Energy leaves the surface through three processes: evaporation, convection, and emission of thermal infrared energy.
About 25 percent of incoming solar energy leaves the surface through evaporation. Liquid water molecules absorb incoming solar energy, and they change phase from liquid to gas. The heat energy that it took to evaporate the water is latent in the random motions of the water vapor molecules as they spread through the atmosphere. When the water vapor molecules condense back into rain, the latent heat is released to the surrounding atmosphere. Evaporation from tropical oceans and the subsequent release of latent heat are the primary drivers of the atmospheric heat engine.
An additional 5 percent of incoming solar energy leaves the surface through convection. Air in direct contact with the sun-warmed ground becomes warm and buoyant. In general, the atmosphere is warmer near the surface and colder at higher altitudes, and under these conditions, warm air rises, shuttling heat away from the surface.
Finally, a net of about 17 percent of incoming solar energy leaves the surface as thermal infrared energy (heat) radiated by atoms and molecules on the surface. This net upward flux results from two large but opposing fluxes: heat flowing upward from the surface to the atmosphere (117%) and heat flowing downward from the atmosphere to the ground (100%). (These competing fluxes are part of the greenhouse effect, described below) Remember that the peak wavelength of energy a surface radiates is based on its temperature. The Sun’s peak radiation is at visible and near-infrared wavelengths. The Earth’s surface is much cooler, only about 15 degrees Celsius on average. The peak radiation from the surface is at thermal infrared wavelengths around 12.5 micrometers. See Box 2 for additional details and Box 3 for simple mathematical model.
|
Box 2. NASA's Surface Radiation Budget Project has used satellite data, computer models, and meteorological data to determine surface net shortwave radiation, net longwave radiation, and net radiation balances for the period July 1983 to June 1991. The following images display these balances for January and July globally: | |
|
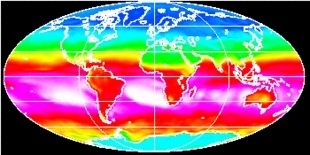
Figure 13. Average Net Shortwave Radiation at the Earth's Surface: January 1984-1991 (K*) -- Highest values occur along the subtropical oceans of the Southern Hemisphere. Lowest values occur over areas of high surface reflection such as the South Pole, cloudy regions, and areas of low solar input like the high latitudes of the Northern Hemisphere. Color range: blue - red - white, Values: 0 to 350 W/m2. Global mean = 162 W/m2, Minimum = 0 W/m2, Maximum = 315 W/m2. (Source: NASA Surface Radiation Budget Project). |
Figure 14. Average Net Shortwave Radiation at the Earth's Surface: July 1983-1990 (K*) -- Highest values occur over the subtropical oceans of the Northern Hemisphere due to high solar input and little cloud coverage. Lowest values occur in areas of high surface reflection such as snow/ice covered surfaces like Greenland, cloudy regions such as storm tracks, and areas of low solar input like the high latitudes of the Southern Hemisphere. Color range: blue - red - white, Values: 0 to 350 W/m2. Global mean = 158 W/m2, Minimum = 0 W/m2, Maximum = 323 W/m2. (Source: NASA Surface Radiation Budget Project). |
|
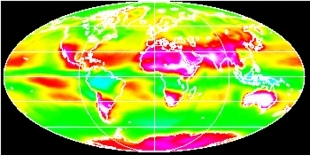
Figure 15. Average Net Longwave Radiation at the Earth's Surface: January 1984-1991 (L*) -- Net longwave loss is a negative quantity. Highest values of longwave loss occurs where surface temperatures are high and cloud cover is minimal, such as the subtropical deserts of the Northern and Southern Hemisphere. Cold surfaces have low values of loss. Color range: white - red - blue, Values: -100 to 0 W/m2. Global mean = -48 W/m2, Minimum = -125 W/m2, Maximum = -11 W/m2. (Source: NASA Surface Radiation Budget Project) |
Figure 16. Average Net Longwave Radiation at the Earth's Surface: July 1983-1990 (L*) -- Net longwave loss is a negative quantity. Highest values of longwave loss occurs where surface temperatures are high and cloud cover is minimal, such as the subtropical deserts of the Northern and Southern Hemisphere. Cold surfaces have low values of loss. Color range: white - red - blue, Values: -100 to 0 W/m2. Global mean = -47 W/m2, Minimum = -144 W/m2, Maximum = -4 W/m2. (Source: NASA Surface Radiation Budget Project). |
|
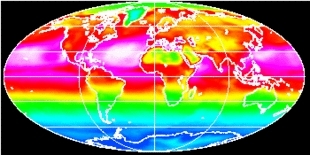
Figure 17. Average Net Radiation at the Earth's Surface: January 1984-1991 (Q*) -- Total net radiation is the sum of shortwave and longwave net radiation. It is dominated by the shortwave portion. Highest values occur along the subtropical oceans of the Southern Hemisphere. Lowest values occur over areas of low solar input such as the North Pole, and areas of high surface reflection such as the South Pole. Color range: blue - red - white, light green = 0 W/m2, Values: -50 to 250 W/m2. Global mean = 114 W/m2, Minimum = -60 W/m2, Maximum = 261 W/m2. (Source: NASA Surface Radiation Budget Project). |
Figure 18. Average Net Radiation at the Earth's Surface: July 1983-1990 (Q*)]] Total net radiation is the sum of shortwave and longwave net radiation. It is dominated by the shortwave portion. Highest values occur along the subtropical oceans of the Northern Hemisphere. Lowest values occur over areas of low solar input such as the South Pole, and areas of high surface reflection such as the North Pole. Color range: blue - red - white, light green = 0 W/m2, Values: -50 to 250 W/m2. Global mean = 111 W/m2, Minimum = -65 W/m2, Maximum = 249 W/m2. (Source: NASA Surface Radiation Budget Project). |
|
Box 2. Modeling Energy Balance The following equations can be used to mathematically model net shortwave radiation balance, net longwave radiation balance, and net radiation balance for the Earth's surface at a single location or for the whole globe for any temporal period: K* = [+ k)(1 - a)] L* = (LD - LU) Q* = [+ k)(1 - a)] -LU + LD where
|
Global Heat Balance: Introduction to Heat Fluxes
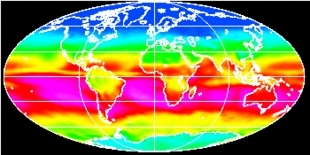
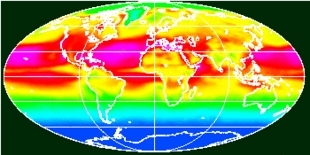
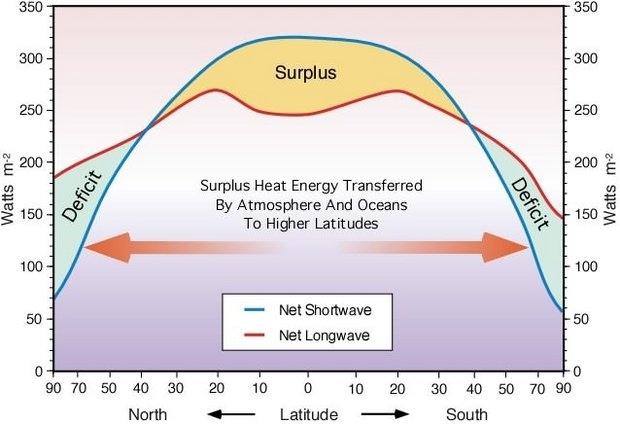
Figure 19 illustrates the annual values of net shortwave and net longwave radiation from the South Pole to the North Pole. On closer examination of this graph one notes that the lines representing incoming and outgoing radiation do not have the same values. From 0 - 30° latitude North and South incoming solar radiation exceeds outgoing terrestrial radiation and a surplus of energy exists. The reverse holds true from 30 - 90° latitude North and South and these regions have a deficit of energy. Surplus energy at low latitudes and a deficit at high latitudes results in energy transfer from the equator to the poles. It is this meridional transport of energy that causes atmospheric and oceanic circulation. If there were no energy transfer the poles would be 25° Celsius cooler, and the equator 14° Celsius warmer!
The redistribution of energy across the Earth's surface is accomplished primarily through three processes: sensible heat flux, latent heat flux, and surface heat flux into oceans. Sensible heat flux is the process where heat energy is transferred from the Earth's surface to the atmosphere by conduction and convection. This energy is then moved from the tropics to the poles by advection, creating atmospheric circulation. As a result, atmospheric circulation moves warm tropical air to the polar regions and cold air from the poles to the equator. Latent heat flux moves energy globally when solid and liquid water is converted into vapor. This vapor is often moved by atmospheric circulation vertically and horizontally to cooler locations where it is condensed as rain or is deposited as snow releasing the heat energy stored within it. Finally, large quantities of radiation energy are transferred into the Earth's tropical oceans. The energy enters these water bodies at the surface when absorbed radiation is converted into heat energy. The warmed surface water is then transferred downward into the water column by conduction and convection. Horizontal transfer of this heat energy from the equator to the poles is accomplished by ocean currents.
The following equation describes the partitioning of heat energy at the Earth's surface:
The actual amount of net radiation being partitioned into each one of these components is a function of the following factors:
- Presence or absence of water in liquid and solid forms at the surface.
- Specific heat of the surface receiving the net radiation.
- Convective and conductive characteristics of the receiving surface.
- Diffusion characteristics of the surface's overlying atmosphere.
The Atmosphere’s Energy Budget
Just as the incoming and outgoing energy at the Earth’s surface must balance, the flow of energy into the atmosphere must be balanced by an equal flow of energy out of the atmosphere and back to space. Satellite measurements indicate that the atmosphere radiates thermal infrared energy equivalent to 59 percent of the incoming solar energy. If the atmosphere is radiating this much, it must be absorbing that much. Where does that energy come from?
Clouds, aerosols, water vapor, and ozone directly absorb 23 percent of incoming solar energy. Evaporation and convection transfer 25 and 5 percent of incoming solar energy from the surface to the atmosphere. These three processes transfer the equivalent of 53 percent of the incoming solar energy to the atmosphere. If total inflow of energy must match the outgoing thermal infrared observed at the top of the atmosphere, where does the remaining fraction (about 5-6 percent) come from? The remaining energy comes from the Earth’s surface.
The Natural Greenhouse Effect
Just as the major atmospheric gases (oxygen and nitrogen) are transparent to incoming sunlight, they are also transparent to outgoing thermal infrared. However, water vapor, carbon dioxide, methane, and other trace gases are opaque to many wavelengths of thermal infrared energy. Remember that the surface radiates the net equivalent of 17 percent of incoming solar energy as thermal infrared. However, the amount that directly escapes to space is only about 12 percent of incoming solar energy. The remaining fraction—a net 5-6 percent of incoming solar energy—is transferred to the atmosphere when greenhouse gas molecules absorb thermal infrared energy radiated by the surface.
When greenhouse gas molecules absorb thermal infrared energy, their temperature rises. Like coals from a fire that are warm but not glowing, greenhouse gases then radiate an increased amount of thermal infrared energy in all directions. Heat radiated upward continues to encounter greenhouse gas molecules; those molecules absorb the heat, their temperature rises, and the amount of heat they radiate increases. At an altitude of roughly 5-6 kilometers, the concentration of greenhouse gases in the overlying atmosphere is so small that heat can radiate freely to space.
Because greenhouse gas molecules radiate heat in all directions, some of it spreads downward and ultimately comes back into contact with the Earth’s surface, where it is absorbed. The temperature of the surface becomes warmer than it would be if it were heated only by direct solar heating. This supplemental heating of the Earth’s surface by the atmosphere is the natural greenhouse effect.
Effect on Surface Temperature
The natural greenhouse effect raises the Earth’s surface temperature to about 15 degrees Celsius on average—more than 30 degrees warmer than it would be if it didn’t have an atmosphere. The amount of heat radiated from the atmosphere to the surface (sometimes called “back radiation”) is equivalent to 100 percent of the incoming solar energy. The Earth’s surface responds to the “extra” (on top of direct solar heating) energy by raising its temperature.
Why doesn’t the natural greenhouse effect cause a runaway increase in surface temperature? Remember that the amount of energy a surface radiates always increases faster than its temperature rises—outgoing energy increases with the fourth power of temperature. As solar heating and “back radiation” from the atmosphere raise the surface temperature, the surface simultaneously releases an increasing amount of heat—equivalent to about 117 percent of incoming solar energy. The net upward heat flow, then, is equivalent to 17 percent of incoming sunlight (117 percent up minus 100 percent down).
Some of the heat escapes directly to space, and the rest is transferred to higher and higher levels of the atmosphere, until the energy leaving the top of the atmosphere matches the amount of incoming solar energy. Because the maximum possible amount of incoming sunlight is fixed by the solar constant (which depends only on Earth’s distance from the Sun and very small variations during the solar cycle), the natural greenhouse effect does not cause a runaway increase in surface temperature on Earth.
Climate Forcings and Global Warming
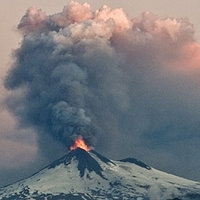
Any changes to the Earth’s climate system that affect how much energy enters or leaves the system alters Earth’s radiative equilibrium and can force temperatures to rise or fall. These destabilizing influences are called climate forcings. Natural climate forcings include changes in the Sun’s brightness, Milankovitch cycles (small variations in the shape of Earth’s orbit and its axis of rotation that occur over thousands of years), and large volcanic eruptions that inject light-reflecting particles as high as the stratosphere. Manmade forcings include particle pollution (aerosols), which absorb and reflect incoming sunlight; deforestation, which changes how the surface reflects and absorbs sunlight; and the rising concentration of atmospheric carbon dioxide and other greenhouse gases, which decrease heat radiated to space. A forcing can trigger feedbacks that intensify or weaken the original forcing. The loss of ice at the poles, which makes them less reflective, is an example of a feedback.
|
Figure 22. Things that change the balance between incoming and outgoing energy in the climate system are called forcings. Natural forcings include volcanic eruptions. Manmade forcings include air pollution and greenhouse gases. A climate forcing, such as greenhouse gas increases, may trigger feedbacks like the loss of sunlight-reflecting ice. (Photographs ©2008 antonio, ©2008 haglundc, and courtesy Mike Embree/National Science Foundation.) | ||
Carbon dioxide forces the Earth’s energy budget out of balance by absorbing thermal infrared energy (heat) radiated by the surface. It absorbs thermal infrared energy with wavelengths in a part of the energy spectrum that other gases, such as water vapor, do not. Although water vapor is a powerful absorber of many wavelengths of thermal infrared energy, it is almost transparent to others. The transparency at those wavelengths is like a window the atmosphere leaves open for radiative cooling of the Earth’s surface. The most important of these “water vapor windows” is for thermal infrared with wavelengths centered around 10 micrometers. (The maximum transparency occurs at 10 micrometers, but partial transparency occurs for wavelengths between about 8 and about 14 micrometers.)
Carbon dioxide is a very strong absorber of thermal infrared energy with wavelengths longer than 12-13 micrometers, which means that increasing concentrations of carbon dioxide partially “close” the atmospheric window. In other words, wavelengths of outgoing thermal infrared energy that our atmosphere’s most abundant greenhouse gas—water vapor—would have let escape to space are instead absorbed by carbon dioxide.
The absorption of outgoing thermal infrared by carbon dioxide means that Earth still absorbs about 70 percent of the incoming solar energy, but an equivalent amount of heat is no longer leaving. The exact amount of the energy imbalance is very hard to measure, but it appears to be a little over 0.8 watts per square meter. The imbalance is inferred from a combination of measurements, including satellite and ocean-based observations of sea level rise and warming.
When a forcing like increasing greenhouse gas concentrations bumps the energy budget out of balance, it doesn’t change the global average surface temperature instantaneously. It may take years or even decades for the full impact of a forcing to be felt. This lag between when an imbalance occurs and when the impact on surface temperature becomes fully apparent is mostly because of the immense heat capacity of the global ocean. The heat capacity of the oceans gives the climate a thermal inertia that can make surface warming or cooling more gradual, but it can’t stop a change from occurring.
The changes we have seen in the climate so far are only part of the full response we can expect from the current energy imbalance, caused only by the greenhouse gases we have released so far. Global average surface temperature has risen between 0.6 and 0.9 degrees Celsius in the past century, and it will likely rise at least 0.6 degrees in response to the existing energy imbalance.
As the surface temperature rises, the amount of heat the surface radiates will increase rapidly (see description of radiative cooling on Page 4). If the concentration of greenhouse gases stabilizes, then Earth’s climate will once again come into equilibrium, albeit with the “thermostat”—global average surface temperature—set at a higher temperature than it was before the Industrial Revolution.
However, as long as greenhouse gas concentrations continue to rise, the amount of absorbed solar energy will continue to exceed the amount of thermal infrared energy that can escape to space. The energy imbalance will continue to grow, and surface temperatures will continue to rise.
References
- Much of the text and images in this article came from the article Climate and Earth’s Energy Budget by Earth Observatory, NASA Goddard Space Flight Center, January 14, 2009
- Cahalan, R. (n.d.) Solar and Earth Radiation. Accessed December 12, 2008.
- Hansen, J., Nazarenko, L., Ruedy, R., Sato, M., Willis, J., Del Genio, A., Koch, D., Lacis, A., Lo, K., Menon, S., Novakov, T., Perlwitz, J., Russell, G., Schmidt, G.A., and Tausnev, N. (2005). Earth’s Energy Imbalance: Confirmation and Implications. Science, (308) 1431-1435.
- Kushnir, Y. (2000). Solar Radiation and the Earth’s Energy Balance. Published on The Climate System, complete online course material from the Department of Earth and Environmental Sciences at Columbia University. Accessed December 12, 2008.
- Peixoto, J., and Oort, A. (1992). Chapter 6: Radiation balance. In Physics of Climate (pp. 91-130). Woodbury, NY: American Institute of Physics Press.
- Peixoto, J., and Oort, A. (1992). Chapter 14: The ocean-atmosphere heat engine. In Physics of Climate (pp. 365-400). Woodbury, NY: American Institute of Physics Press.
- Marshall, J., and Plumb, R.A. (2008). Chapter 2: The global energy balance. In Atmosphere, Ocean, and Climate Dynamics: an Introductory Text (pp. 9-22).
- Marshall, J., and Plumb, R.A. (2008). Chapter 4: Convection. In Atmosphere, Ocean, and Climate Dynamics: an Introductory Text (pp. 31-60).
- Marshall, J., and Plumb, R.A. (2008). Chapter 8: The general circulation of the atmosphere. In Atmosphere, Ocean, and Climate Dynamics: an Introductory Text (pp. 139-161).
- Trenberth, K., Fasullo, J., Kiehl, J. (2009). Earth’s global energy budget. Bulletin of the American Meteorological Society.
- PhysicalGeography.net
| Disclaimer: This article is taken wholly from, or contains information that was originally published by, the NASA. Topic editors and authors for the Encyclopedia of Earth may have edited its content or added new information. The use of information from the NASA should not be construed as support for or endorsement by that organization for any new information added by EoE personnel, or for any editing of the original content. |

