Demand for minerals in the United States
Demand for minerals in the United States is addressed in this article in terms of a variety of consumption sectors including transportation, construction and consumer choice areas that have major demand for minerals. The word demand has different meanings for different people. To some, it means wants and needs, to others it is what they consume. Yet, when considering economics, demand refers to the specific amounts of goods or services that individuals will purchase at various prices. Demand is measured over a given time period. It is determined by a number of factors including income, tastes, and the price of complementary and substitute goods. In this paper, the term consumption is used fairly synonymously with the term demand. Most mineral commodities, like iron ore, copper, zinc, and gravel, are intermediate goods, which means that they are used in the production of other goods, called final goods. Demand for intermediate goods is called derived demand because such demand is derived from the demand for final goods.
When demand increases for a commodity, generally the price rises. With everything else held constant, this increases the profits for those who provide this commodity. Normally, this would increase profits of existing producers and attract new producers to the market. When demand for a commodity decreases, generally the price falls. Normally, this would cause profits to fall and, as a consequence, the least efficient firms may be forced from the industry.
Demand changes for specific materials as final goods or production techniques are re-engineered while maintaining or improving product performance, for example, the use of aluminum in the place of copper in long distance electrical transmission lines or plastic replacing steel in automobile bumpers. Substitution contributes to efficient material usage by utilizing cheaper or technically superior materials. In this way, it may also alleviate materials scarcity. If a material becomes relatively scarce (and thus more expensive), a more abundant (and less expensive) material generally replaces it.
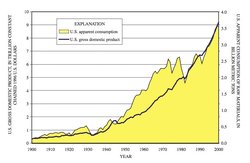
As the increasingly affluent Americans entered the 21st century, they continued to increase their consumption of goods and services. A reflection of this demand is seen in the U.S. gross domestic product (GDP) (figure 1). GDP represents the production of all final goods and services within a country and is the broadest measure of the wealth of a country’s economy. The overall U.S. economy, represented by GDP, rose from 311 billion dollars in 1900 to 9,224 billion dollars in 2000 (in constant chained 1996 dollars), an average annual increase of 88 billion dollars.
Contents
Derived Demand[1]
The demand for each of the factors (components) of production is often referred to as a derived demand. This emphasizes the relation between demand for the final good(s) and the demand for the factors used in production. If for some reason the demand for high-performance batteries would increase, then the “derived demand” for lithium used in the manufacturing of batteries could also increase. Likewise, the demand for labor (another factor) in the battery industry could also increase in response to the public’s greater demand for batteries. Since mineral commodities are usually not final goods, as they are used in the manufacturing of final goods, the demand for most mineral commodities is a derived demand.
Palladium's Demand and Supply Fluctuations[2]
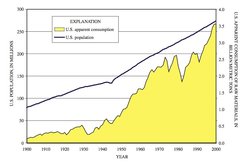 Figure 2: U.S. population and total apparent consumption of raw materials by weight, 1900–2000. (Source: U.S. Census Bureau, 2001; and Kelly and Matos, 2004)
 Anticipating price increases associated with higher demand and lower supply of palladium metal (purchased for use in catalytic converters), Ford Motor Company had built an unusually large inventory stock by the beginning of 2002. Ford’s stockpile resulted from growing needs and uncertainties associated with irregular supplies from {C}Russia and South Africa, where most of the world’s output comes from. For most of the last three decades, progress in emissions technology had relied on increasing use of the related precious metals platinum, palladium, and rhodium. Through most of the 1980s, platinum was viewed as the most effective of the metal catalysts. Palladium, which was cheaper, was not widely used in the auto industry. From 1992 to 1996, global auto-industry demand for the palladium metal nearly quintupled, to 2.4 million troy ounces, according to estimates by Johnson Matthey plc, 2006. Prices rose along with demand in the early 1990s, but automakers expected the market would continue to remain roughly in balance, according to industry veterans. But in 1997, the Russians upset the market’s stability by holding up palladium shipments. By early 1998, this disruption to supply resulted in a price surge to a then record level of $350 per troy ounce. Palladium prices jumped again in 1999, amid continuing uncertainty about Russian shipments and by spring 2000, the major metals exchange in Tokyo temporarily froze the price of palladium at $700 per troy ounce.
Ford, which by some estimates was the heaviest palladium user in the auto industry, consumed about 1.5 million troy ounces of the metal in North America in 2000 by Johnson Matthey plc estimates. As Ford continued buying in the beginning of 2001, the company was focused only on building up supplies to protect against a lack of material that would halt production. Continued anxiety about Russian supplies pushed prices to a new record of $1,094 per troy ounce in January, 2001. On the supply side, high prices had spurred mine operators in South Africa to increase palladium production. Concurrently, the unpredictable Russian supply began to stabilize after reaching the peak price above $1,000 per troy ounce in January 2001.
| Table 1: U.S. apparent consumption annual average growth rate, in percent, by decades, 1900-2000, and yearly for 1991-2000 | |||
| Decade | U.S. apparent consumption percentage growth rate | Year | U.S. apparent consumption percentage growth rate |
| 1900-10 | 6.5 | 1991 | -6.2 |
| 1910-20 | 0.8 | 1992 | 4.3 |
| 1920-30 | 4.2 | 1993 | 6.0 |
| 1930-40 | 1.7 | 1994 | 6.1 |
| 1940-50 | 4.8 | 1995 | 1.5 |
| 1950-60 | 5.1 | 1996 | 4.7 |
| 1960-70 | 3.3 | 1997 | 2.6 |
| 1970-80 | 0.2 | 1998 | 5.0 |
| 1980-90 | 1.6 | 1999 | 4.2 |
| 1990-2000 | 3.0 | 2000 | 2.9 |
| Source: Kelly and Matos, 200 | |||
By late 2001, improved catalytic converters would allow Ford to reduce its use of precious metals by 50 percent. Ford now had excessive inventory that it had much less need for and overall demand generally began to fall as supplies stabilized. It appeared that the value of Ford’s inventory of palladium was about to plunge. Demand was falling because other automakers had also succeeded in reducing their use of palladium. Likewise, demand from the electronics industry, which also consumes a large amount of palladium for use in capacitors, had diminished with the overall weakening of the world economy. The precious metal markets responded to the decrease in demand and increase in supply as palladium prices fell steadily to their lowest levels since 1999 -- about $350 per troy ounce. In January 2002, Ford Motor Company wrote down $1 billion as they marked down the value of its excess holdings to the market price at the end of 2001, which was $440 per troy ounce.
Population
Although an increasing population demands more materials, significant economic events, such as the Great Depression of the 1930s, the oil crisis in the 1970s, and the 1980s recession negatively affected mineral demand. As shown in figure 2, the U.S. population has steadily increased, with the exception of a period during World War II, throughout the 20th century. Meanwhile, U.S. consumption of nonfood and nonfuel raw materials[3] trended similarly to the U.S. population with significant downturns during the economic events noted above.
Consumption
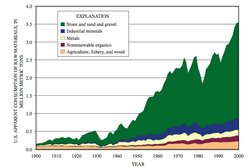 Figure 3: U.S. apparent consumption of raw materials by weight, 1900–2000. (Source: Kelly and Matos, 2004)
 Consumption of raw materials from 1900–2000, as measured by domestic apparent consumption[4], increased from 134 million metric tons (Mt) to 3.56 billion metric {C}tons (Gt), more than a 26-fold increase. During this time period, U.S. consumption of raw materials grew at an average annual rate of 3.1 percent or approximately 21/2 times the U.S population growth rate of 1.3 percent. Table 1 lists the average annual growth rates of U.S. consumption over the decades within the 20th century and for individual years from 1991 through 2000.
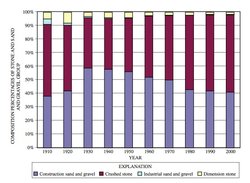 Figure 4: Components of stone and sand and gravel group, 1900–2000. (Source: Kelly and Matos, 2004)
 The domestic consumption of selected raw material groups during the 20th century is shown in figure 3. This graph clearly shows that the growth of the stone and sand and gravel group overwhelms the growth in the other groups. In the year 2000, the stone and sand and gravel group represented more than 76 percent of total U.S. apparent consumption, based on weight. The stone and sand and gravel group is composed of four mineral commodities: construction sand and gravel, industrial sand and gravel, crushed stone, and dimension stone. Since the mid-1950s, dimension stone and industrial sand and gravel have made up less than two percent of this group. The remaining two commodities, construction sand and gravel and crushed stone, defined as construction aggregate, account for the majority of raw materials consumed during the 20th century. These aggregates are key components in the construction of the interstate highway system. Reviewing the bar chart in figure 4, construction sand and gravel and crushed stone, combined, represent more than 90 percent of the stone and sand and gravel group from 1900 to 2000.
Construction
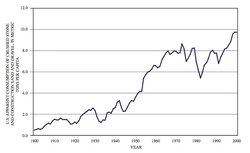 Figure 5: U.S. apparent consumption of crushed stone and construction sand and gravel per capita, 1900–2000. (Source: U.S. Census Bureau, 2001; and Kelly and Matos, 2004)
 Population growth along urban corridors throughout the United States, such as the Baltimore-Washington corridor or the Denver-Boulder Front Range corridor, not only required materials for constructing new buildings (residential and commercial), but also continued to place constraints on the transportation infrastructure. Heavy use resulted in increased necessity of maintenance, replacement, and additions to existing infrastructure. Apparent consumption per person of aggregates was only slightly more than 0.5 metric ton (t) in 1900, but by 2000 had jumped by a factor of about 20, to 9.7 t (figure 5). The economic slow-down of the early 1980s and 1990s and the resultant decline of apparent consumption are shown in figure 5.
In 2002, 1530 Mt of crushed stone (DiFrancesco and Tepordei, 2004) and 1130 Mt of construction sand and grave were consumed. The next two mineral commodities in order of amount consumed were cement (110 Mt) and steel (107 Mt), more than a magnitude of order less (in weight) than the aggregates.
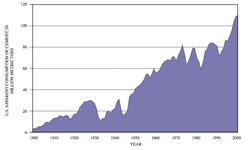 Figure 6: U.S. apparent consumption of cement, 1900–2000. (Source: Kelly and Matos, 2004)
 Production and consumption of cement are fundamental indicators of the health of the construction industry. Almost all cement is incorporated into concrete that is used in the construction of bridges, buildings, highways, and other infrastructure. In general, the demand for cement (and cement-based products) expanded during the 20th century, paralleling the growth in the construction industry. After World War II, the construction of the U.S. infrastructure was set in motion and consumption of cement surged, continuing until the late 1960s. For the next 20 years, cement consumption was volatile; in the 1990s, its upward trend resumed (figure 6).
When the demand for infrastructure expands, the demand for steel also increases. Steels, which are primarily alloys of iron and carbon, are the predominant structural engineering materials, and the building material of choice for commercial construction for reasons of strength, durability, and recyclability. In addition to such large construction projects as steel bridges, steel has established a presence in residential home building. The distribution of iron and steel products to the construction sector has trended upward during the period from 1980 through 2000 and is shown in figure 7.
| Table 2: Materials used to build a typical 2,272-square foot single-family home | |
|
|
Amount |
| Bathtubs | 2 |
| Cabinets, kitchen | 15 |
| Cabinets, other | 5 |
| Ceiling material | 2,334 sq ft |
| Concrete | 19 tons |
| Doors, closet | 6 |
| Doors, exterior | 3 |
| Doors, patio | 1 |
| Ducting | 226 linear feet |
| Fireplace | 1 |
| Flooring materials | 2,269 sq ft |
| Insulation | 3.061 sq ft |
| Lumber, framing | 13,837 board feet |
| Roofing material | 3,103 sq ft |
| Shething | 13,118 sq ft |
| Shower stall | 1 |
| Siding, exterior | 3,206 sq ft |
| Sinks, bathroom | 3 |
| Toilets | 3 |
| Wall finish, interior | 6,050 sq ft |
| Windows | 19 |
| Source: National Association of Home Builders, 200 | |
Highways and Bridges
 Figure 7: U.S. iron and steel products used in the construction sector, 1980–2000. (Source: Kelly and Matos, 2004)
 Every day, almost four billion vehicles cross bridges in the United States. The public expects these structures to be safe and accommodate this volume of traffic. However, aging highway infrastructure and increasing traffic means that maintenance has become a major focus necessary to ensure the safety of the people who use the U.S. transportation system.
In the 1990s, legislators directed funds into the U.S. infrastructure with the intention of improving bridges and roads and thereby increasing safety. More construction funding, authorized by the Intermodal Surface Transportation Efficiency Act of 1991 (ISTEA) and the Transportation Equity Act for the 21st Century (TEA–21) in 1998, resulted in the improvement of many highways. With generally better pavements and increased capacity, the new or improved highways are safer, and traffic flows more smoothly. From 1990 through 2003, the total Federal highway program cost outlays more than doubled from $14.3 to $30.2 billion. This included $6.4 billion for the national highway system, 21.3 percent of total; $3.3 billion for the bridge program, 11.0 percent of total; and $127.6 million for safety, less than 1.0 percent of total.
As the U.S. population increased during the 20th century, the total number of occupied housing units rose from 16 million units in 1900 to 107 million units in 2000. The average floor area of a residence has also increased substantially, while the average size of a residential plot area has declined as land values have steadily increased. The size of a typical new home in 1900 was 1000 to 1200 square feet compared to 2265 square feet in 2000. The demand for building materials has soared as a result of the new construction of more and larger homes. Many different types of material go into building a single-family home. Table 2 was compiled by the National Association of Home Builders and shows a list of the materials used to build a typical 2272-square-foot home.
Residential Housing
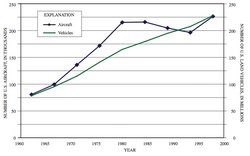 Figure 8: Number of U.S. vehicles and aircraft, 1960–2000. (Source: U.S. Bureau of Transportation Statistics, 2004b)
 From size and configuration to quality and convenience, U.S. housing changed dramatically during the 20th century, evolving to the point where new homes provide comforts and a quality of life unknown to previous generations. For most Americans, housing quality improved for throughout the 20th century. This is obvious by looking at almost any measure. In 1900, a typical new home had one or no bathroom and two or three bedrooms. In 2000, the typical American new home contained three or more bedrooms, two and one-half bathrooms, a garage for two or more cars, and central air conditioning.
Transportation
The transportation industry accounted for 270 billion constant 1996 dollars or almost three percent of the U.S. GDP in 2001. The manufacturing of vehicles consumes vast quantities of {C}raw materials, such as aluminum, copper, glass, iron and steel, lead, platinum-group metals, plastics, rubber, tungsten, and zinc.
| Table 3: U.S. apparent consumption of raw materials used in the transportation sector, 1975-2000 | |||||
| In metric tons. NA, not available. | |||||
| Year | Aluminum | Copper | Iron and steel |
Lead: Gasoline additives |
Lead: Storage batteries |
| 1975 | 663,000 | 190,000 | NA | 189,000 | 635,000 |
| 1980 | 868,000 | 240,000 | 15,000,000 | 128,000 | 645,000 |
| 1985 | 1,100,000 | 280,000 | 13,000,000 | 46,000 | 841,000 |
| 1990 | 1,110,000 | 260,000 | 11,400,000 | 16,000 | 1,020,000 |
| 1995 | 1,990,000 | 280,000 | 13,300,000 | NA | 1,330,000 |
| 2000 | 2,760,000 | 310,000 | 14,600,000 | NA | 1,490,000 |
| Source: Kelly and Matos, 200 | |||||
Iron and steel, by far, account for the bulk of materials that go into the manufacturing of vehicles. However, aluminum consumption has risen faster than that of iron and steel, the latter being relatively flat during the period from 1975 to 2000 (table 3). With the exception of lead used as a gasoline additive (phased out by 1996) and iron and steel, the use of the commodities listed in table 3 increased between 1975 and 2000. Aluminum consumption had the largest increase, more than quadrupling during this time period.
| Table 4: U.S. passenger-miles of travel by mode, in millions, 1985-2000 | ||||
| Mode | 1985 | 2000 | 1985-2000 Percentage change |
2000 Percentage of total |
| Air totala | 290,136 | 531,329 | 83.1 | 11.2 |
| Highway total | 2,889,449 | 4,184,556 | 44.8 | 88.1 |
| Busb | 94,925 | 160,919 | 69.5 | 3.4 |
| Light truck | 688,091 | 1,467,664 | 113.3 | 30.9 |
| Motorcycle | 11,812 | 11,516 | -2.5 | 0.2 |
| Passenger car | 2,094,621 | 2,544,457 | 21.5 | 53.6 |
| Transit totalc | 18,420 | 26,425 | 43.5 | 0.6 |
| Rail, Amtrak | 4,825 | 5,498 | 13.9 | 0.1 |
| Totald | 3,202,830 | 4,747,808 | 48.2 | 100 |
| Source: U.S. Bureau of Transportation Statistic, 2004c | ||||
| a Excludes heavy trucks because their function is to transport goods b Comprises all travel by bus including intercity, transit, and school bus c Excludes bus and includes travel by commuter, heavy, and light rail, ferry boat and others d Excludes passenger-miles of travel by bicycle, walking, and boat because national estimates are not available on an annual basis. | ||||
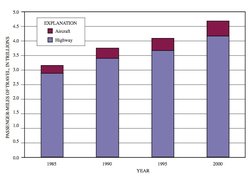 Figure 9: Passenger-miles of travel by aircraft and highway, 1960–2000. (Source: U.S. Bureau of Transportation Statistics, 2004c)
 Figure 8 illustrates the trends for the increasing number of U.S. aircraft, and land vehicles. The number of U.S. land vehicles increased from 76.5 million in 1960 to 227 million in 2000, a 2.7 percent average annual growth rate (Economic growth). In contrast, the number of U.S. aircraft appeared to have peaked in 1980, followed by a slight decrease until 2000, when the number increased to a new high. From 1960 to 2000, the number of U.S. aircraft, increased from 78,700 to 226,000, a 2.6 percent average annual growth rate, which is about the same as that of land vehicles.
Another example of the increasing demand placed on the transportation sector is illustrated in table 4, where the transportation demand, measured in passenger-miles of travel (PMT), is shown for various modes. Total U.S. PMT increased more than 48 percent from 1985 to 2000, going from 3.20 trillion to 4.75 trillion. From 1985 to 2000, the light truck mode had the highest percentage increase in PMT, rising 113 percent (figure 9). The light truck mode includes minivans, pickup trucks, and sport utility vehicles (SUVs). This large change may be attributed to Americans replacing their passenger cars with SUVs. From 1992 to 1997, the number of SUVs on American roads doubled to 13.8 million vehicles. In the same period the number of vehicles included in the category of light trucks was higher than the number of passenger cars for the first time. The increase in the number of vehicles, the number of miles traveled, plus a shift to larger vehicles increases the amount of materials needed to manufacture the vehicles and to construct and maintain the roads and highways to handle the higher volume of traffic.
Legislation
Legislation can significantly affect the derived demand for materials. The U.S. Environmental Protection Agency (EPA) was established in 1970 with the mission to protect human health and to safeguard the natural environment—air, water, and land. Through a broad range of Federal statutes, EPA gathers health, safety, and exposure data and controls human and environmental exposures for numerous chemical substances and mixtures. EPA regulates the production and distribution of commercial and industrial chemicals in order to ensure that chemicals made available for sale and use in the United States do not harm human health or the environment.
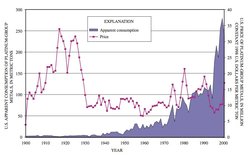 Figure 10: U.S. apparent consumption and price of platinum-group metals in constant 1998 dollars, 1900–2000. (Source: Kelly and Hilliard, 2004)
 Air pollution (Air pollution emissions) comes from many different sources, such as factories, power plants, dry cleaners, cars, buses, trucks, and even windblown dust and wildfires. Air pollution can threaten the health of animals, crops, human beings, lakes, and trees, as well as damage the ozone layer. EPA protects human health and the environment through the regulatory process and voluntary programs, such as Energy Star and Commuter Choice. Under the Clean Air Act (CAA), EPA sets limits on how much of a pollutant is allowed in the air. The CAA was passed in 1970 with amendments in 1977 and 1990. The CAA provides public health protection by improving the quality of the air. One example is the use of catalytic converters for cars starting with the 1977 model year. Because of the vast number of vehicles within the United States, laws relative to emissions necessitated the addition of millions of control devices, such as catalytic converters which are manufactured of specific materials based on performance.
The impact on platinum-group metals (PGM) resulting from use of catalytic converters on U.S. automobiles is shown in figure 10. The sharp increase in domestic consumption occurred even as prices, shown in constant 1998 dollars per metric ton, increased.
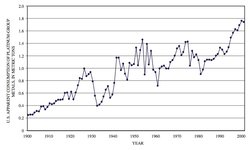 Figure 11: U.S. apparent consumption of lead, 1900–2000. (Source: DiFrancesco and Smith, 2002)
 Growing public awareness and concern for controlling water pollution led to enactment of the Federal Water Pollution Control Act Amendments of 1972. As amended in 1977, this law became commonly known as the Clean Water Act, which, through EPA, established the basic structure for regulating discharges of pollutants into the waters of the United States. The use of mercury is an example of legislation altering consumption patterns. In 1970, U.S. apparent consumption of mercury was 2120 t, but by 1997 (most recent year data was available), it had decreased to 346 t. Because of mercury’s {C}toxic nature, however, various rules and regulations were enacted, especially in the 1970s, to eliminate or curtail human exposure to mercury. In March 2004, EPA issued the Clean Air Mercury rule to cap and reduce mercury emissions for coal-fired power plants, and the Clean Air Interstate rule to reduce air pollution (Air pollution emissions) that crosses interstate boundaries.
Since the 1980s, EPA and its Federal partners have phased out the use of lead in gasoline (table 3) and banned or limited lead use in consumer products, including residential paints. Yet, apparent consumption of lead has continued to rise. U.S. lead consumption increased from 253,000 t in 1900 to 1.74 Mt in 2000. Reviewing figure 11, the overall trend in domestic lead consumption has shown a general increase except for temporary declines in the early 1930s attributed to the Great Depression and declines in the 1960s and the 1980s because of economic slowdowns. An explanation for the continuing increase in domestic consumption, in spite of regulations limiting its use, can be credited to increasing demand for lead-acid batteries.
Referring back to table 3, apparent consumption of lead in batteries in the transportation sector more than doubled from 635,000 t in 1975 to 1.49 Mt in 2000. Lead-acid batteries, starting-lighting-ignition and industrial types, continue to be the overwhelming dominant use of lead, representing about 83 percent of reported lead consumption in 2002. Lead-acid batteries have the highest recycling rate of any product sold in the United States. This is because of the ease of returning a used battery when purchasing a new battery, the financial incentive to return the used battery, and the value of the lead components of the used battery. Most States have enacted legislation to encourage the return of used lead-acid batteries. Secondary lead, derived principally from scrapped lead-acid batteries, accounted for 81 percent of refined lead production in the United States in 2002. Because a large share of the lead consumed in the United States is acquired through this recycled (secondary) source, the demand for virgin (primary) lead is reduced. The influence of recycling on demand is discussed further within this report in the section on recycling.
The Energy Policy Conservation Act, enacted into law by Congress in 1975, added title V (Improving Automotive Efficiency) to the Motor Vehicle Information and Cost Savings Act and established the corporate average fuel economy (CAFE) standards for passenger cars and light trucks. The act was passed in response to the 1973–74 Arab oil embargo with a near-term goal to double new car fuel economy by model year 1985. These laws prescribed an average fuel efficiency requirement for the total vehicle fleet produced by each auto manufacturer and were progressively tightened from 18 miles per gallon (mpg) in 1978 to 27.5 mpg in 1985. Manufacturers had to balance the production of heavier, larger cars with the production of lightweight, smaller cars. Since the CAFE standards were established, one of the methods car manufacturers have used to meet them is to design lighter vehicles. During the past several decades, two viable alternatives for steel in automobiles have been plastic and aluminum. Some examples of substitution for steel parts are plastic bumpers, plastic fuel tanks, aluminum engine blocks, and aluminum wheels. The legislation has helped Americans to reduce, to some extent, their dependence on foreign oil.
Consumer Choices
Today, only a small fraction of {C}consumption in the {C}United States is actually for basic survival (food and shelter); most is for pleasure and to express one’s standing in society.
| Table 5: U.S. estimated indium consumption and annual average indium price, 2000-04 | |||||
| Item | 2000 | 2001 | 2002 | 2003 | 2004 |
| Consumption, estimated, metric tons |
55 | 65 | 85 | 90 | 90 |
| Price, annual average, dollars per kilogram (99.97% indium) |
188 | 120 | 97 | 170 | 600 |
| Source: George, 2005 | |||||
Although some segments of the population attempt to live the simple life by using less, lifestyles continue to shape {C}demand for products and the derived demand for materials.
As one example, the surge in technological advancements in the electronics industry has provided consumers with a wide variety of choices, such as cellular phones, laptop computers, high-definition TVs, and digital cameras. In maintaining their competitive position, manufacturers will often modify their products by incorporating cost-effective upgrades which sometimes use new, little known materials; one such material is indium.
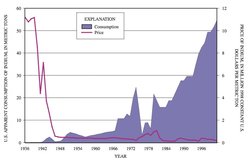 Figure 12: U.S. apparent consumption and price of indium in constant 1998 dollars, 1936–2000. (Source: DiFrancesco and George, 2004)
 For decades, the main use of indium has been in solders. Recently, it has become a critical component in the manufacturing of liquid crystal display (LCD) screens and monitors. In this use, indium tin oxide (ITO) thin-film coatings are applied on glass that is used as flat-panel televisions, laptop computer screens, or as liquid crystal displays for watches. Figure 12 shows the remarkable increase in consumption of indium at the end of the 20th century. Yet, when reviewing the price curve through 2000, there appears to be no reaction to this extraordinary increase in demand for indium.
The downward trend in annual average indium prices that began in 1996 and continued through mid-year 2000, was because indium is a byproduct of zinc processing. Increases in zinc supply tend to increase the supply of indium. Indium’s supply is affected by only those zinc smelters that have zinc concentrate feed that contains sufficient indium and the required processing facilities to recover indium, however.
More recently, continued strong sales of flat panel displays and other liquid crystal display (LCD) products increased consumption of indium tin oxide, mostly in Japan, the Philippines, the Republic of Korea, and Taiwan, well beyond the available production capacity. The report of reduced production from mines that produce byproduct indium and the closure of several smelters because of environmental problems created the perception that supplies of indium from China would decrease, which drove world prices to historic highs. The price rose from $97 per kilogram in 2002 to an estimated $600 per kilogram in 2004 as shown in table 5. Although the short-range outlook for indium demand remains positive, market supply remains questionable because of its heavy dependence on the strength of the zinc market. With the increasing capacity of indium tin oxide refineries and CD plants in Japan, the Philippines, the Republic of Korea, and Taiwan, and with China opening new indium tin oxide refineries and LCD plants, the availability of primary indium feedstock will be further reduced. Recycling efforts, especially in Japan, have done much to offset shortages in supply and to alleviate price pressures.
Another example of how consumer choice affects demand is illustrated in the development of the automobile. Over time, the automobile has changed size significantly; first increasing in size, then decreasing its size and in recent years again increasing in size. The original increases were due to developing complexity of the automobile, especially in regards to its carrying capacity, capabilities, and luxury. Larger engines satisfied the increased need for power to accommodate these changes, especially the extra weight and the desire to obtain higher traveling speeds. During the 1970s, fuel economy became an important concern to consumers, leading to the regulations mentioned above. To meet the demands of these regulations, the automobile ultimately became smaller and more practical. This “downsizing” led not only to sweeping changes in automobile design, but also to great changes in the materials used to construct the average automobile. By the mid-1980s, however, the cycle reversed again as larger vehicles became the standard and SUVs dominated automobile sales. More recently, because of an increase in oil prices, hybrid automobiles are in higher demand and the evaluation of alternate fuels as a source of energy has escalated.
Hybrid Vehicles[5]
When it comes to transportation, hybridization is not new. Hybrid cars and trucks that combine an electric motor with a gasoline engine date back to the beginning of the 20th century. Hybrid diesel-electric locomotives have been in operation for years, and in the 1970s small numbers of diesel-electric buses began to appear. On a smaller scale, a moped is a hybrid—it combines the power of a gasoline engine with the pedal power of the rider. So, any vehicle that combines two or more sources of power is a hybrid vehicle. Today, however, when hybrid and vehicle are used together, that vehicle, according to the U.S. Department of Energy (Department of Energy Organization Act of 1977, United States), is a hybrid electric vehicle (HEV). These vehicles combine an internal combustion engine and a battery with an electric motor.
Hybrid vehicles offer benefits that their conventional counterparts do not have, such as increased fuel economy and fewer harmful emissions. Today’s gasoline-electric hybrid systems are very complex, high-tech wonders in design and operation. For example, there are two different types of HEV powertrains or configurations. One is called a parallel configuration, the other a series configuration. But the auto industry apparently believes that using these terms would confuse consumers, so instead a parallel HEV is being called a “full hybrid” and a series HEV is a “mild hybrid.” In simple terms, a parallel system can be powered by the gas engine only, the electric motor only, or both at the same time. A series-type hybrid is where the electric motor assists the gasoline engine when needed, such as during acceleration or times of heavy load, but doesn’t power the car on its own.
There are additional types of hybrid systems and experimental and prototype hybrid vehicles, but these have yet to be proven, practically and economically. It appears that hybrids are here to stay until the hydrogen economy and its fuel-cell vehicles become available commercially. Increased use of hybrid vehicles could alter the current mix of materials used by the automotive sector.
Research and application of fuel cell technology that uses hydrogen as a fuel to produce energy has increased dramatically during the past several years. Research is focused on power generation for use in commercial electricity generation plants and for electric motors in the automotive sector. A potential driver for future demand of PGM, especially platinum, is their widespread use in hydrogen fuel-cell technology. To be successful, the technology must be affordable and reliable, hydrogen must be produced with minimal negative impacts on the environment, and safe and sufficient transport and storage of the gas must be achievable. While many scientists agree that hydrogen-fuel-cell use will increase with advances in technology and a commensurate decrease in cost (between 10 and 20 percent of the cost of a fuel cell system is attributed to platinum), there is disagreement as to the extent of use of the technologies and the impact on future PGM demand, especially in the automotive sector.
Recycling
For the purpose of this report, recycling is defined as recovering the material contained in a product at the end of that product’s useful life, and recovering residual materials from manufacturing. It takes place when the value of the recycled material is sufficient enough to make its recovery profitable. This can take place through natural market forces or when regulations or taxes make recycling financially attractive. When materials are recycled, they become valuable resources instead of waste. By supplementing the quantity of material available to the market, recycling conserves virgin material and makes more material available to the market. Recycling also reduces the demand for virgin material.
As U.S. mineral consumption rose during the 20th century, domestic secondary production (recycling of postconsumer scrap) of mineral-based materials became an increasingly important national supply source. Recycling is a significant factor in the supply of many of the metals used in our society, and provides environmental benefits in terms of energy savings (relative to the extraction and processing of virgin ore), reduced emissions associated with the energy savings, and reduced volumes of waste.
The automobile industry supplies steel and lead to the recycling stream. As measured by recycled metal as a percentage of apparent metal supply in 2002, lead was the most recycled at 71 percent, followed by iron and steel at 58 percent. Lead recycling has remained the highest percent recycled commodity primarily because of local and federal legislation making recycling mandatory for automobile batteries. The worldwide demand for raw and recycled materials has increased as a result of international industrialization, especially in China and in India. China is experiencing unprecedented growth as it builds its national infrastructure in preparing to host the 2008 Olympics. Some economists have compared China’s economy to the rapid industrialization and urbanization that the United States experienced in the 19th century, but with more middle-class buying power for consumer products. India’s infrastructure is already better established than China’s, but the Indian middle class is growing quickly, which in turn is increasing consumer demand for consumer products. Demand for recycled materials by manufacturers as an alternate source of production materials is a function of availability and price. For commodities that are recycled, rising prices tend to bring additional scrap to the marketplace.
Conclusion
One of the significant environmental challenges potentially facing us in the future is the anticipated growth of demand for resources. The building and construction industry continues to be subjected to a variety of demand drivers. From purely cost to functional requirements and from rapid changes in consumer preference to inter-material competition, designers and contractors must be familiar with alternative materials as well as established materials and their wide range of performance. As the cost of materials has risen, such basic construction materials as cement, crushed stone, sand and gravel, and steel have nevertheless remained popular. Suppliers of these materials continue to develop new applications, such as the use of steel in bridge pilings and framing studs in homes.
Any modifications, regulations, or consumer requirements connected with automobiles can cause major shifts in demand for various materials. Although aluminum, iron and steel, and lead compose the largest portion of materials used in automobiles, demand for other materials is growing based on alternate fuels, yet-to-be-discovered technological modifications, or new environmental regulations.
Likewise, the U.S. Government has supported environmental accountability by legislating regulations to insure clean air and water (Clean Water Act, United States) and the elimination of various toxic materials from the environment. Several examples of changes in material demand as a result of legislation include: the rise in consumption of PGM, which are incorporated in automobile catalytic converters; the reduction of mercury in many applications; and the removal of lead from paint and gasoline.
Consumer choices have also driven demand, sometimes in unpredictable directions. The “downsizing” of automobiles to satisfy CAFE laws led not only to sweeping modifications in automobile design, but also to changes in the materials being used to construct the average automobile. In the last several years, however, consumers decided ‘bigger was better’ as SUVs, trucks and vans dominated automobile sales. Currently, because of rising gasoline prices, the American public is pursuing hybrid automobiles. Another industry that has been part of soaring consumer demand is the electronics sector, where strong demand has affected obscure materials, such as indium.
Recycling cannot meet all of society’s demands, even if all metals could be recycled indefinitely. Recycling however helps to reduce the demand for virgin materials. If market forces are not sufficient to stimulate recycling, then government regulations, such as taxes, often do. By supplementing the quantity of a commodity available to the market, recycling conserves virgin material and prevents the associated environmental impacts associated with extraction.
The world of materials has experienced numerous shifts as influenced by demanding consumer markets and changing consumer preferences. These forces have created new products and modified existing ones while increasing or maintaining performance levels.
Notes Further Reading
- Aluminum Association, Inc., The, 2001. Aluminum—The corrosion resistant automotive material: Washington, D.C., The Aluminum Association, Inc., 24 p. (Demand for minerals in the United States)
- Battery Council International, 2005. [http://www.batterycouncil.org/states.html Summary of U.S. State lead-acid battery laws.
- Brooks, W.E., 2006. Mercury, in Metals and minerals: U.S. Geological Survey Minerals Yearbook 2004, v. I, p. 49.1–49.8.
- Bureau of Economic Analysis, 2002. GDP and other major NIPA series, 1929–2001: Washington, D.C., Bureau of Economic Analysis, 25 p.
- DiFrancesco, C.A., and George, M.W., 2004. Indium statistics, in Kelly, T.D., and Matos, G.R., eds., Historical statistics for mineral and material commodities in the United States (ver. 1.0): U.S. Geological Survey Open-File Report 01–006, 5 p.
- DiFrancesco, C.A., and Smith, G.R., 2002. Lead statistics, in Kelly, T.D., and Matos, G.R., eds., Historical statistics for mineral and material commodities in the United States (ver. 1.0): U.S. Geological Survey Open-File Report 01–006, 5 p.
- DiFrancesco, C.A., and Tepordei, V.V., 2004. Stone (crushed) statistics, in Kelly, T.D., and Matos, G.R., eds., Historical statistics for mineral and material commodities in the United States (ver. 1.0): U.S. Geological Survey Open-File Report 01–006, 3 p.
- George, M.W., 2005. Indium: U.S. Geological Survey Mineral Commodity Summaries 2005, p. 80–81.
- Hall, L.E., 2004. What is a hybrid?
- Indium Advocate News, 2004. General outlook for 2004. no. 17, July-September.
- Johnson Matthey plc, 2006. Palladium supply and demand.
- Johnston, L.D., and Williamson, S.H., 2003. What was the GDP then?
- Jorgenson, J.D., 2004. Indium, in Metals and minerals: U.S. Geological Survey Minerals Yearbook 2002, v. I, p. 37.1–37.6.
- Kelly, T.D., and Fenton, M.D., 2004. Iron and steel statistics, in Kelly, T.D., and Matos, G.R., eds., Historical statistics for mineral and material commodities in the United States (ver. 1.0): U.S. Geological Survey Open-File Report 01–006, 11 p.
- Kelly, T.D., and Hilliard, H.E., 2004. Platinum-group statistics, in Kelly, T.D., and Matos, G.R., eds., Historical statistics for mineral and material commodities in the United States (ver. 1.0): U.S. Geological Survey Open-File Report 01–006, 5 p.
- Kelly, T.D., and Matos, G.R., eds., 2004. Historical statistics for mineral and material commodities in the United States (ver. 1.0), U.S. Geological Survey Open-File Report 01–006.
- Miller, K.L., 2004. When will the hot steel markets cool off?: Resource Recycling, v. 23, no. 12, December, 48 p.
- Miller, R.L., 1998. Economics today—The micro view: Reading, MA, Addison-Wesley Publishing Company, Inc., 791 p.
- Motavalli, Jim, 2004. Fuel fossils—Fuel economy regulations.
- National Association of Home Builders, 2003. A century of progress—America’s housing 1900–2000: Washington, D.C., National Association of Home Builders, p. 8.
- National Association of Home Builders, 2004. Housing facts, figures and trends 2004: Washington, D.C., National Association of Home Builders, 49 p.
- National Highway Traffic Safety Administration, 2004. CAFE overview—Frequently asked questions.
- National Transportation Library, 2005a. New passenger car fleet average characteristics.
- National Transportation Library, 2005b. Historical passenger car fleet average characteristics.
- Porter, K.E., and Bolen, W.P., 2004. Sand and gravel (construction) statistics, in Kelly, T.D., and Matos, G.R., eds., Historical statistics for mineral and material commodities in the United States (ver. 1.0): U.S. Geological Survey Open-File Report 01–006, 4 p.
- Porter, K.E., and Brooks, W.E., 2004. Mercury statistics, in Kelly, T.D., and Matos, G.R., eds., Historical statistics formineral and material commodities in the United States (ver. 1.0): U.S. Geological Survey Open-File Report 01–006, 5 p.
- Public Roads, 2000. Highways and bridges on the brink of the new century: Public Roads, v. 64, no. 1, July/August, p. 6.
- Reese, R.G., 2002. Mercury, in Metals and minerals: U.S. Geological Survey Minerals Yearbook 2000, v. I, p. 51.1–51.4.
- Smith, G.R., 2004. Lead, in Metals and minerals: U.S. Geological Survey Minerals Yearbook 2002, v. I, p. 44.1–44.21.
- Steel Bridges, 2003. Steel piles support the new Woodrow Wilson Bridge: Steel Bridges, winter, 4 p.
- U.S. Bureau of Mines, 1980. Mineral facts and problems: U.S. Bureau of Mines Bulletin 671, 1,060 p.
- U.S. Bureau of Transportation Statistics, 2004a. National transportation statistics 2003—Table A—Social and economic characteristics of the United States
- U.S. Bureau of Transportation Statistics, 2004b, Nationaltransportation statistics 2003—Table 1–11—Number of
- U.S. aircraft, vehicles, vessels, and other conveyances.
- U.S. Bureau of Transportation Statistics, 2004c. National transportation statistics 2003—Table 1–37—U.S. passenger-miles.
- U.S. Census Bureau, 2001. Time series of national population estimates—April 1, 2000 to July 1, 2001.
- U.S. Environmental Protection Agency, 1994. Your car and clean air—What you can do to reduce pollution: U.S. Environmental Protection Agency Fact Sheet OMS–18, 3 p.
- U.S. Environmental Protection Agency, 2004a. Clean Air Act.
- U.S. Environmental Protection Agency, 2004b. Lead in paint, dust, and soil.U.S. Federal Highway Administration, 2004. FY 2003 performance and accountability report
- U.S. Geological Survey, 2004. Recycling—Metals, in Metals and minerals: U.S. Geological Survey Minerals Yearbook 2002, v. I, p. 62.1–62.19.
- van Oss, H.G., and Kelly, T.D., 2004. Cement statistics, in Kelly, T.D., and Matos, G.R., eds., Historical statistics for mineral and material commodities in the United States (ver. 1.0): U.S. Geological Survey Open-File Report 01–006, 3 p.
- Wagner, L.A., Sullivan, D.E., and Sznopek, J.L., 2003. Economic drivers of mineral supply: U.S. Geological Survey Open-File Report 02–335, 287 p.
- White, G.L., 2002. Mismanaged palladium stockpile was catalyst for Ford’s write-off: The Wall Street Journal, February 6, p.1.
- Wilburn, D.R., and Bleiwas, D.I., 2005. Platinum-group metals—World supply and demand: U.S. Geological Survey Open-File Report 2004–1224, 152 p.
Citation
Survey, U. (2011). Demand for minerals in the United States. Retrieved from http://editors.eol.org/eoearth/wiki/Demand_for_minerals_in_the_United_States
| ' Disclaimer: the U.S. Geological Survey is original source for some content in Encyclopedia of Earth. listed as a on each article that uses such content. Topic editors and authors Earth have edited this added new information to page. use from should not be construed support or endorsement by organization any personnel, editing |
- ↑ Adapted from Miller, 1998, p. 609–610.
- ↑ Adapted from White, 2002.
- ↑ Materials consumption includes agricultural materials, industrial minerals, organics, primary and recycled paper, primary and secondary metals, sand and gravel, stone, and wood.
- ↑ Apparent consumption is defined as follows: apparent consumption = production + imports - exports ± stock change.
- ↑ Adapted from Hall, 2004.