Arctic atmosphere
This is Section 2.2 of the Arctic Climate Impact Assessment Lead Author: Gordon McBean. Contributing Authors: Genrikh Alekseev, Deliang Chen, Eirik Førland, John Fyfe, Pavel Y. Groisman, Roger King, Humfrey Melling, Russell Vose, Paul H.Whitfield
The arctic atmosphere is highly influenced by the overall hemispheric circulation, and should be regarded in this general context. This section examines Northern Hemisphere circulation using the National Centers for Environmental Prediction/National Center for Atmospheric Research reanalyses for the period from 1952 to 2003[1]. Section 2.2.1 describes the main climatological features, while section 2.2.2 discusses the two major modes of variability: the Arctic Oscillation (AO) (and its counterpart, the North Atlantic Oscillation) and the Pacific Decadal Oscillation. Because much of the observed change in the Arctic appears to be related to patterns of atmospheric circulation, it is important that these modes of atmospheric variability be described.
Note: In this chapter, when describing changes in arctic climate, the words possible, probable, and very probable are used to indicate the level of confidence the authors have that the change really did occur, recognizing the limitations of the observing system and paleoclimatic reconstructions of arctic climate.
Contents
Climatology (2.2.1)
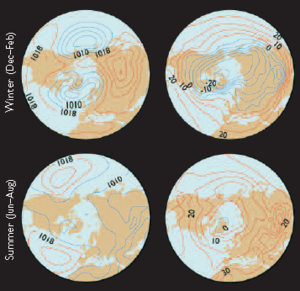
Atmospheric circulation and weather are closely linked to surface pressure. Figure 2.1a shows the Northern Hemisphere seasonal mean patterns of sea-level pressure in winter and summer.The primary features of sea-level pressure in winter include the oceanic Aleutian and Icelandic Lows, and the continental Siberian High with its extension into the Arctic (the Beaufort High).The sea-level pressure distribution in summer is dominated by subtropical highs in the eastern Pacific and Atlantic Oceans, with relatively weak gradients in polar and subpolar regions.The seasonal cycle of sea-level pressure over the mid-latitude oceans exhibits a summer maximum and winter minimum. By contrast, the seasonal cycle of sea-level pressure over the Arctic and subarctic exhibits a maximum in late spring, a minimum in winter, and a weak secondary maximum in late autumn. The climatological patterns and seasonal cycle of sealevel pressure are largely determined by the regular passage of migratory cyclones and anticyclones, which are associated with storminess and settled periods, respectively. Areas of significant winter cyclonic activity (storm tracks) are found in the North Pacific and North Atlantic.These disturbances carry heat, momentum, and moisture into the Arctic, and have a significant influence on high-latitude climate.
The Arctic is affected by extremes of solar radiation. The amount of solar radiation received in summer is relatively high due to long periods of daylight, but its absorption is kept low by the high albedo of snow and ice. The amount of solar radiation received in winter is low to non-existent. Figure 2.1b shows the seasonal mean patterns of surface air temperature. The Arctic is obviously a very cold region of the Northern Hemisphere, especially in winter when the seasonal mean temperature falls well below -20 ºC. Temperature inversions, when warm air overlies a cold surface, are common in the Arctic. At night, especially on calm and clear nights, the ground cools more rapidly than the adjacent air because the ground is a much better emitter of infrared radiation than the air.The arctic winter is dominated by temperature inversions, due to the long nights and extensive infrared radiation losses. Arctic summers have fewer and weaker temperature inversions. On the hemispheric scale, there exist large north–south gradients of atmospheric temperature (and moisture). In winter, the continental landmasses are generally colder than the adjacent oceanic waters, owing to the influence of warm surface currents on the western boundaries of the Atlantic and Pacific Oceans.
Variability modes (2.2.2)
Arctic/North Atlantic Oscillation (2.2.2.1)
The North Atlantic Oscillation (NAO) has long been recognized as a major mode of atmospheric variability over the extratropical ocean between North America and Europe.The NAO describes co-variability in sea level pressure between the Icelandic Low and the Azores High.When both are strong (higher than normal pressure in the Azores High and lower than normal pressure in the Icelandic Low), the NAO index is positive.When both are weak, the index is negative.The NAO is hence also a measure of the meridional gradient in sea-level pressure over the North Atlantic, and the strength of the westerlies in the intervening mid-latitudes.The NAO is most obvious during winter but can be identified at any time of the year. As the 20th century drew to a close, a series of papers were published[3] arguing that the NAO should be considered as a regional manifestation of a more basic annular mode of sea-level pressure variability, which has come to be known as the Arctic Oscillation (AO).The AO is defined as the leading mode of variability from a linear principal component analysis of Northern Hemisphere sea-level pressure. It emerges as a robust pattern dominating both the intra-seasonal (e.g., month-to-month) and interannual variability in sea-level pressure.
Whether or not the AO is in fact a more fundamental mode than the NAO is a matter of debate. For example, Deser[4] concluded that the correlation between the Pacific and Azores high-pressure areas was not significant, and that the AO cannot therefore be viewed as reflecting such a teleconnection. Ambaum et al.[5] found that even the correlation between the Pacific and Icelandic– Arctic low-pressure centers was not significant. They argue that the AO is mainly a reflection of similar behavior in the Pacific and Atlantic basins. Regardless, the AO and NAO time series are very highly correlated, and for most applications (including this assessment), either paradigm can be used. Before proceeding with a description of the AO/NAO, two cautionary points must be mentioned. First, while the AO/NAO is obviously dominant, it explains only a fraction (i.e., 20 to 30%) of the total variability in sea-level pressure. Second, because the AO/NAO index is derived from a linear statistical tool, it cannot describe more general nonlinear variability. Monahan et al.[6] have shown that hemispheric variability is significantly nonlinear, and the AO provides only the optimal linear approximation of this variability.
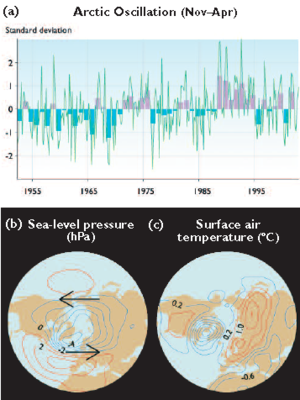
Figure 2.2a shows the AO/NAO time series obtained using monthly mean sea-level pressure for all months in the “extended winter” (November to April).There is considerable month-to-month and year-to-year variability, as well as variability on longer timescales.The AO/NAO index was at its most negative in the 1960s. From about 1970 to the early 1990s, there was a general increasing trend, and the AO index was more positive than negative throughout the 1990s.The physical origins of these longterm changes are the subject of considerable debate. Fyfe et al.[8] and Shindell et al.[9] have shown that positive AO trends can be obtained from global climate models using scenarios of increasing radiative forcing due to rising GHG concentrations. Rodwell et al.[10] and Hoerling et al.[11] have shown similar positive trends using global climate models run with fixed radiative forcing and observed annually varying sea surface temperatures. Rodwell et al.[12] argued that slowly varying sea surface temperatures in the North Atlantic are locally communicated to the atmosphere through evaporation, precipitation, and atmospheric heating processes. On the other hand, Hoerling et al.[13] suggested that changes in tropical sea surface temperatures, especially in the Indian and Pacific Oceans, may be more important than changes in sea surface temperatures in the North Atlantic.They postulated that changes in the tropical ocean alter the pattern and magnitude of tropical rainfall and atmospheric heating, which in turn produce positive AO/NAO trends. Regardless of the causes, it must be noted that AO/NAO trends do not necessarily reflect a change in the variability mode itself. As demonstrated by Fyfe[14] , the AO/NAO trends are a reflection of a more general change in the background, or “mean”, state with respect to which the modes are defined.
Figure 2.2b shows the sea-level pressure anomaly pattern associated with the AO/NAO time series, as derived from a principal components analysis.The pattern shows negative anomalies over the polar and subpolar latitudes, and positive anomalies over the midlatitudes. The anomaly center in the North Atlantic, while strongest in the vicinity of the Icelandic Low, extends with strength well into the Arctic Basin. Not surprisingly, these anomalies are directly related to fluctuations in cyclone frequency. Serreze et al.[15] noted a strong poleward shift in cyclone activity during the positive phase of the AO/NAO, and an equatorward shift during the negative phase. In the region corresponding to the climatological center of the Icelandic Low, cyclone events are more than twice as common during the positive AO/NAO extremes than during negative extremes. Systems found in this region during the positive phase are also significantly deeper than are their negative AO/NAO counterparts. McCabe et al.[16] noted a general poleward shift in Northern Hemisphere cyclone activity starting around 1989, coincident with the positive trend in the AO/NAO time series. Figure 2.2c shows the pattern of surface air temperature anomalies associated with the AO/NAO time series. Negative surface air temperature anomalies centered in Davis Strait are consistent with southeasterly advection of cold arctic air by the AO/NAO-related winds. Easterly advection of warmer air, also linked to AO/NAO-related winds, accounts for the pattern of positive anomalies in surface air temperature over Eurasia.
Pacific Decadal Oscillation (2.2.2.2)
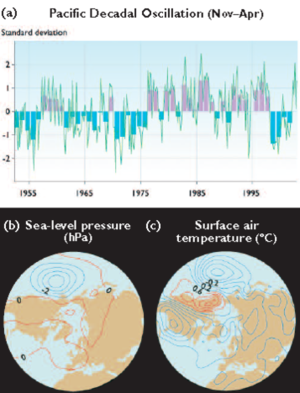
The Pacific Decadal Oscillation (PDO) is a major mode of North Pacific climate variability.The PDO is obtained as the leading mode of North Pacific monthly surface temperature. Figure 2.3a shows the PDO time series obtained using monthly mean surface air temperature for all months in the extended winter (November to April). As with the AO/NAO time series, the PDO time series displays considerable month-to-month and year-to-year variability, as well as variability on longer timescales. The PDO was in a negative (cool) phase from 1947 to 1976, while a positive (warm) phase prevailed from 1977 to the mid-1990s[18]. Major changes in northeast Pacific marine ecosystems have been correlated with these PDO phase changes. As with the AO/NAO, the physical origins of these long-term changes are currently unknown.
Figures 2.3b and 2.3c show the sea-level pressure and surface air temperature anomalies associated with the PDO time series, as derived from a principal components analysis.The sea-level pressure anomaly pattern is wave-like, with low sea-level pressure anomalies over the North Pacific and high sea-level pressure anomalies over western North America. At the same time, the surface air temperatures tend to be anomalously cool in the central North Pacific and anomalously warm along the west coast of North America.The PDO circulation anomalies extend well into the troposphere in a form similar to the Pacific North America pattern (another mode of atmospheric variability).
Chapter 2: Arctic Climate - Past and Present
2.1 Introduction (Arctic atmosphere)
2.2 Arctic atmosphere
2.3 Marine Arctic
2.4 Terrestrial Water Balance in the Arctic
2.5 Influence of the Arctic on global climate
2.6 Arctic climate variability in the twentieth century
2.7 Arctic climate variability prior to 100 years BP
2.8 Summary and key findings of ACIA on Arctic Climate - Past and Present
References
Citation
Committee, I. (2012). Arctic atmosphere. Retrieved from http://editors.eol.org/eoearth/wiki/Arctic_atmosphere- ↑ Updated from Kalnay, E.M., M. Kanamitsu, R. Kistler,W. Collins, D. Deaven, L. Gandin, M. Iredell, S. Saha, G.White, J.Woollen,Y. Zhu, A. Leetmaa, B. Reynolds, M. Chelliah,W. Ebisuzaki,W. Higgins, J. Janowiak, K.C. Mo, C. Ropelewski, J.Wang, R. Jenne and D. Joseph, 1996.The NCEP/NCAR Reanalysis Project. Bulletin of the American Meteorological Society, 77:437–471.
- ↑ Ibid.
- ↑ e.g.,Thompson, D.W.J., J.M.Wallace and G.C. Hegerl, 2000. Annular modes in the extratropical circulation. Part II:Trends. Journal of Climate, 13:1018–1036.
- ↑ Deser, C., 2000. On the teleconnectivity of the ‘Arctic Oscillation’. Geophysical Research Letters, 27:779–782.
- ↑ Ambaum, M.H., B.J. Hoskins and D.B. Stephenson, 2001. Arctic Oscillation or North Atlantic Oscillation? Journal of Climate, 14:3495–3507.
- ↑ Monahan, A.H., J.C. Fyfe, and L. Pandolfo, 2003.The vertical structure of wintertime climate regimes of the northern hemisphere extratropical atmosphere. Journal of Climate, 16:2005–2021.
- ↑ Updated from Kalnay, E.M., M. Kanamitsu, R. Kistler,W. Collins, D. Deaven, L. Gandin, M. Iredell, S. Saha, G.White, J.Woollen,Y. Zhu, A. Leetmaa, B. Reynolds, M. Chelliah,W. Ebisuzaki,W. Higgins, J. Janowiak, K.C. Mo, C. Ropelewski, J.Wang, R. Jenne and D. Joseph, 1996.The NCEP/NCAR Reanalysis Project. Bulletin of the American Meteorological Society, 77:437–471.
- ↑ Fyfe, J.C., G.J. Boer and G.M. Flato, 1999.The Arctic and Antarctic oscillations and their projected changes under global warming. Geophysical Research Letters, 26:1601–1604.
- ↑ Shindell, D.T., R.L. Miller, G.A. Schmidt and L. Pandolfo, 1999. Simulation of recent northern winter climate trends by greenhouse-gas forcing. Nature, 399:452–455.
- ↑ Rodwell, M.J., D.P. Rowell and C.K. Folland, 1999. Oceanic forcing of the wintertime North Atlantic Oscillation and European climate. Nature, 398:320–323.
- ↑ Hoerling, M.P., J.W. Hurrell and T. Xu, 2001.Tropical origins for recent North Atlantic climate change. Science, 292:90–92.
- ↑ Rodwell, et. al, 1999, Op. cit.
- ↑ Hoerling,et. al. 2001, Op. cit.
- ↑ Fyfe, J.C., 2003. Separating extratropical zonal wind variability and mean change. Journal of Climate, 16:863–874.
- ↑ Serreze, M.C., F. Carse, R.G. Barry and J.C. Rogers, 1997. Icelandic Low cyclone activity: climatological features, linkages with the NAO, and relationships with recent changes in the northern hemisphere circulation. Journal of Climate, 10:453–464.
- ↑ McCabe, G.J., M.P. Clark and M.C. Serreze, 2001.Trends in Northern Hemisphere surface cyclone frequency and intensity. Journal of Climate, 14:2763–2768.
- ↑ Updated from Kalnay et. al., 1996, Op. cit.
- ↑ Mantua, N.J., S.R. Hare,Y. Zhang, J.M.Wallace and R.C. Francis, 1997. A Pacific decadal climate oscillation with impacts on salmon. Bulletin of the American Meteorological Society, 78:1069–1079.Minobe, S., 1997. A 50–70 year climatic oscillation over the North Pacific and North America. Geophysical Research Letters, 24:683–686.