State of the Arctic Report
Contents
- 1 Executive summary
- 2 Introduction Figure 4: Observed increases in drought-related conditions in the boreal forests may have contributed to the increase in major wildfires over large parts of northern Alaska during the last two summers. (Source: Photo by Mike McMillan, Spotfire Images.) The permanent presence of sea ice (State of the Arctic Report) , ice sheets, and continuous permafrost are unique features of the polar regions. The Arctic is further distinguished because it sustains a human population in a harsh environment. These characteristics amplify the impact of global climate change on both the regional physical and societal systems. These impacts reach beyond the Arctic region. For instance, studies are underway to determine the extent to which the loss of sea ice cover and the conversion of tundra to larger shrubs and wetlands, observed to have occurred over the last two decades, have impacted multi-year persistence in the surface temperature fields, especially in the Pacific sector.
- 3 Atmosphere
- 4 Ocean
- 5 Sea ice cover
- 6 Land
- 7 Summary
- 8 Further reading
Executive summary
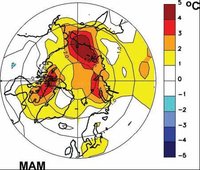 Figure 1: The Arctic system generally shows signs of continued warming, as illustrated in this northern hemisphere map of springtime (March–April–May, or MAM) surface air temperature anomalies for 2000–2005 that differ from earlier temperature patterns in the 20th century. Yellow and red indicate temperatures at least 1?C above average relative to a 1968–1996 base period. (Source: NOAA/OAR/PMEL)
 This State of the Arctic Report presents a review of recent data by an international group of scientists who developed a consensus on the information content and reliability. The report highlights data primarily from 2000 to 2005 with a first look at winter 2006, providing an update to some of the records of physical processes discussed in the Arctic Climate Impact Assessment (Arctic Climate Impact Assessment (ACIA)) (ACIA, 2004, 2005). Of particular note:
- Atmospheric climate patterns are shifting (Fig. 1). The late winter/spring pattern for 2000–2005 had new hot spots in northeast Canada and the East Siberian Sea relative to 1980–1999. Late winter 2006, however, shows a return to earlier climate patterns, with warm temperatures in the extended region near Svalbard.
- Ocean salinity and temperature profiles at the North Pole and in the Beaufort Sea, which changed abruptly in the 1990s, show that conditions since 2000 have relaxed toward the pre-1990 climatology, although 2001–2004 has seen an increase in northward ocean heat transport through Bering Strait (Fig. 2), which is thought to impact sea ice loss.
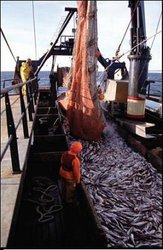 Figure 2: Loss of sea ice and warmer ocean temperatures, highlighted in this report, have favored the pollock fishery in Alaskan waters. (Bryan & Cherry Alexander Photography.)
 - Sea ice extent continues to decrease. The sea ice extent in September 2005 was the minimum observed in summer during the satellite era (beginning in 1979), marking an unprecedented series of extreme ice extent minima beginning in 2002 (Fig. 3). The sea ice extent in March 2006 was also the minimum observed in winter during the satellite era.
- Tundra vegetation greenness increased, primarily due to an increase in the abundance of shrubs. Boreal forest vegetation greenness decreased, possibly due to drought conditions (Fig. 4).
- There is increasing interest in the stability of the Greenland ice sheet. The velocity of outlet glaciers increased in 2005 relative to 2000 and 1995, but uncertainty remains with regard to the total mass balance.
- Permafrost temperatures continue to increase. However, data on changes in the active layer thickness (the relatively thin layer of ground between the surface and permafrost that undergoes seasonal freezing and thawing) are less conclusive. While some of the sites show a barely noticeable increasing trend in the thickness of the active layer, most of them do not.
- Globally, 2005 was the warmest year in the instrumental record (beginning in 1880), with the Arctic providing a large contribution toward this increase.
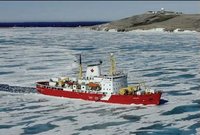 Figure 3: The report describes a continued reduction in the extent of summer sea ice cover which has recently benefited ship-based operations in this region. (Source: Photo courtesy of Jeremy Harbeck.)
 Many of the trends documented in the ACIA are continuing, but some are not. Taken collectively, the observations presented in this report indicate that during 2000–2005 the Arctic system showed signs of continued warming. However, there are a few indications that certain elements may be recovering and returning to recent climatological norms (for example, the central Arctic Ocean and some wind patterns). These mixed tendencies further illustrate the sensitivity and complexity of the Arctic physical system. They underline the importance of maintaining and expanding efforts to observe and better understand this important component of the climate system to provide accurate predictions of its future state.
This State of the Arctic Report presents a review of recent data by an international group of scientists who developed a consensus on the information content and reliability. It provides observations indicating continuing trends in the current state of physical components of the Arctic system, including the atmosphere, ocean, sea ice cover, and land. The report highlights data primarily from 2000 to 2005 with a first look at winter 2006, providing an update to some of the data records of physical processes discussed in the Arctic Climate Impact Assessment (Arctic Climate Impact Assessment (ACIA)). The temporal extent of the data provides a multi-decadal perspective and confirms the sensitivity of the Arctic to changes in the global climate system.
Atmosphere
Circulation regime
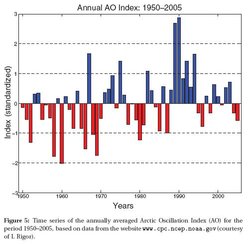 Figure 5: Time series of the annually averaged Arctic Oscillation Index (AO) for the period 1950–2005, based on data from the website www.cpc.ncep.noaa.gov (courtesy of I. Rigor).
 Since its introduction by Thompson and Wallace (1998), the Arctic Oscillation (AO) index has become a popular means of delineating between the two dominant atmospheric circulation regimes in the Arctic region. Identification of the current circulation regime and prediction of the future 4 Richter-Menge et al.—State of the Arctic Report regime are important because each regime is characterized by a set of environmental parameters that impact human activity in the Arctic. Atmospheric, sea ice, and oceanic observational data, along with the results of numerical coupled ice-ocean models, provide evidence that during anticyclonic (negative AO) circulation regimes, the Arctic atmospheric pressure is higher, wind speed is lower, winter temperatures are lower, ocean waters are fresher, sea ice areal coverage is greater, and sea ice is thicker than during cyclonic (positive AO) regimes. When the cyclonic circulation regime dominates, the transport of sea ice from the Arctic Ocean increases, and summer wind divergence produces more openings in the sea ice, allowing the upper ocean to accumulate heat. In addition, under a cyclonic circulation regime, advection of heat with air masses to the Arctic also increases. This positive heat anomaly extends the sea ice melt season, increases ocean freshwater content, and leads to a generally thinner sea ice cover.
The annually averaged AO index in 2005 was slightly negative, continuing the trend of a relatively low and fluctuating index that began in the mid-1990s (Fig. 5). This follows a strong positive pattern from 1989 to 1995. The current characteristics of the AO are more consistent with the characteristics of the period from the 1950s to the 1980s, when the AO switched frequently between positive and negative phases.
Surface temperatures
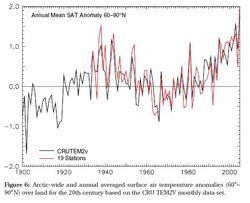 Figure 6: Arctic-wide and annual averaged surface air temperature anomalies (60?–90?N) over land for the 20th century based on the CRU TEM2V monthly data set. (Source: NOAA)
 Annual surface temperatures over land areas north of 60?N continue to remain above the mean value for the twentieth century (Fig. 6), a feature observed since the early 1990s. Figure 6 also shows that there were warmtemperatures in the 1930s and early 1940s, possibly suggesting a longer-term oscillation in climate. However, a detailed analysis shows that the proximate causes and characteristics for the 1930s maxima were different than for the 1990s maxima. The earlier warm anomalies appear to be associated with intrinsic variability that had large region-to-region differences and was limited to high latitudes. The warm anomalies since the 1990s tend to be Arctic-wide and reach into the mid-latitudes.
The near-surface air temperatures in winter and spring 2005 (Fig. 7a) continued to have the same general spatial pattern of warm anomalies as in 2000–2004. A major feature is positive (warm) anomalies over the entire Arctic, consistent with the time series in Fig. 6. A second feature is the strong maxima north of eastern Siberia and in northeastern Canada/west Greenland. Anomalies in spring (March–June) for the last 6 years for these coastal areas are near 3–4?C. The ocean north of eastern Siberia is also a main region for loss of sea ice cover over the last decade (discussed later).
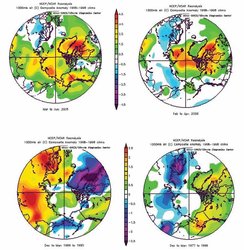 Figure 7: Near surface March–June temperature anomaly composites (at the 1000 mb geopotential height level).
The figure is based on NCEP reanalysis fields via the CDC website. Anomalies are relative to a 1968–1996 base period. (a) Composite for March to June 2005. The pattern for 2005 is similar to the patterns for 2000–2004. Coastal stations in eastern Siberia and west Greenland match the 3–4?C anomaly magnitude from the NCEP reanalysis. (b) Composite for February to April 2006. (c) Composite for winter 1989–1995 when the positive Arctic Oscillation climate pattern was strong. (d) Composite for winter 1977–1988 when the positive Pacific North American pattern was strong. (Source: NOAA 2006)
The highest annual global surface temperature in more than a century of instrumental data (beginning in 1880) was recorded in the 2005 calendar year. The ranking of 2005 as the warmest year is a result mainly of the large positive Arctic temperature anomalies (Fig. 7a). Excluding the region north of 75?N, 1998 (an El Niño year) was warmer than 2005. The pattern of near-surface temperature anomalies for the recent period (2000–2005) is distinctly different from the patterns that characterized the second half of the twentieth century. The patterns observed in the second half of the twentieth century can be associated with two major atmospheric circulation patterns, commonly described by the AO and Pacific North American (PNA) indices. These patterns are illustrated for 1989–1995, when the AO was strongly positive (Figs. 7c), and 1977–1988, when the PNA was strongly positive (Fig. 7d). The strongly positive AO climate pattern during 1989–1995 (Fig. 7c) was associated with temperature anomaly maxima in northern Europe and north-central Asia in winter, expanding to northern Alaska in spring. As part of the positive AO pattern, west Greenland was cold. The positive PNA pattern was dominant from 1977 to 1988, with warm temperature anomalies over northern North America (Fig. 7d). The contrast of 2000–2005 near-surface temperature anomalies (Fig. 7a), with maxima in west Greenland and northeast Siberia, to the temperature patterns associated with the AO and PNA suggest that the recent atmospheric circulation pattern is different from the main patterns of the second half of the twentieth century.
The run of unusual conditions observed for 2000–2005 may be coming to an end. The temperature anomaly pattern in early spring for 2006 shows a return of the dominance of the two twentieth-century climate patterns (Fig. 7b), with a negative AO and La Niña in the Pacific reducing the sea level pressures over both the northern Pacific and Atlantic Oceans. The Svalbard region is particularly warm.
Forcing atmospheric changes
_trends.jpg) Figure 8: Surface air temperature (SAT) trends associated with net atmospheric northward energy transport (ANET) for December through May, 1979–2001. Solid and dotted lines are positive and negative contours, respectively. The contour interval is 0.25?C per decade; the zero line is omitted. These data were computed from regression of the SAT field on the ANET across 60?N using monthly mean data where the annual cycle is removed. (Source: European Centre for Medium-Range Weather Forecasts ERA-40 reanalysis)
Figure 8: Surface air temperature (SAT) trends associated with net atmospheric northward energy transport (ANET) for December through May, 1979–2001. Solid and dotted lines are positive and negative contours, respectively. The contour interval is 0.25?C per decade; the zero line is omitted. These data were computed from regression of the SAT field on the ANET across 60?N using monthly mean data where the annual cycle is removed. (Source: European Centre for Medium-Range Weather Forecasts ERA-40 reanalysis) Past, present, and future states of the Arctic climate will be forced by the combination and interaction of external forcing, climate noise, and internal feedbacks. External forcing consists of direct or indirect (through changes in weather patterns at lower latitudes) influences from greenhouse gases, solar variability, and volcanoes. Large natural atmospheric variability (climatic noise), as represented in part by the AO and PNA, can result in multi-year persistence of Arctic climate patterns. Data from the previous century suggest that the Arctic atmosphere will continue to be influenced to a major extent by these patterns. Changes in sea ice and tundra surface conditions, and changes in heat fluxes to and from the ocean, contribute to internal feedbacks and multi-year memory in the Arctic climate system. For instance, the loss of sea ice in the Beaufort and Chukchi Seas is consistent with positive trends in downward long-wave flux, which appear to be caused by substantial increases in precipitable water, cloud amount, and surface temperature. See Section 4.2 on changes in the surface energy budget.
Of particular interest are atmospheric circulation contributions to the latest warm period, marked by less sea ice and changes in tundra conditions. Arctic cyclone activity (i.e., storms that bring warm, moist air to the Arctic) increased in number and intensity in the second half of the twentieth century, especially in summer, coupled with a general decrease in storminess in the mid-latitudes. During winter and spring these changes were associated with the positive phases of the PNA in the 1980s and the AO in the 1990s. Closer inspection of results in Zhang et al. (2004) show that high-latitude cyclone activity peaked in the early 1990s and has subsequently declined, along with a decrease in the AO, albeit with large variations from year to year. Most recently the summers of 2002 and 2003 saw an unusually large number of cyclones over the central Arctic Ocean. The summers of 2004 and 2005 did not show strong summer cyclone maxima.
Another way to measure the influence of mid-latitude atmospheric circulation is to compute the amount of net atmospheric northward energy transport (ANET) across the 60?N latitude circle. About 25% of the Arctic surface air temperature trend from 1979 to 2001 in winter and spring (Fig. 6) is related to an increase in the ANET (Fig. 8). The strongest linkage is in the Atlantic sector. Both the general trends of an increase in cyclones and an increase in the ANET suggest increased linkages of the Arctic to the mid-latitude atmospheric circulation in recent decades.
Ocean
Circulation
Figure 5 illustrates idealized patterns of the two dominant wind-driven ocean circulation regimes: anticyclonic and cyclonic. Climatological studies (e.g., Proshutinsky and Johnson, 1997) provide a foundation for understanding the significance of these ocean surface conditions. These studies indicate that the Arctic ocean surface layer motion is consistent with the Arctic atmosphere surface layer motion, alternating between cyclonic and anticyclonic circulation regimes. Each regime persists from 4 to 8 years, resulting in a period of 8–16 years. The cyclonic pattern dominated during 1989–1996. Since 1997 the dominant regime has fluctuated, with an anticyclonic pattern being slightly more prevalent (Fig. 5).
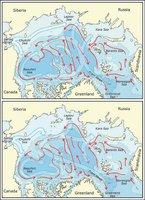 Figure 9:Idealized patterns of the dominant circulation regimes of the Arctic Ocean. Two circulation regimes of surface waters (anticyclonic—top; cyclonic—bottom) are shown in wide blue arrows. In the cyclonic regime the clockwise circulation pattern in the Beaufort Sea region (the Beaufort Gyre) weakens, and the flow across the basin, from the Siberian and Russian coasts to Fram Strait (the Transpolar Drift), shifts poleward. The cyclonic pattern dominated during 1989–1996; the anticyclonic pattern has prevailed since 1997. The Atlantic water circulates cyclonically (red arrows) at approximately 200–800 m deep, independent of the circulation regime of the surface layer. (Source: adapted from Proshutinsky et al., 2005.)
 Data from satellites and drifting buoys indicate that the circulation of the ocean surface layer has been characterized by an anticyclonic regime for the entire 2000–2005 period (Fig. 9, top panel). The anticyclonic regime is the result of a higher sea level atmospheric pressure over the Arctic Ocean, relative to the 1948–2005 mean, and the prevalence of anticyclonic winds.
The circulation of Pacific water (located at depths between 50 and 200 m) in the Arctic Ocean may be coherent with the surface currents, but its pathways are not known from direct observations. Recently our understanding of the vertical structure of this layer and its properties has been revised by Shimada et al. (2001, 2004) and Steele et al. (2004), who reported the presence of two types of summer Pacific halocline water and one type of winter Pacific halocline water in the Arctic Ocean. According to the Environmental Working Group (EWG) analysis, the total thickness of the Pacific layer is approximately 150 m. This thickness is subject to temporal variability, depending on wind stresses and circulation modes. Steele et al. (2004) found similar evidence in their examination of data from the 1980s and 1990s. The most recent studies by Shimada et al (2006) and Maslowski et al. (2006) indicate that the significant reduction of sea ice in the Canadian Basin observed in 2002–2005 (discussed later) may be attributable in part to an increase of heat flux from the Pacific water layer to the bottom of the sea ice, resulting in sea ice melt. Warming of the Pacific water is associated with an increase of heat flux via Bering Strait. In this region, preliminary observations from a mooring site, established and maintained since 1990, suggest that annual mean water temperatures have been about 1?C warmer since 2002, compared to 1990–200. Since 2001, there has also been an increase in the annual mean water transport. Changes in the Pacific water circulation may also influence heat release from the Pacific water to the upper ocean layers.
The Atlantic water circulates in the Arctic Ocean at approximately 200–800 m deep. This water penetrates to the Arctic via Fram Strait and St. Anna Trough (Barents Sea). Under extensive surface cooling, it sinks to intermediate depths and forms the warm Atlantic Layer, with water temperatures greater than 0?C. This layer is covered by low-density surface waters and is thus prevented from undergoing heat exchange with the atmosphere. The most widely accepted circulation scheme of Atlantic water postulates that it circulates counterclockwise, forming several loops in the Arctic basins (Fig. 9, red arrows). The variability of the Atlantic water circulation pattern is not known from observations, but model results show that its circulation has a pulsating character expressed in the propagation of warm and cold events, changing from seasonal to decadal time scales. An increase of the Atlantic water temperature in Fram Strait and the Laptev Sea was observed in 2004.
Heat and freshwater content
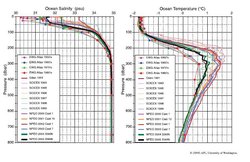 Figure 10: North Pole hydrography for 1991-2005 (lines) compared with EWG climatology (lines with circles); left: salinity, right: temperature. The EWG data (decadal means for 1950s–1980s) and the NPEO data (2001–2005) are for spring, and the SCICEX data (1993–1999) are for autumn. Because of summer ice melt and river runoff, the salinity of the upper ocean layer is always lower in autumn than in spring. Therefore, we expect that in the 1990s the spring water salinity was even greater than observed by SCICEX expeditions in autumn (Source: Morison et al., 2006).
 The heat and freshwater contents of the Arctic Ocean are important integrated parameters and are indicative of the potential role of the Arctic Ocean in the global climate system. For example, the meridional overturning circulation in the Atlantic Ocean, an important component of the global ocean circulation, is significantly influenced by freshwater fluxes from the Arctic Ocean. It is suggested that the Arctic Ocean accumulates fresh water during anticyclonic circulation regimes and releases this water to the North Atlantic during cyclonic circulation regimes. The Beaufort Gyre (illustrated in Fig. 9 by the closed clockwise circulation pattern in the Beaufort Sea region) is the major reservoir of fresh water in the Arctic Ocean, and its dynamics (accumulation or release) is responsible for freshwater fluxes to the Atlantic Ocean. The heat content of the Arctic Ocean is potentially responsible for the sea ice melt and the Arctic atmosphere warm-up. However, under the existing ocean state, the direct upward loss of heat from the Atlantic water layer is greatly impeded by strong density stratification and weak temperature gradients in the upper ocean. The impact of this sensible heat reservoir on Arctic perennial ice is thought to be weak.
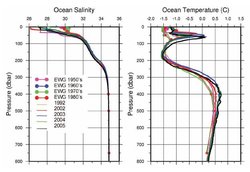 Figure 11: Beaufort Gyre hydrography for 1991–2005 (lines) compared with EWG climatology (lines with circles) for the vicinity of 75?N and 150?W; left: salinity, right: temperature. (Source: NOAA 2006)
 From 2000 to 2005, the most complete observational data available to analyze changes in the freshwater and heat contents of the Arctic Ocean are the intensive investigations conducted in the vicinity of the North Pole by the North Pole Environmental Observatory (NPEO) and in the western Arctic by the Beaufort Gyre Observing System (BGOS) (www.whoi.edu/beaufortgyre/index.html). Hydrographic data acquired in the North Pole region in the 1990s show a strong increase in upper ocean salinity relative to the Environmental Working Group Atlas of the Arctic Ocean climatology (Fig. 10, left panel), where water temperatures and salinities from observations were averaged and gridded for the decades of 1950, 1960, 1970, and 1980. This increase was asso ciated with a more cyclonic Arctic Ocean circulation in the 1990s. Under this condition, the fresh water from river runoff tended to circulate along ocean boundaries (see Fig. 9, bottom panel, wide blue lines), resulting in a decrease of salinity along coastlines and an increase of salinity in the central Arctic (North Pole). The NPEO data also show a large increase in Atlantic water temperature at depth relative to the EWG climatology (Fig. 10, right panel). This was also consistent with the cyclonic circulation regime conditions in the 1990s, when more Atlantic water penetrated to the Arctic Ocean and, correspondingly, there was an increase in Atlantic water temperature. Hydrographic measurements made by the NPEO show that the conditions since 2000 have relaxed toward the pre-1990 climatology, but some changes, at least partially, still persist.
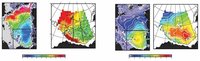 Figure 12: Summer heat (109 J/m2, left) and freshwater (m, right) content. Panels 1 and 3 show the heat and freshwater content in the Arctic Ocean based on 1980s climatology. Panels 2 and 4 show the heat and freshwater content in the Beaufort Gyre in 2000–2005 based on hydrographic surveys (the black dots indicate locations of hydrographic stations). For reference, this region is outlined in black in panels 1 and 3. The heat content is calculated relative to the water temperature freezing point in the upper 1000-m ocean layer. The freshwater content is calculated relative to a reference salinity of 34.8. (Source: NOAA)
 The hydrography of the Beaufort Gyre (the major freshwater reservoir in the Arctic Ocean) has also changed dramatically relative to the 1990s (Fig. 11). The results of several hydrographic surveys in this region in the 1990s, compared to the EWG data, indicate that, in contrast to the salinity increase at the North Pole, the salinity of the upper layer in the Beaufort Gyre was significantly reduced in the 1990s (Fig. 11, left panel). This is a consequence of both sea ice melt during Arctic warming in the 1990s and the addition of fresh water from Siberian rivers. The shift in the pattern of freshwater transport is consistent with the presence of cyclonic winds, which redirect the ocean surface flow of fresh water from the Russian and Siberian coasts along the Siberian Seas to the Beaufort Sea. Under anticyclonic winds, this fresh water flows toward Fram Strait (compare the left and right circulation patterns in Fig. 9, wide blue arrows). In the 2000s, relative to the 1990s, the salinity in the Beaufort Gyre increased but was still approximately 1 unit less than shown by the EWG climatology. There was also a very small salinity decrease in the 50- to 300-m layer of the ocean, but this change was within the range of interannual variability. Interestingly, the total freshwater content in the Beaufort Gyre in the 2000s has not changed dramatically relative to climatology, but there has been a significant change in the freshwater distribution (Fig. 12, panels 3 and 4). The center of the freshwater maximum has shifted toward Canada and intensified significantly relative to climatology.
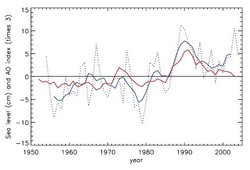 Figure 13: Annual mean relative sea level from nine tide gauge stations in the Siberian seas (dotted line). The blue line is the 5-year running mean sea level. The red line is the 5-year running mean AO index. (Source: NOAA 2006)
 In the 1990s, the water temperature in the Beaufort Gyre increased significantly relative to EWG data (Fig. 11, right panel). As mentioned in Section 3.1, the most pronounced warming (up to 1?C) was observed in the Pacific water layer (50–100 m), but the maximum heat accumulation was observed in the Atlantic waters between 200 and 800 m deep. These waters, propagating cyclonically from Fram Strait (Fig. 9, red arrows), reached the Beaufort Sea in the late 1990s, much later than when they reached the North Pole. The combination of warming water temperatures and a change in the circulation pattern resulted in a significant increase in the heat content in the Beaufort Gyre in the 2000s relative to the EWG climatology and observations made in the beginning of the 1990s (Fig. 12, panels 1 and 2).
Sea level
Figure 13 shows a sea level time series from several coastal stations in the Siberian seas. There is a positive sea level trend along the Arctic coastlines. From 1954 to 1989 the rate of sea level rise was estimated as 0.185 cm/year. Adding 1990–2004 data increases the estimated rate to 0.191 cm/year. The sea level time series correlates relatively well with the AO index (the correlation coefficient is 0.83). Consistent with the influences of AO-driven processes, the sea level dropped significantly after 1990 and increased after the circulation regime changed from cyclonic to anticyclonic in 1997. In contrast, from 2000 to 2004 the sea level rise rate has increased, in spite of a steady decrease in the AO index. At this point, because of the large interannual variability, it is difficult to evaluate the significance of this change.
Sea ice cover
Extent and thickness
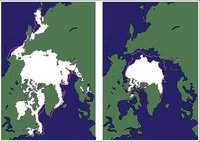 Figure 14: Sea ice extent in March (left) and September (right) 2005, when the ice cover was at or near its maximum and minimum extent, respectively. The magenta line indicates the median maximum and minimum extent of the ice cover for 1979–2000. In both cases, the ice extent reached a record minimum in 2005 for the period 1979–2005. (Source: Adapted from National Snow and Ice Data Center web site)
 During 2005, each month except May showed a recordminimum sea ice extent in the northern hemisphere for the period 1979–2005. The extent of the sea ice cover is typically at or near its maximum in March and its minimum in September. The ice extent in March 2005 was 14.8 million km2. In September 2005 the ice extent was 5.6 million km2. In comparison, the mean ice extent for March and September, for the period 1979–2005, was 15.7 million km2 and 6.9 million km2, respectively (Fig. 14). It is notable that in March 2005 the ice extent fell within the median contour at almost every location. In September 2005, the retreat of the ice cover was particularly pronounced along the Eurasian and North American coastlines. Recent data from winter 2006 indicate a further reduction in the maximum ice extent, reaching 14.5 million km2 in March.
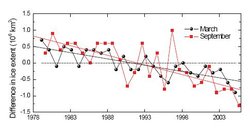 Figure 15: Time series of the difference in ice extent in March (maximum) and September (minimum) from the mean values for 1979–2005. Based on a least-squares linear regression, the rates of decrease in March and September were 2% per decade and 7% per decade, respectively. Recent data from March 2006 are also shown and represent a new record minimum for the period of observation. (Source: NOAA 2006)
 To put the 2005 minimum and maximum ice extents into context, the time series of the variability of ice extent in March and September for 1979–2005 are presented in Fig. 15. In both cases, a negative trend is apparent, with a rate of 2% per decade for March and 7% per decade for September. The summers of 2002–2005 marked an unprecedented series of extreme ice extent minima.
The state of the sea ice cover is intrinsically linked to the state of the ocean and atmosphere. This is confirmed by the observation that during this same period (1979–2005), the annual surface temperatures over land areas north of 60?N have generally been rising and have been above the mean value for the twentieth century since the early 1990s (Fig. 6).
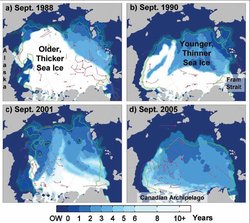 Figure 16: Change in the age of ice on the Arctic Ocean, compared for September and based on results from a simulation using drifting buoy data and satellite-derived ice concentration data. Open water (OW) is shown in dark blue, and the oldest ice is shown in white. The darker green line marks 90% ice concentration, and the lighter green lines mark ice concentrations of 80, 70, 60, and 50%. (Source: Rigor and Wallace, 2004)
 Ice thickness is more difficult to monitor than ice extent. With satellitebased techniques only recently introduced, observations have been spatially and temporally limited. Data from submarinebased observations indicate that at the end of the melt season the permanent ice cover (the ice located toward the center of the Arctic basin that survives year round; see Fig. 14, right panel) thinned by an average of 1.3 m between 1956–1978 and the 1990s, from 3.1 to 1.8 m. On the other hand, measurements of the seasonal ice cover (the ice around the periphery of the Arctic basin that melts during the summer) do not indicate any statistically significant change in thickness in recent decades (Melling et al., 2005; Haas, 2004; Polyakov et al., 2003).
The trends in the extent and thickness of the cover are consistent with observations of a significant loss of older, thicker ice out of the Arctic via Fram Strait in the late 1980s and early 1990s (Fig. 16). This event coincided with the strong, positive AO period that extended from 1989 to 1995 (Fig. 5). When the AO is positive, atmospheric and oceanic conditions favor a thinner ice cover. A younger, thinner ice cover, such as the one left behind from this event, is more susceptible to atmospheric or oceanic warming. It is of great interest to observe whether the sea ice cover will continue its decline or rebound under the recent, more-neutral AO conditions.
Sea ice surface conditions
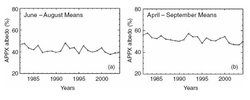 Figure 17: Time series of APP-x surface albedo for areas between 60? and 90?N and with ice concentrations of 15–100%. (a) Means averaged over June-August. (b) Means averaged over April–September. (Source: NOAA)
 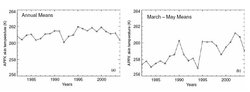 Figure 18:Time series of APP-x skin temperatures for areas between 60? and 90?N and with ice concentrations of 15–100%. (a) Means averaged over 12 months. (b) Means averaged over March–May. (Source: NOAA)
 Data from 1982 to 2004, derived from Advanced Very High Resolution Radiometer (AVHRR) Polar Pathfinder extended (APP-x) products (updated from Wang and Key, 2005a,b), adjusted for a negative bias from 2001 onward, indicate an overall negative trend for summer (June–August) mean albedo of ?0.26%/year (Fig. 17a). The trend increases slightly to ?0.32%/year for April–September (Fig. 17b), suggesting a possible increase in the duration of the melt season. In both cases, the surface albedo is relatively low from 2001 to 2004 and is consistent with observations of an earlier, more spatially extensive onset of melt and decreases in ice concentration. The time series of APP-x annual mean skin temperatures (the temperature at which the surface is radiating) (Fig. 18a) over the same period shows less consistent change over time, with a general increase in annual mean temperatures through the early 1990s and a decrease from 1995 onward. When the time series is limited to spring (March–May), the 23-year linear trend is positive (0.14 K/year), with greater interannual variability (Fig. 18b), indicative of the seasonal dependence of warming trends.
Large regional variability, typical of Arctic conditions, is observed in albedo, skin temperature, and ice concentration. From 1996 to 2004, the largest decreases in surface albedo correspond with a reduction in ice extent in the Beaufort and Chukchi Seas, while lower albedos over the central ice pack appear to be consistent with the lower total ice concentrations over this same period. It remains to be determined how much of the albedo change is due to the presence of more open water vs. more extensive ice-surface melt and ponding. In either case, the changes represent significant modifications of the ice pack.
Land
Vegetation
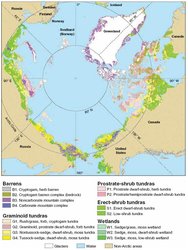 Figure 19:Vegetation of the circumpolar Arctic (Walker et al., 2005). The southern boundary of Arctic vegetation is the treeline. This map gives a good impression of just how closely tied the tundra biome is to the ocean; 61% of lowland tundra is within 50 km of sea ice, 80% is within 100 km, and 100% is within 350 km. (Source: NOAA 2006)
 A key question facing Arctic terrestrial ecologists at the moment is “What will happen to the tundra regions if the Arctic Ocean becomes seasonally ice free as indicated by current trends in sea ice?” There is an intimate connection between Arctic vegetation and the ocean/sea ice because the tundra biome is essentially defined by its close proximity to the Arctic Ocean (Fig. 19). Over 80% of the lowland Arctic tundra is within 100 km of at least seasonally frozen seawaters that provide the cool summer temperatures necessary for tundra’s presence. Changes to the boundary of the summer ice in the Arctic could affect important factors for plant growth, including the temperature of adjacent land surfaces and the length of the thaw season. Changes to the vegetation will have major implications for the permafrost and active layer and soils, snow, hydrology, trace-gas fluxes, wildlife, and people who live in the Arctic. They also have global implications because of albedo feedbacks to the climate system. Summaries of system-wide changes in Arctic terrestrial systems are reported in several references. Before future states of tundra ecosystems can be modeled, it is first necessary to inventory what types of change have already been detected.
The most convincing evidence of widespread change to the vegetation in the Arctic comes from the historic trends of the tundra greenness as detected from satellites. The Normalized Difference Vegetation Index (NDVI) is a measure of vegetation greenness derived from the reflectance of the surface in the red and near-infrared channels. If the climate warms, higher NDVI values might be expected to shift northward. Earlier global studies of NDVI changes indicated a general pattern of increased NDVI in the region between 40?N and 70?N during 1981–1999. Studies of the tundra area of northern Alaska indicate an increase of 17% in NDVI values in this region where the Summer Warmth Index (SWI) measured at ground stations across northern Alaska have been increasing by 0.16–0.34?C/year during the same period. There are no time series of vegetation biomass measurements that can be linked directly to the NDVI record; however, correlations between zonal tundra biomass and temperature suggest an average increase exceeding 150 g/m2 over the last 20 years within the area studied.
Amore recent analysis covering the boreal forest and tundra region of North America indicates that different patterns of greening have occurred in the boreal forest and tundra areas. The NDVI has increased in tundra regions by an average of about 10% for all of North America over the last 20 years, whereas the NDVI has declined in the boreal forest regions, particularly during the past 10 years (Fig. 20). The increase in the tundra NDVI is attributed primarily to changes in the abundance of shrubs, whereas the decline in the forest DVI is possibly due to drought-induced stresses. These conclusions are based on observed changes in shrub cover in parts of Alaska during the past 50+ years and to analyses of tree rings in Alaska. Further support for the important shrubs in the changing tundra come from long-term experimental studies by the International Tundra Experiment, observations of shrub-snow interactions, and experimental studies of tundra response to fertilization. Along with direct tundra and boreal forest changes, forest fires are having an increasing role. The 2004 fire season in Alaska had the largest total timber loss in the 56-year record.
Water and ice
The river discharge database R-ArcticNet was extended up to 2004 for 48 downstream river gages. The river inflow to the ocean was computed using a hydrological analogy approach in combination with linear and multiple correlation. For regions where no analogous site was available, additional meteorological information and water balance simulations were used. The best estimates were obtained for the Asian and European seas, as well as for the Bering Strait and Beaufort Sea, because only relatively small areas there are unmonitored and data are more available.
Table 1 compares discharge to the ocean for 2000–2004 with that for 1980–1999 for different drainage basins. The last 5 years were characterized by an increase of total discharge to the Arctic Ocean, mainly due to a contribution from Asian rivers. The mean 2000–2004 discharge from Asia was 110 km3 (5%) higher than for the previous 20 years. The mean discharge to the ocean from North America and Europe for 2000–2004 was practically unchanged relative to 1980–1999. Adjacent territories such as Bering Strait, Hudson Bay, and Hudson Strait drainage basins had insignificantly higher discharges in 2000–2004 compared with the previous 20 years. A consistent increase in river discharge is observed fromEurasia for a longer time interval as well. Most of the rivers show an increasing trend in annual river discharge over the observational periods. The mean discharge over 2000–2004 for the large Eurasian rivers was 3–9% higher than the discharge over 1936–2004. Thus, the contemporary data further confirm the presence of a significant increasing trend in the freshwater discharge to the Arctic Ocean from Eurasia documented earlier by Peterson et al. (2002) (Fig. 21). The maximum total discharge of the six largest Eurasian rivers over 1936–2004 was observed in 2002, at 2080 km3/year (Fig. 21). There is no clear picture for the North American rivers; they generally have both positive and negative insignificant long-term discharge trends. The discharge of the Yukon and Mackenzie Rivers during the last 5 years was higher than normal, although the estimated total discharge to the ocean from North America has not changed significantly (Table 1). The contribution of glaciers to the freshwater inflow to the Arctic and world oceans has been increasing as a result of climate warming and will affect many aspects of the Arctic climate system. This comes primarily from glaciers in the Canadian, Russian, and Svalbard archipelagos and from individual ice caps around the Greenland Ice Sheet (GRIS). New and more precise measurements show surface thinning along the southwestern and southeastern coasts of Greenland and a substantial increase in surface melting and water concentration on the surface in the ablation zone of GRIS. Large tidewater glaciers have nearly doubled in surface velocity, and basal melting has increased. These observations and an analysis of climate change suggest that GRIS dynamics has responded with no delay to recent climate and mass balance changes, at least along the coast. While there are clear thinning and accelerated outflows near the edges, there is a debate about the mass balance for Greenland as a whole.1 Freshwater inflow from Arctic mountain glaciers, icecaps, and GRIS has been rising over the last several decades. This rise has been especially fast since the end of the 1980s andmid-1990s. It is likely that freshwater inflow to the Arctic Ocean from glaciers will continue to rise as a result of climate warming. Although many small glaciers will disappear, the large glaciers in Canadian, Russian, the Svalbard archipelagos, and the Greenland ice sheet will add to the hydrological cycle as cold glaciers warm and begin producing more runoff. (State of the Arctic Report)
Permafrost
Observations show a general increase in permafrost temperatures during the last several decades in Alaska, northwest Canada, Siberia, and northern Europe. Uninterrupted permafrost temperature records for more than 20 years have been obtained by the University of Alaska Fairbanks along the International Geosphere-Biosphere Programme Alaskan transect, which spans the entire continuous permafrost zone in the Alaskan Arctic. All of the observatories show a substantial warming during the last 20 years. The amount of warming was different at different locations, but it was typically 0.5–2?C at the depth of zero seasonal temperature variations in permafrost (Fig. 22).
These data also indicate that the increase in permafrost temperatures is not monotonic. During the observational period, relative cooling has occurred in the mid-1980s, in the early 1990s, and then again in the early 2000s. As a result, permafrost temperatures at 20 m deep experienced stabilization and even a slight cooling during these periods. An even more significant cooling of permafrost was observed during the very late 1990s and the early 2000s in interior Alaska (not shown). A significant portion of this cooling is related to a shallower-than-normal winter snow cover during this period. During the last three years, there was a sign of recovery in mean annual temperatures at shallow depths. In 2005, soil temperatures in interior Alaska reached the temperatures of the early to mid-1990s, which were the warmest during the last 70 years.
Data on changes in the active layer thickness in the Arctic lowlands are less conclusive. In the North American Arctic, the active layer thickness experiences a large interannual variability, with no discernible trends; this is likely because of the short length of historical data records. A noticeable increase in the active layer thickness was reported for the Mackenzie Valley. However, this positive trend reversed to a negative trend at most of these sites after 1998. An increase in thickness of more than 20 cm between the mid-1950s and 1990, derived from the historical data collected at the Russian meteorological stations, was reported for the continuous permafrost regions of the Russian Arctic. At the same time, reports from several specialized permafrost research sites in central Yakutia showed no significant changes in the active layer thickness. The active layer was especially deep in 2005 in interior Alaska. Around Fairbanks the 2005 active layer depth was the deepest observed in the past 10 years. Data from many of these sites show that the active layer that developed during the summer of 2004 (one of the warmest summers in Fairbanks on record) did not completely freeze during the 2004–2005 winter; a thin layer just above the permafrost table was unfrozen during the entire winter.
The long-termthawing of permafrost starts when the soil layer that was unfrozen during the summer above the permafrost does not refreeze completely, even during the most severe winter. The residual unfrozen layer is termed “talik,” and the process is often being referred to as “talik formation.” The cause of this event could be climate warming and/or an increase in snow accumulation (for any reason) at the ground surface. Changes in the surface hydrology could also trigger long-term permafrost thawing. However, a more common cause of increased thawing has been disturbances of the ground surface above the permafrost, both natural (forest fire, flood) and human-made (agricultural activities, roads and building construction, etc.).
There are a very limited number of localities within the permafrost zone where talik formation has been carefully documented. One of the best examples is the Tanana River Flats near Fairbanks, Alaska, where naturally occurring long-term permafrost thawing was studied and documented by Jorgenson et al. (2001). This study revealed widespread and rapid permafrost thawing that caused a shift in ecosystems from birch forest to fens and bogs. Similar processes were reported by Osterkamp et al. (2000) for the Tok area in Alaska. Deepening of the permafrost table from 3.5 m in 1989 to 5 m in 2004 was reported for some areas at the Gakona Permafrost Observatory in Alaska. There is also evidence that the recent warming has already resulted in permafrost thawing and talik formation at some sites in northern Eurasia. For example, during the 1960s and early 1970s, ground temperatures at 3.2 m at Khoseda-Khard, in the European North of Russia, were at or below 0?C, with some years also showing the 1.6- and 2.4-m levels perennially frozen. Conditions changed drastically during the latter part of the twentieth century (Fig. 23). In the relatively cold year of 1964, 3.2-m ground temperatures were at 0?C year-round, suggesting a phase transition (the 2.4-m level thawed out during fall). In the relatively warm year of 1989, fall temperatures at 3.2 m reached 3.3?C. Thawing of permafrost as a result of forest fires and agricultural activities in Alaska has been reported by Osterkamp and Romanovsky (1999), Romanovsky and Osterkamp (2000), and Yoshikawa et al. (2003).
Summary
The observations highlighted in this report indicate that many of the trends documented in the ACIA report (2004, 2005) continued during 2000–2005 and suggest a sustained period of warming in the Arctic region. Convincing evidence includes the continued reduction in sea ice extent, observed at both the winter maximum and summer minimum, and widespread changes in Arctic vegetation, with the tundra experiencing an increase in greenness and the boreal forest regions showing a decrease in greenness.
There are indications that some components of the physical system may be recovering and returning to the recent climatological norms observed from 1950 to 1980. For instance, the pattern of near-surface temperature anomalies for 2000–2005 has been distinctly different from the patterns that characterized the second half of the twentieth century, exhibiting positive (warm) anomalies over the entire Arctic region. Observations from the early spring of 2006 show a pattern more consistent with the two patterns that dominated the twentieth century, with well-defined regions of warm and cool anomalies. Ocean salinity and temperature profiles taken at the North Pole and the Beaufort Gyre both indicate that since 2000 the dramatic shifts observed in the 1990s have relaxed toward the pre-1990 climatology. On the land, permafrost temperatures continued to rise within most of the permafrost-affected areas but at a noticeably slower rate than in the 1990s. Changes in the active layer thickness (the relatively thin layer of ground between the surface and permafrost that undergoes seasonal freezing and thawing) are inconsistent. While some of the monitored sites show a slightly increasing trend in the thickness of the active layer, most do not.
There also appears to be a destabilization of several known relationships between climate indices and Arctic physical system characteristics. For example, during the period of satellite observations, starting in 1978, a strong correlation between the Arctic Oscillation index and sea ice conditions had been observed. A positive AO, characterized by a cyclonic atmospheric circulation regime, creates conditions that favor a relatively low sea ice extent. This relationship was clearly evident during the strong positive AO pattern that persisted from 1989 to 1995. Since then, the annual averaged AO index has been exhibiting more neutral conditions, which should support a reversal or, at least, a deceleration in the overall rate of reduction in the extent of the ice cover. Instead, 2002–2005 has been characterized by an unprecedented series of extreme ice extent minima.
The observations highlighted in the report and the mixed tendencies they reveal further illustrate the sensitivity and complexity of the Arctic physical environment. They also support recommendations to maintain and expand efforts to establish a coordinated Arctic observation network, consistently documented by diverse, international activities. Long-term monitoring of key parameters, coupled with detailed studies of specific processes, will improve the understanding of this region and enable the development of more accurate models and predictions of its future state. The incentive for supporting and achieving these advancements is high, given the relevance of the physical conditions to other key elements of the Arctic environment and global climate system.
Further reading
- Abdalati, W., W. Krabill, E. Frederick, S. Manizade, C. Martin, J. Sonntag, R. Swift, R. Thomas, W. Wright, and J. Yungel, 2001. Variations in northern vegetation activity inferred from satellite data of vegetation index during 1981 to 1999. J. Geophys. Res., 106 (D24), 33,729–33,742.
- ACIA, 2004. Surface melt-induced acceleration of Greenland ice-sheet flow. Cambridge University Press.
- ACIA, 2005. Arctic Climate Impact Assessment. Cambridge University Press, 1042 pp.
- Barber, V.A., G.P. Juday, and B.P. Finney, 2000. 686c610471cb7a08afcb570ee364413b465665e8a30c34.95238248. Nature, 405, 668–673.
- Belchansky, G.I., D.C. Douglas, and N.G. Platonov, 2004. Duration of the Arctic sea ice melt season: Regional and interannual variability. J. Climate, 17(1), 67–80.
- Beringer, J., F.S. Chapin III, I. McHugh, N.J. Tapper, A.H. Lynch, M.C. Serreze, and A.G. Slater (2001) Impact of Arctic treeline on synoptic climate. Geophys. Res. Lett., 28, 4247–4250.
- Box, J.E., D.H. Bromwich, and Le-Sheng Bai, 2004. Greenland ice sheet mass balance 1991–2000: Application of polar MM5 mesoscale model and in situ data. J. Geophys. Res., 109, D16105, doi: 10.1029/2003JD004451.
- Box, J.E., D.H. Bromwich, B.A. Veenhuis, L.-S. Bai, J.C. Stroeve, J.C. Rogers, K. Steffen, T. Haran, and S.-H. Wang, 2006. Variability of Greenland surface mass balance (1988–2004) using calibrated Polar MM5 output. J. Climate, in press.
- Brown, J., K.M. Hinkel, and F.E. Nelson, 2000. The Circumpolar Active Layer Monitoring (CALM) Program: Research designs and initial results. Polar Geog., 24(3), 165–258.
- Cavalieri, D., C. Parkinson, P. Gloerson, and H.J. Zwally, 1997. Sea ice concentrations from Nimbus-7 SMMR and DMSP SSM/I passive microwave data, June to September 2001. Boulder, Colorado, National Snow and Ice Data Center, digital media, updated 2005.
- Chapin III, F.S., M. Sturm, M.C. Serreze, J.P. McFadden, J.R. Key, A.H. Lloyd, A.D. McGuire, T.S. Rupp, A.H. Lynch, J.P. Schimel, J. Beringer, W.L. Chapman, H.E. Epstein, E.S. Euskirchen, L.D. Hinzman, G. Jia, C.L. Ping, K.D. Tape, C.D.C. Thompson, D.A. Walker, and J.M. Welker, 2005. Role of land-surface changes in arctic summer warming. Science, 310, 657–660.
- Clow, G.D., and F.E. Urban, 2003. GTN-P Monitoring Network: Detection of a 3 K permafrost warming in northern Alaska during the 1990’s. First Study of Environmental Arctic Change (SEARCH) Open Science Meeting, 27–30 October 2003, Seattle, WA.
- Couture, R., S. Smith, S.D. Robinson, M.M. Burgess, and S. Solomon, 2003. On the hazards to infrastructure in the Canadian North associated with thawing of permafrost. Proceedings of Geohazards 2003, 3rd Canadian Conference on Geotechnique and Natural Hazards, Edmonton, Alberta, Canada, The Canadian Geotechnical Society, 97–104.
- DAMOCLES Integrated Project: Developing ArcticModelling and Observing Capabilities for Long-term Environmental Studies, 2005.
- Dyurgerov, M.B., and M.F. Meier, 2005. Glaciers and the changing earth system: A 2004 snapshot. Boulder, Colorado, University of Colorado Institute ofArctic and Alpine Research Occasional Paper 58, 117 pp.
- Environmental Working Group (EWG), Arctic Climatology Project, 1997. Environmental Working Group joint U.S.-Russian atlas of the Arctic Ocean—Winter period. L. Timokhov, and F. Tanis (eds.), Ann Arbor, Michigan, Environmental Research Institute of Michigan, in association with the National Snow and Ice Data Center, CD-ROM.
- Environmental Working Group (EWG), Arctic Climatology Project, 1998. Environmental Working Group joint U.S.-Russian atlas of the Arctic Ocean—Summer period. L. Timokhov, and F. Tanis (eds.), Ann Arbor, Michigan, Environmental Research Institute of Michigan, in association with the National Snow and Ice Data Center, CD-ROM.
- Francis, J.A., E. Hunter, J.R. Key, and X. Wang, 2005. Clues to variability in Arctic minimum ice extent. Geophys. Res. Lett., 32, L21501, doi: 10.1029/ 2005GL024376.
- Frauenfeld, O.W., T. Zhang, R.G. Barry, and D. Gilichinsky, 2004. Interdecadal changes in seasonal freeze and thaw depths in Russia. J. Geophys. Res., 109, D05101, doi: 10.1029/2003JD004245.
- Goetz, S.J., A.G. Bunn, G.J. Friske, and R.A. Houghton, 2005. Satellite-observed photosynthetic trends across boreal North America associated with climate and fire disturbance. Proceedings of the National Academy of Science, 102, 13,521–13,525.
- Griffith, B., D.C. Douglas, N.E. Walsh, D.D. Young, T.R. McCabe, D.E. Russell, R.G. White, R.D. Cameron, and K.R. Whitten, 2002. The Porcupine caribou herd. In Arctic Refuge coastal plain terrestrial wildlife research summaries. D.C. Douglas, P.E. Reynolds, and E.B. Rhode (eds.), U.S. Geological Survey, Biological Resources Division, Biological Science Report USGS/BRD/BSR-2002-0001, 8–37.
- Haas, C., 2004, Late-summer sea ice thickness variability in the Arctic Transpolar Drift 1991–2001 derived from ground-based electromagnetic sounding. Geophys. Res. Lett., 31, L09402, doi: 10.1029/2003GL019394.
- Hansen, J., 2006. Global temperature trends: 2005 summation.
- Harris, C., andW. Haeberli, 2003. Warming permafrost in Europeanmountains. World Meteorol. Org. Bull., 52(3), 6 pp. See also Global Planet. Change, 39, (2003), 215–225.
- Hinzman, L., N. Bettez, W.R. Bolton, F.S. Chapin III, M. Dyurgerov, C. Fastie, B. Griffith, R.D. Hollister, A. Hope, H.P. Huntington, A. Jensen, G.J. Jia, T. Jorgenson, D.L. Kane, D.R. Klein, G. Kofinas, A.H. Lynch, A.H. Lloyd, A.D. McGuire, F. Nelson, W.C. Oechel, T.E. Osterkamp, C. Racine, V.E. Romanovsky, R. Stone, D. Stow,M. Sturm, C.E. Tweedie, G. Vourlitis, M.D. Walker, D.A. Walker, P.J. Webber, J.E. Welker, K. Winker, and K. Yoshikawa, 2005. Evidence and implications of recent climate change in northern Alaska and other Arctic regions. Climatic Change, 72, 251–298.
- Isaksen, K., D. Vonder Mühll, H. Gubler, T. Kohl, and J.L. Sollid, 2000. Ground surface temperature reconstruction based on data from a deep borehole in permafrost at Janssonhaugen, Svalbard. Annals Glaciol., 31, 287–294.
- Jia, G.J., H.E. Epstein, and D.A. Walker, 2003. Greening of Arctic Alaska, 1981–2001. Geophys. Res. Lett., 30(20), 2067, doi: 10.1029/2003GL018268.
- Johannessen, O.M., L. Bengtsson, M.W. Miles, S.I. Kuzmina, V.A. Semenov, G.V. Alekseev, A.P. Niagurny, V.F. Zakharov, L.P. Bobylev, L.H. Pettersson, K. Hasselmann, and H.P. Cattle, 2004. Arctic climate change: Observed and modeled temperature and sea ice variability. Tellus, 56A, 328–341.
- Johannessen, O.M., K. Khvorostovsky, M.W. Miles, and L.P. Bobylev, 2005. Recent ice-sheet growth in the interior of Greenland. Science, 310 (5750), 1013–1016.
- Jones, P.D., M. New, D.E. Parker, S. Martin, and Rigor, I.G., 1999. Surface air temperature and its variations over the last 150 years. Rev. Geophys., 37, 173–199.
- Jorgenson, M.T., C.H. Racine, J.C. Walters, and T.E. Osterkamp, 2001. Permafrost degradation and ecological changes associated with a warming climate in central Alaska. Climatic Change, 48(4), 551–571.
- Joughin, I., W. Abdalati, and M. Fahnestock, 2004. Large fluctuations in speed on Greenland’s Jakobshavn Isbrae glacier. Nature, 432, 608–610.
- Klimatologicheskii spravochnik SSSR (1961–1992). Meteorologicheskie ezhemesyachnie dannye za 1961–1992, chast’ II, VII, Temperatura pochvy, tumany,grozy, meteli i grad, Gidrometeoizdat, Leningrad (in Russian).
- Krabil, W., W. Abdalati, E.B. Frederick, S. Manizade, C. Martin, J. Sonntag, R. Swift, R. Thomas, W.Wright, and J. Yungel, 2004. Greenland ice sheet: Highelevation balance and peripheral thinning. Science, 289, 428–430.
- Kwok, R., G.F. Cunninham, H.J. Zwally, and D. Yi, 2006. ICESat over Arctic sea ice: Interpretation of altimetric and reflectivity profiles. J. Geophys. Res., 111, C06006, doi: 10.1029/2005JC003175.
- Laxon, S., N. Peacock, and D. Smith, 2003. High interannual variability of sea ice thickness in the Arctic Region. Nature, 425, 947–950.
- Lloyd, A.H., and C.L. Fastie, 2002. Spatial and temporal variability in the growth and climate response of treeline trees in Alaska. Climatic Change, 52, 481–509.
- Lucht, W., I.C. Prentice, R.B. Myneni, S. Sitch, P. Friedlingstein, W. Cramer, P. Bousquet, W. Buermann, and B. Smith, 2002. Climate control of the highlatitude vegetation greening and Pinatubo effect. Science, 296, 1687–1689.
- Mack, M.C., E.A.G. Schuur, M.S. Bret-Harte, G.S. Shaver, and F.S. Chapin III, 2004. Ecosystem carbon storage in Arctic tundra reduced by long-term nutrient fertilization. Nature, 431, 440–443.
- Maslowski, W., J.L. Clement, W. Walzowski, J.S. Dixon, J. Jakacki, and T.P. McNamara, 2006. Oceanic forcing of Arctic sea ice at gateways and margins of Pacific and Atlantic water inflow. Eos, Trans. AGU, 87(36), Ocean Sci. Meet. Suppl., Abstract OS32P-05.
- McLaughlin, F., E. Carmack, R.W. MacDonald, A.J. Weaver, and J. Smith, 2003. The Canada Basin 1989–1995: Upstream events and far-field effects of the Barents Sea. J. of Geophys. Res., 107(C7), 3233, doi: 10.1029/2002JC001537.
- Melling, H., D.A. Riedel, and Z. Gedalof, 2005. Trends in the draft and extent of seasonal pack ice, Canadian Beaufort Sea. Geophys. Res. Lett., 32, L24501, doi: 10.1029/2005GL024483.
- Morison, J.H., K. Aagaard, K.K. Falkner, K. Hatakeyama, R. Moritz, J.E. Overland, D. Perovich, K. Shimada, M. Steele, T. Takizawa, and R. Woodgate, 2002. North Pole environmental observatory delivers early results. Eos, Trans. AGU, 83(33), 357, doi: 10.1029/2002EO000259.
- Morison J., M. Steele, T. Kikuchi, K. Falkner, and W. Smethie, 2006. Relaxation of central Arctic Ocean hydrography to pre-1990s climatology. Geophys. Res. Lett., 33, L17604, doi:10.1029/2006GL026826.
- Morison, J., V. Alexander, L. Codispoti, T. Delworth, B. Dickson, H. Eicken, J. Grebmeier, J. Kruse, J.E. Overland, M. Serreze, and J. Walsh, 2001. SEARCH: Study of Environmental Arctic Change. Seattle, Washington, Polar Science Center, Applied Physics Laboratory.
- Myneni, R.B., C.D. Keeling, C.J. Tucker, G. Asrar, and R.R. Menani, 1997. Increased plant growth in the northern high latitudes from 1981 to 1991. Nature, 386, 698–702.
- Myneni, R.B., C.J. Tucker, G. Asrar, and C.D. Keeling, 1998. Interannual variations in satellite-sensed vegetation index data from 1981 to 1991. J. Geophys. Res., 103, 6145–6160. Nelson, F.E., K.M. Hinkel, N.I. Shiklomanov, G.R. Mueller, L.L. Miller, and D.A. Walker, 1998. Annual and interannual active layer thaw patterns on the North Slope of Alaska. J. Geophys. Res., 103, 28,963–28,974.
- Nixon, F.M., C. Tarnocai, and L. Kutny, 2003. Long-term active layer monitoring: Mackenzie Valley, northwest Canada. In Permafrost, Phillips, M., Springman, S. and L. U. Arenson (eds.), Swets & Zeitlinger, Lisse, 821–826.
- Oberman, N.G., and G.G. Mazhitova, 2001. Permafrost dynamics in the northeast of European Russia at the end of the 20th century. Norweg. J. Geog., 55, 241–244.
- Oechel, W.C., G.L. Vourlitis, J. Verffaillie, T. Crawford, S. Brooks, E. Dumas, A. Hope, D. Stow, B. Boynton, V. Nosov, and R. Zulueta, 2003. A scaling approach for quantifying the net CO2 flux of the Kuparuk River Basin, Alaska. Global Change Biol., 6, 160–173.
- Osterkamp, T.E., 2003. A thermal history of permafrost in Alaska. Proceedings of the 8th International Conference on Permafrost, July 21–25, 2003, Zurich, Switzerland, M. Phillips, S.M. Springman, and L.U. Arenson (eds.). Lisse, The Netherlands, A.A. Balkema, vol. 2, 863–868.
- Osterkamp, T.E., and V.E. Romanovsky, 1999. Evidence for warming and thawing of discontinuous permafrost in Alaska. Permafrost Periglac. Proc., 10(1), 17–37.
- Osterkamp, T.E., L. Viereck, Y. Shur, M.T. Jorgenson, C. Racine, A. Doyle, and R.D. Boone, 2000. Observations of thermokarst and its impact on boreal forests in Alaska, U.S.A. Arc. Antarc. Alp. Res., 32, 303–315.
- Overland, J.E., M.C. Spillane, D.B. Percival, M. Wang and H.O. Mofjeld, 2004a. Seasonal and regional variation of pan-Arctic surface air temperature over the instrumental record. J. Climate, 17, 3263–3282.
- Overland, J.E., M.C. Spillane, and N.N. Soreide, 2004b. Integrated analysis of physical and biological pan-Arctic change. Climatic Change, 63, 291–322.
- Overland, J.E., and M. Wang, 2005. The third Arctic climate pattern: 1930s and early 2000s. Geophys. Res. Lett., 32, L23808, doi: 10.1029/2005GL024254.
- Proshutinsky, A., R.H. Bourke, and F.A. McLaughlin, 2002. The role of the Beaufort Gyre in Arctic climate variability: Seasonal to decadal time scales. Geophys. Res. Lett., 29(23), 2100, doi: 10.1029/2002GL015847.
- Overpeck, J.T., M. Sturm, J.A. Francis, D.K. Perovich, M.C. Serreze, R. Benner, E.C. Carmack, S. Chapin III, S.C. Gerlach, L.C. Hamilton, L.D. Hinzman, M. Holland, H.P. Huntington, J.R. Key, A.H. Lloyd, G.M. MacDonald, J. Mc-Fadden, D. Noone, T.D. Prowse, P. Schlosser, and C. Vörösmarty, 2005. Arctic system on trajectory to new, seasonally ice-free state. Eos, Trans. AGU, 86(34), 309–313.
- Pavlov, A.V., 1994. Current changes of climate and permafrost in the Arctic and sub-Arctic of Russia. Permafrost Periglac. Proc., 5, 101–110.
- Pavlov, A.V., and N.G. Moskalenko, 2002. The thermal regime of soils in the north of western Siberia. Permafrost Periglac. Proc., 13(1), 43–51.
- Peterson, B.J., R.M. Holmes, J.W. McClelland, C.J. Vörösmarty, R.B. Lammers, A.I. Shiklomanov, I.A. Shiklomanov, and S. Rahmstorf, 2002. Increasing river discharge to the Arctic Ocean. Science, 298, 2171–2173.
- Pfirman, S., W.F. Haxby, R. Colony, and I. Rigor (2004) Variability in Arctic sea ice drift. Geophys. Res. Lett., 31, L16402, doi: 10.1029/2004GL020063.
- Polyakov, I.V., et al., 2005. Onemore step toward a warmer Arctic. Geophys. Res. Lett., 32, L17605. doi: 10.1029/2005GL023740.
- Polyakov, I., G.V. Alekseev, R.V. Bekryaev, U. Bhatt, R. Colony, M.A. Johnson, V.P. Karklin, D. Walsh, and A.V. Yulin, 2003. Long-term ice variability in Arctic marginal seas. J. Climate, 16(12), 2078–2085.
- Proshutinsky, A., J. Yang, R. Krishfield, R. Gerdes, M. Karcher, F. Kauker, C. Koeberle, S. Hakkinen, W. Hibler, D. Holland, M. Maqueda, G. Holloway, E. Hunke, W. Maslowski, M. Steele, and J. Zhang, 2005. Arctic Ocean Study: Synthesis of model results and observations. Eos, Trans. AGU, 86(40), 368, 10.1029/2005EO400003.
- Proshutinsky A., I.M. Ashik, E.N. Dvorkin, S. Häkkinen, R.A. Krishfield, and W.R. Peltier, 2004. Secular sea level change in the Russian sector of the Arctic Ocean. J. Geophys. Res., 109, C03042, doi: 10.1029/2003JC002007.
- Proshutinsky, A., R.H. Bourke, and F.A. McLaughlin, 2002. The role of the Beaufort Gyre in Arctic climate variability: Seasonal to decadal time scales. Geophys.Res Lett., 29 (23), 2100, doi: 10.1029/2002GL015847.
- Proshutinsky, A.Y., and M.A. Johnson, 1997. Two circulation regimes of the wind driven Arctic Ocean. J. Geophys. Res., 102(C6), 12,493–12,514.
- Przybylak, R., 2002. Variability of Air Temperature and Atmospheric Precipitation in the Arctic. Dordrecht, The Netherlands, Kluwer, 330 pp.
- Quadrelli, R., and J.M. Wallace, 2004. A simplified linear framework for interpreting patterns of northern hemisphere wintertime climate variability. J. Climate, 17, 3728–3744.
- Rawlins, M.A., R.B. Lammers, S. Frolking, B. Fekete, and C.J. Vörösmarty, 2003. Simulating pan-Arctic runoff with a macro-scale terrestrial water balance model. Hydrol. Proc., 17, 2521–2539.
- Reeburgh, W.S., J.Y. King, S.K. Regli, G.W. Kling, N.A. Auerbach, and D.A. Walker, 1998. A CH4 emission estimate for the Kuparuk River basin, Alaska. J. Geophys. Res., 103, 29,005–29,014.
- Rignot, E., and P. Kanagaratnam, 2006. Changes in the velocity structure of the Greenland ice sheet. Science, 311, 986–990.Rigor, I., and J.M. Wallace (2004) Variations in the age of Arctic sea-ice and summer sea-ice extent. Geophys. Res. Lett., 31, L09401, doi: 10.1029/2004GL019492.
- Romanovsky, V.E., and T.E. Osterkamp, 2000. Effects of unfrozen water on heat and mass transport processes in the active layer and permafrost. PermafrostPeriglac. Proc., 11, 219–239.
- Romanovsky, V.E., N.I. Shender, T.S. Sazonova, V.T. Balobaev, G.S. Tipenko, and V.G. Rusakov, 2001. Permafrost temperatures in Alaska and East Siberia: Past, present and future. Proceedings of the Second Russian Conference on Geocryology (Permafrost Science), Moscow, June 6–8, p. 301–314.
- Romanovsky, V.E., M. Burgess, S. Smith, K. Yoshikawa, and J. Brown, 2002. Permafrost temperature records: Indicator of climate change. Eos, Trans. AGU,83(50), 589, 593–594.
- Romanovsky, V., K. Yoshikawa, D. Sergueev, and Y. Shur, 2005. Permafrost observatory near Gakona, Alaska. Local-scale features in permafrost distribution and temperatures. Eos, Trans. AGU, 86, Fall Meet. Suppl.
- Rothrock, D.A., Y. Yu, and G.A. Maykut, 1999. Thinning of the Arctic sea-ice cover. Geophys. Res. Lett., 26, 3469–3472. Rudels, B., E.P. Jones, L.G. Anderson, and G. Kattner, 1994. On the intermediate depth waters of the Arctic Ocean. In The Polar Oceans and Their Role in Shaping the Global Environment: The Nansen Centennial Volume, O.M. Johannessen,R.D.Muench, and J.E. Overland (eds.), Washington, D.C., American Geophysical Union, 33–46.
- SEARCH Science Steering Committee, 2005. SEARCH: Study of Environmental Arctic Change: Plans for implementation during the International Polar Year and beyond. Fairbanks, Alaska, Arctic Research Consortium of the United States (ARCUS), 104 pp.
- SEARCH Science Steering Committee, 2001. SEARCH: Study of Environmental Arctic Change Science Plan. Seattle, Washington, Polar Science Center, Applied Physics Laboratory, University of Washington, 49 pp.
- Serreze, M.C., J.E. Walsh, F.S. Chapin III, T. Osterkamp, M. Dyurgerov, V. Romanovsky, W.C. Oechel, J. Morison, T. Zhang, and R.G. Barry, 2000. Observational evidence of recent change in the northern high-latitude environment. Climatic Change, 46, 159–207.
- Serreze, M.C., F. Carsey, R.G. Barry, and J.C. Rogers, 1997. Icelandic low cyclone activity: Climatological features, linkages with the NAO and relationships with recent changes in the northern hemisphere circulation. J. Climate, 10, 453–464.
- Shiklomanov, I.A., A.I. Shiklomanov, R.B. Lammers, B.J. Peterson, and C.J. Vörösmarty , 2000. The dynamics of river water inflow to the Arctic Ocean. In The Freshwater Budget of the Arctic Ocean. E.L. Lewis (ed.), Dordrecht, Kluwer Academic Press, 281–296.
- Shimada, K., E.C. Carmack, K. Hatakeyama, and T. Takizawa, 2001. Varieties of shallow temperature maximum waters in the western Canadian Basin of the Arctic Ocean. Geophys. Res. Lett., 28(18), 3441–3444.
- Shimada, K., F. McLaughlin, E. Carmack, A. Proshutinsky, S. Nishino, and M. Itoh, 2004. Penetration of the 1990s warmtemperature anomaly of Atlantic Water in the Canada Basin. Geophys. Res. Lett., 31, L20301, doi: 10.1029/ 2004GL020860.
- Shimada, K., T. Kamoshida, M. Itoh, S. Nishino, E. Carmack, F. McLaughlin, S. Zimmermann, and A. Proshutinsky, 2006. Influence of Pacific summer water on the recent anomalous reduction of ice cover in the Arctic Ocean. Eos, Trans. AGU, 87(36), Ocean Sci. Meet. Suppl., Abstract OS33N-01.
- Silapaswan, C.S., D. Verbyla, and A.D. McGuire, 2001. Land cover change on the Seward Peninsula: The use of remote sensing to evaluate potential influences of climate change on historical vegetation dynamics. Can. J. Remote Sens., 5, 542–554.
- Smith, S.L., M.M. Burgess, D. Riseborough, and F.M. Nixon, 2005. Recent trends from Canadian permafrost thermal monitoring network sites. Permafrost Periglac. Proc., 16, 19–30.
- Steffen, K., N. Cuillen, R. Huff, C. Stewart, and E. Rignot, 2004. Petermann Gletscher’s floating tongue in northwestern Greenland: Peculiar surface features, bottom melt channels and mss balance assessment. Paper presented at the 34th International Arctic Workshop, Institute of Arctic and Alpine Research, Boulder, Colorado, March 10–13.
- Steele, M., J. Morison, W. Ermold, I. Rigor, M. Ortmeyer, and K. Shimada, 2004. Circulation of summer Pacific halocline water in the Arctic Ocean. J. Geophys. Res., 109, C02027, doi: 10.1029/2003JC002009.
- Stroeve, J.C., M.C. Serreze, F. Fetterer, T. Arbetter, W. Meier, J. Maslanik, and K. Knowles, 2005. Tracking the Arctic’s shrinking ice cover: Another extreme September minimum in 2004. Geophys. Res. Lett., 32(4), L04501, doi: 10.1029/2004GL021810.
- Sturm, M., C. Racine, and K. Tape, 2001. Increasing shrub abundance in Arctic. Nature, 411, 547–548.
- Sturm, M., J. Schimel, G. Michaelson, V.E. Romanovsky, J.M. Welker, S.F. Oberbauer, G.E. Liston, and J. Fahnestock, 2005. Winter biological processes could help convert Arctic tundra to shrubland. BioScience, 55, 1726.
- Tarnocai, C., F.M. Nixon, and L. Kutny, 2004. Circumpolar-Active-Layer-Monitoring (CALM) sites in theMackenzie Valley, northwestern Canada. Permafrost Periglac. Proc., 15, 141–153.
- Thompson, D.W.J., and M. Wallace, 1998. The Arctic Oscillation signature in the wintertime geopotential height and temperature fields. Geophys. Res. Lett., 25(9), 1297–1300.
- Thomas, R.H., 2004. Greenland: Recent mass balance observations. In Mass Balance of the Cryosphere: Observations and Modeling of Contemporary and Future Changes. J. Bamber, and A. Payne (eds.), Cambridge, Cambridge University Press, 393–436.
- Varlamov, S.P., 2003. Variations in the thermal state of the lithogenic base of landscapes in central Yakutia. Proceedings of the Second International Conference, The Role of Permafrost Ecosystems in Global Climate Change, 12–17 August 2002, Yakutsk, Russia, 52–56.
- Varlamov, S.P., Yu.B. Skachkov, P.N. Skryabin, and N.I. Shender, 2001. Thermal response of the lithogenic base of permafrost landscapes to recent climate change in central Yakutia. Proceedings of the International Conference, The Role of Permafrost Ecosystems in Global Climate Change, 3–5 May 2000, Yakutsk, Russia, 44–45.
- Walker, D.A., H.E. Epstein, J.G. Jia, C. Copass, E.J. Edwards, W.A. Gould, J. Hollingsworth, J. Knudson, H. Maier, A. Moody, and M.A. Raynolds, 2003. Phytomass, LAI, and NDVI in northern Alaska: Relationships to summer warmth, soil pH, plant functional types and extrapolation to the circumpolar Arctic. J. Geophys. Res., 108, 8169, doi: 8110.1029/2001d00986.
- Walker, D.A., M.K. Raynolds, F.J.A. Daniels, E. Einarsson, A. Elvebakk, W.A. Gould, A.E. Katenin, S.S. Kholod, C.J. Markon, E.S. Melnikov, N.G. Moskalenko, S.S. Talbot, B.A. Yurtsev, and CAVM Team, 2005. The circumpolar Arctic vegetation map. J. Veg. Sci., 16, 267–282.
- Wang, X., and J.R. Key (2005a) Arctic surface, cloud, and radiation properties based on the AVHRR Polar Pathfinder dataset. Part I: Spatial and temporal characteristics. J. Climate, 18, 2558–2574.Wang, X., and J.R. Key, 2005b. Arctic surface, cloud, and radiation properties based on the AVHRR Polar Pathfinder dataset. Part II: Recent trends. J. Climate, 18, 2575–2593.
- Woodgate R.A., K. Aagaard, T.J. Weingartner, 2006. Interannual changes in the Bering Strait fluxes of volume, heat and freshwater between 1991 and 2004, Geophys. Res. Lett., 33, L15609, doi: 10.1029/2006GL026931.
- Yoshikawa, K., W.R. Bolton, V.E. Romanovsky, M. Fukuda, and L.D. Hinzman, 2003. Impacts of wildfire on the permafrost in the boreal forests of interior Alaska. J. Geophys. Res., 107, 8148. doi: 10.1029/2001JD000438, 2002. (Printed 108(D1), 2003.)
- Yu, Y., G.A. Maykut, and D.A. Rothrock, 2004. Changes in the thickness distribution of Arctic sea ice between 1958–1970 and 1993–1997. J. Geophys. Res., 109, C08004, doi: 10.1029/2003JC001982.
- Zhang, T., O.W. Frauenfeld, M.C. Serreze, A.J. Etringer, C. Oelke, J.L. McCreight, R.G. Barry, D. Gilichinsky, D. Yang, H. Ye, F. Ling, and S. Chudinova, 2005. Spatial and temporal variability of active layer thickness over the Russian Arctic drainage basin . J. Geophys. Res., 110, D16101, doi: 10.1029/2004JD005642.
- Zhang, X., J.E. Walsh, J. Zhang, U.S. Bhatt, and M. Ikeda, 2004. Climatology and interannual variability of Arctic cyclone activity. J. Climate, 17, 2300–2317.
- Zhou, L., C.J. Tucker, R.K. Kaufmann, and D. Slayback, 2001. Variations in northern vegetation activity inferred from satellite data of vegetation index during 1981 to 1999. J. Geophys. Res., 106, 20,069–20,083.
- Zwally, H.J., W. Abdalati, T. Herring, K. Larson, J. Saba, and K. Steffen, 2002. Surface melt-induced acceleration of Greenland ice-sheet flow. Science, 297(5579), 218–222.