Roadless space
| Topics: |

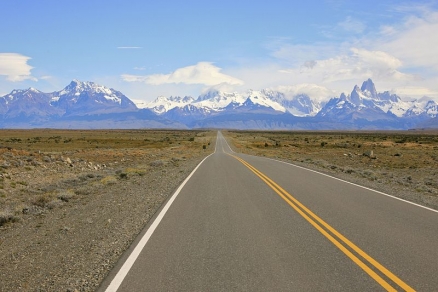
El Chaltén, a well-known spot for trekking and hiking, is a small village of 1,000 people located 216 km (134 miles) from El Calafate. (Source: Alex Proimos from Sydney, Australia (Long Road to El Chalten Uploaded by russavia) (http://creativecommons.org/licenses/by/2.0), via Wikimedia Commons)
Contents
Roadless space
Roadless space is what lies between roads. When new roads are built, roadless space diminishes. On the infrequent occasions when roads are removed, roadless space increases. The measurement of these changes, and of the total quantity of roadless space, is the subject of this article.
Humans develop access to land in order to extract resources (mine, log, and farm), build residences, and do business (process goods in factories, store them in warehouses, distribute, and sell them). The transportation network ties all these activities and developments together and grows along with the population and economy. Roads are by far the most prevalent of transportation features in the United States; compare the 6.5 million km of roads with the 0.15 million km of operating rail lines—a length ratio of roads to railroads in excess of 40. By measuring the penetration of roads into undeveloped areas, some of which may be surrounded by earlier development, we are well on the way to quantifying the development process. Roads and other development features have numerous documented effects on flora, fauna, water quality, and other natural conditions (see Landscape ecology: Its role as the scientific underpinning of land-use planning); by better describing how roads encroach into undeveloped areas, we improve our ability to understand and forecast these consequences.
The central idea of roadless space or undeveloped space is this: the penetration of a road into an undeveloped area diminishes its space. This penetration does not, however, diminish area in any significant way. A hypothetical example is useful. Consider Yellowstone National Park, the world's first national park. It has an area of 8,990 square km, laid out approximately as a 95 km square. If 1,000 km of roads were added to the park, crisscrossing it and penetrating into its remotest parts, then the park's total area would be unchanged and its unpaved area would be diminished by approximately 10 square km. This is a tiny fractional reduction in area (0.1%), which illustrates that area metrics are ineffective in expressing road penetration. The same phenomenon plays out at national scale; in the conterminous United States roads occupy approximately 1% of the surface area, yet roads have penetrated the land to such an extent that the point most isolated from roads is only 30 km away from the nearest road (this point is located near the southeast corner of Yellowstone National Park). Metrics other than area are needed in order to effectively measure road penetration.
Measuring Roadless Space
A portfolio view
An investor calculates the worth of a portfolio by adding up the values of the portfolio's constituent stock shares, which are generally unequal. A land area (a county, perhaps) can be broken up into many pieces (think here of small tiles, perhaps 10 m on the side), and each piece can be treated as a share with its own value. We want to calculate the "roadless value" of this collection of small pieces. We assign higher values to pieces that are far from roads, lower values to those that are close to roads, and no value to pieces that are occupied by or adjacent to roads. The simplest way to assign a value consistent with these general ideas is to make a piece's value equal to its distance from (or to) the nearest road multiplied by its area (we suggested above, but did not require, that the small pieces be equal in area). The area multiplication has the effect of making the result relatively insensitive to the size chosen for the pieces; essentially the same result would be obtained using pieces that are squares 5 m, 10 m, or 15 m on a side when analyzing most real–world road networks. The portfolio value calculated in this way has units of volume, for example km (distance from road) × km2(area) = km3(volume).
The measurement of space in volume units on a (relatively) flat earth is counterintuitive. The following section illustrates graphically why and how this works.
A three dimensional view
We can make a synthetic terrain whose height above a planar base equals distance to the nearest road. Figure 1 shows two volumes with equal base areas of 1 km2. The left volume is a square pyramid whose height everywhere equals the distance to the nearest perimeter road; the peak of the pyramid is 1/2 km from each of the four roads. In the right volume, height is limited by the short distance to the long side roads. The elongated pyramid on the right has 47 percent of the volume of the square pyramid on the left, illustrating that the shape of a perimeter affects volume even when the enclosed basal area is unchanged (in this case 1 km by 1 km on the left and 3 km by 1/3 km on the right).
 Figure 1. Two road (blue lines) configurations with the same area and differing volumes.
Figure 1. The blue lines represent roads. The two solids have equal footprint areas, but a road pattern with a short perimeter has larger volume (more roadless space) than one with a long perimeter.
Figure 2 illustrates the effects of road penetration. Beginning again with a square km, we add four roads, each of length 1/2 km, in two different ways. The first way is to run these short roads from the centers of the side roads to the center of the large square, thus producing four smaller squares; this reduces the volume of the original pyramid by 50 percent. The second way is to run the short roads close to the perimeter roads; this shaves a bit of volume from each face of the original pyramid, reducing volume by 13.5 percent. Volume reduction is large when roads penetrate to the core of a roadless area (deep penetration) and small when roads remain close to perimeter roads (shallow penetration). In other words the volume of the synthetic terrain reflects the depth of road penetration.
 Figure 2. Roads that penetrate to the core of a roadless space diminish volume more than roads that remain close to other roads.
Figure 2. Roads of equal lengths have been added to the two patterns on the right. Roadless volume is reduced more when added roads penetrate to the center of a roadless area than when they remain close to existing roads.
The synthetic terrain volume—roadless volume—measures the space between roads; it can be calculated in different places for comparison, or in one area at different times to quantify the loss (or, less often, gain) of space as the road network changes. Roadless volume calculated from the synthetic terrain perspective is mathematically identical to the portfolio calculation described above.
In the real world
Road patterns in some agricultural areas are regular squares and rectangles like those of Figures 1 and 2, but generally in the real world they are more random. In spite of road pattern irregularities, calculation of distance from a point to the nearest road is easily done. Geographic information systems (GISs) typically use Dijkstra's network algorithm on a regular grid. Distance calculations can be done more accurately using fast marching algorithms. In either case, distance values are calculated in reverse by simulating movement of a front, at a uniform speed, away from all roads. The time that the front crosses a particular point is then proportional to its distance to the nearest road. Roadless volume for an area is calculated either by finding the average distance to the nearest road and multiplying by the area, or else by adding the distances measured on a regular grid and multiplying by the area of one grid cell.
Roadless Space of the United States
The progression of road invasion is difficult to measure because there are few places in the United States where consistent road maps have been made at different times. One place where this has been done is along the Front Range of Colorado, where road maps were made from aerial photographs taken in 1937, 1957, 1977, and 1997. The newer photos were deliberately degraded to the same resolution as the older photos in order to prevent potential biases caused by changing photographic quality. Roadless volumes calculated from the first (1937) and last (1997) map are shown in the two panels of Figure 3. Over the 60 year interval, roadless volume diminished by 44 percent.
 Figure 3. Roadless space, depicted here as synthetic terrain, diminished by 44% between 1937 and 1997 along the Front Range of Colorado.
Figure 3. Roadless space, depicted here as synthetic terrain, diminished by 44% along the Front Range of Colorado between 1937 and 1997 as Denver, its suburbs, and satellite cities replaced farm land.
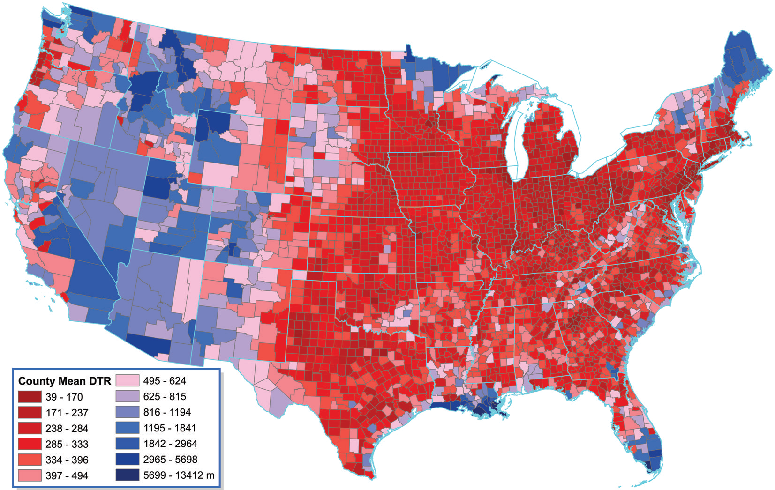
It is easier to make place–to–place comparisons of roadless space variability among states or counties for a single time. Figure 4 shows this variability at county scale, depicting how the 2.1 million km3 of roadless space of the United States is distributed. Color coding of Figure 4 is by distance to road rather than volume; the roadless space of a county is the product of its size —which is already apparent on the map—and its average distance to road. Broad patterns on the map reflect the following geographic controls over the current status of the road network:
- Roadless space generally increases from East to West, a product of history (population migration from East to West) and climate (low productivity land in much of the West)
- Roadless space increases in mountains and deserts (note the band of enhanced average road distances along the Appalachian Mountains and the huge area of high road distances in the desert interior West)
- Roadless space increases where there is a lot of surface water (Everglades of southern Florida, swamps of the Louisiana coast, and the lake region of northern Minnesota)
- Roadless space decreases where agriculture is intense (note the climate–induced gradients across Kansas and the Dakotas, reflecting higher intensity of agriculture in the wetter eastern sections than in the drier western sections)
- Roadless space decreases in areas of high human population density.
 Figure 4. Map showing broad distribution of roadless space at county scale in the lower 48 states of the United States.
Figure 4. Map showing broad distribution of roadless space at county scale in the lower 48 states of the United States.
Ecological implications
The geometric implications of roadway density have a marked impact upon habitats and the success of species. Greater than the loss of habitat is the effect of habitat fragmentation, which impacts the ability of animals to move across the landscape and may effectively separate whole populations into smaller, isolated populations that are more prone to extinction.
An application: road isolation
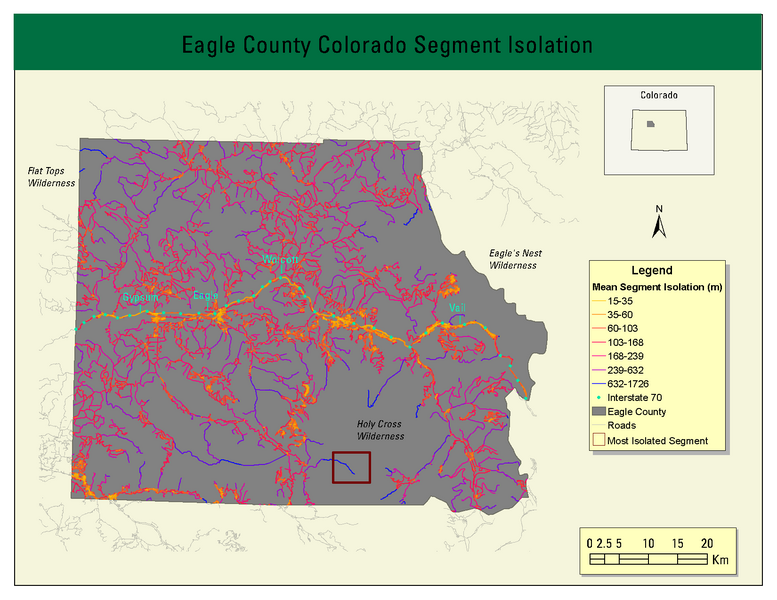
Most people have an intuitive idea of the meaning of the terman isolated road. Roadless space provides an ideal way to make this notion quantitative and to assign numeric isolation values to road segments. This is done by measuring the amount of space in the neighborhood of a point on a road (actually all points on all roads). This measurement, however, must be done using adaptive neighborhood sizes; if there is not much space, then small neighborhoods are appropriate, but if a road lies adjacent to a large roadless area then it takes a larger neighborhood to sense the large space. The selection of neighborhood size is somewhat complex, but once it has been done then the isolation values along a road segment (generally intersection–to–intersection or intersection–to–dead–end) are averaged and the average is assigned to the segment and mapped. Figure 5 shows an example result for Eagle County, Colorado. There are many roads in the neighborhood of Interstate 70, and these have low values of road isolation (orange); roads that penetrate into wilderness areas have the highest isolation values (blue). It is easy to tell from the map that colors correspond to the surrounding roadless space.
 Figure 5. Map showing road isolation (space surrounding roads) in Eagle County, Colorado.
Figure 5. Road isolation (space surrounding roads) in Eagle County, Colorado.
Summary
Roadless space is diminished wherever a road is built, and increased wherever a road is removed. There is generally more road building than road removal as humans continue to enhance their access to land. The roadless volume metric can be used to document the rate of roadless space loss and to identify the specific places where loss occurs. The metric is additive so that, for example, the roadless volume of a state is the sum of the roadless volumes of its constituent counties; this property makes the metric useful for environmental policy and analysis. The loss of roadless space has a general correspondence to vulnerability of watersheds, habitats, and ecosystems to alterations induced by roads and traffic (see Roads, highways, and ecosystems).
Further Reading
Dijkstra, E.W., 1959, A Note on Two Problems in Connection with Graphs: Numerische Math., v. 1, p. 269–271.
Forman, R.T.T., Sperling, D., Bissonette, J.A., Clevenger, A.P., Cutshall, C.D., Dale, V., Fahrig, L., France, R., Goldman, C.R., Heanue, K., Jones, J.A., Swanson, F.J., Turrentine, T., and Winter, T.C., 2003, Road Ecology: Science and Solutions: Washington, D.C., Island Press, 481 p.
Sethian, J.A., 1999, Level set methods and fast marching methods: evolving interfaces in computational geometry, fluid mechanics, computer vision, and materials science (2nd ed.), Cambridge University Press, 378 p.
Watts, R.D., Compton, R.W., McCammon, J.H., Rich, C.L., Wright, S.M., Owens, T., and Ouren, D.S., 2007, Roadless Space of the Conterminous United States: Science, v. 316, no. 5825, p. 736–738.