Response of wolves to corridor restoration and human use management
| Topics: |
Contents
- 1 Introduction Increasing levels of human activity in mountainous areas have made restoring connectivity for large carnivores a conservation priority. The presence or absence of large carnivores can have large effects on an ecosystem (Response of wolves to corridor restoration and human use management) [1]. Wolves are particularly important carnivores because they affect prey populations[2] and can cause ripple down effects in ecosystems[3]. Wolves are a conservation priority because they incur higher risk of mortality due to their wide-ranging movements[4], they are sensitive to habitat fragmentation[5], and they avoid areas with high levels of human activity[6].
- 2 Methods
- 3 Results
- 4 Discussion
- 5 Acknowledgments
- 6 Notes (Response of wolves to corridor restoration and human use management)
- 7 Further Reading
Introduction Increasing levels of human activity in mountainous areas have made restoring connectivity for large carnivores a conservation priority. The presence or absence of large carnivores can have large effects on an ecosystem (Response of wolves to corridor restoration and human use management) [1]. Wolves are particularly important carnivores because they affect prey populations[2] and can cause ripple down effects in ecosystems[3]. Wolves are a conservation priority because they incur higher risk of mortality due to their wide-ranging movements[4], they are sensitive to habitat fragmentation[5], and they avoid areas with high levels of human activity[6].
Wildlife corridors are important conservation tools for maintaining connected and viable populations of some species, especially in areas where little functional habitat remains[7]. Although the benefits of corridors are often species specific[8], corridors can also affect important ecological interactions[9]. We define a corridor as a narrow landscape element used by wildlife to travel or migrate from one habitat patch to another[10]. However, many corridor studies have been criticized because they lack corroborative movement data[11]. In addition, many corridor studies fail to demonstrate how animal movements change with the presence and absence of corridors[12], nor do they compare the frequency of movements in vs. outside the corridors[13]. Finally, few studies have examined the effect of corridors on animals that occur at low population density.
The objective of our study was to determine how corridor restoration changes the distribution of wolves and prey in and around a corridor. We address previously mentioned limitations in corridor studies by snow tracking wolf movements before and after corridor restoration. Moreover, we tracked wolf movements both inside and outside of the corridor. We compared resources used by wolves to resources on available movement routes and also compared resources used by wolves before and after restoration to address the following research questions: (1) Did the proportion of wolf use in the corridor and surrounding landscape change following restoration? (2) How did wolf use of resources in winter change following corridor restoration? (3) What were the biological consequences of restoration for wolves and for predator–prey processes?
Methods
Study area and corridor restoration
We conducted our research in the Athabasca Valley of Jasper National Park (JNP). JNP, which is 10,878 km2 in area, consists of mountains that naturally fragment the landscape and restrict the movement of many large mammals to lower elevations. The Athabasca Valley provides high quality habitat for large carnivores such as wolves, grizzly bears (Ursus arctos), and cougars (Felis concolor) as well as their prey such as elk and deer (Odocoileus hemionus and Odocoileus virginianus)[14]. However, roads, recreation facilities, and a town potentially affect the habitat and movements of these species. Most human activity occurs in the valley bottoms. Consequently, areas between high human activity and steep topography have become important movement routes or corridors for large carnivores.
In contrast to carnivore use of the Athabasca Valley, elk concentrate in areas close to human activity and the town of Jasper where they find refuge from predators[15]. This is reflected in higher elk recruitment rates compared to rates found in backcountry herds[16]. In 2000, Parks Canada removed elk from the Athabasca Valley in an attempt to reduce dangerous elk-human conflicts and effects of herbivory on aspen and rare grassland habitats. However, elk remain habituated to human activity, and high recruitment rates suggest they continue to obtain refuge from predators near human development[17].
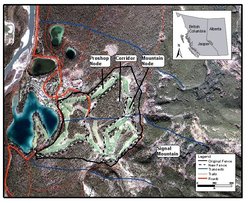 Fig. 1. Location of the study area in Jasper National Park showing golf course fairways, realignment of the fence, and track transects used to detect wolves and measure prey abundance and snow depth.
 A 2-meter-high wire link fence was constructed 70 yr ago to exclude elk from the Fairmont Jasper Park Lodge (JPL) golf course, which is approximately 1 kilometers (km) from the town site. Short sections of the fence were in disrepair enabling elk to enter the golf course. Hundreds of cross-country skiers used track-set ski trails, and daily commercial sleigh rides were offered. A golf course maintenance shop and two houses operated year-round within the golf course. The golf course abuts the base of Signal Mountain, and preliminary monitoring suggested that large carnivores, including wolves, were displaced onto steeper slopes above the golf course as they moved through the JPL area[18]. Golf course staff actively hazed elk out of the golf course in summer but not winter. Consequently, elk congregated and resided within the golf course throughout the winter.
In November 2001, a wildlife corridor was restored through the forested center of the golf course by modifying the golf course fence (Fig. 1). Fairways, Proshop Node, and Mountain Node on either side of the corridor were fenced. The corridor ranges from 210 meters (m) at its narrowest point to 450 m, with an average width of 330 m. Three previously fenced fairways remain within the corridor area. Golfers enter and exit the corridor fairways through pedestrian self-closing gates and cattle guards. The new wood-rail fence is designed to be permeable to carnivore movement but to exclude elk from the majority of the unnatural food sources found on the fairways. Around the perimeter of the golf course, the new fence was relocated close to the fairways, which provided wolves and elk access to previously fenced forested habitat. Human activity remained the same as it had previously during the golf season, however, winter track-set skiing and hayrides were relocated, and media encouraged skiers and hikers to avoid the study area from mid-October to April. A voluntary winter use restriction on the hiker trails near the golf course and the base of Signal Mountain further reduced human use in the study area.
Track transects: wolf detection, prey density, and snow depth
We used transects in winter to detect wolf movement, estimate prey abundance, and record snow depths. Three parallel transects were established through the middle and edges of the study area (Fig. 1). The north and south transects were used to find wolf tracks for subsequent snow tracking, whereas the middle transect was used to record tracks of all large mammals and to record snow depth at permanent 100 meter (m) intervals. The transects were oriented to capture the movement of wildlife through the corridor and 1.5 kilometers (km) up Signal Mountain. Sampling occurred from 15 November to 1 April each winter during 2001, 2002, and 2003 and for a minimum of 12 hours after snowfall and every 3 days thereafter until new snowfall or until snow conditions deteriorated and tracks were no longer discernable. The number of tracks and species were recorded at each crossing location using a hand-held Global Positioning System (GPS). Mule deer and white-tailed deer tracks were indistinguishable and were therefore combined.
Wolf snow tracking
When wolf tracks were detected on a transect, we followed the tracks through the study area and simultaneously recorded our position with a hand-held Global Positioning System (GPS). At the same time, we collected information on pack size, date of tracks, snow depth, trail type on or off a human use trail, and direction of travel. All tracking sessions were downloaded into the GIS ArcInfo® for data preparation. Data were analyzed using the freeware statistical package R® 1.8.1[19].
Human use
For each month we calculated the average number of people/day on trails. Trailmaster© infrared counters collected trail use data continuously on four hiker trails that crossed the study area. Skier and hiker use of the golf course was more dispersed and was estimated monthly by onsite golf course staff. Recreationists were discouraged from using the golf course area in Years 2 and 3, i.e., post-restoration period. Before including the counter data, we cleaned the data to remove counts clearly caused by weather, e.g., snowfall, and animals, i.e., counts between 11 pm and 6 am. Days when the counters did not work were omitted from monthly averages. For trails without counter data, we estimated human use using data from previous years or from surrounding trails.
Wolf resource use
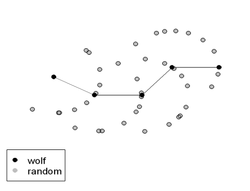 Fig. 2. For the conditional logistic regression, 10 random points were paired with each wolf point. Wolf paths (a) were first simplified into a series of wolf points separated by 500 m (b). To avoid bias potentially associated with the start of each path, we defined the first step as a random point along the first 500 m of the path. To create the controls (c), random turning angles between ± 90 degrees were added to the previous direction of travel.
 To examine wolf response to restoration, we first determined what topographic and human use variables were important to wolves within the study area using match case-control or conditional logistic regression[20]. This method compares the habitat characteristics of successive wolf locations, coded as 1, to paired random locations, coded as 0, in the study area[21]. We selected wolf locations at 500 meter (m) intervals along wolf paths and generated random locations at a 500 m radius from the previous location and within 90° of the previous direction of travel (Fig. 2). Consequently, this analysis isolated the movement decisions of wolves by comparing the habitat attributes of where wolves decided to travel to habitat attributes where wolves could have traveled. These variables were collected as part of this research or were available from existing park databases or digital images. We thus measured wolf preference and avoidance of habitat-related resources and human use features. We used forward stepwise logistic regression and Akaike Information Criteria (AICc) to identify which variables were the best predictors of wolf habitat use[22]. We accounted for correlation amongst successive wolf points in our standard error estimates by jackknifing blocks of data grouped by wolf path.
Explanatory variables used to predict wolf occurrence were elevation, slope, forest cover, snow depth, relative prey abundance, distance to nearest trail (0–25, 26–100, 101–200, > 200 m), log (distance) to JPL resort (km), node, and trail use, i.e., people/day. Elevation (kilometers [km]) and slope (°) were generated from a digital elevation model with a resolution of 25 m. Forest cover (yes = 1, no = 0) was digitized from orthographic photographs. Snow depths (centimeters [cm]) were linked to wolf data by date and elevation, whereas prey data was linked to wolf data by date and node. For a given transect, relative prey abundances, i.e., number of tracks/km/day, were calculated as the total number of deer and elk crossings within each node, i.e., corridor, fenced nodes, or Signal Mountain. Therefore, the number of crossings was divided by node width (km) and the number of days since the last transect or snowfall. We classified distance to nearest trail into four categories because we expected a nonlinear response and because we assumed that trails would have negligible effects on wolf movements when wolves were greater than 200 m from trails. We considered locations 0–25 m from trails to be on the trail.
Changes in wolf resource use
To determine differences in wolf use of important resources before and after restoration we used several one-way ANOVAs. Resources analyzed were elevation, slope, relative abundance of prey, i.e., elk and deer, snow depth, distance to and level of human use on the nearest hiker trail. We accounted for a strong right-skewed distribution in the data and the lack of independence between successive wolf locations at 100 meter (m) intervals, by conducting the analysis with randomization tests blocked by tracking session[23]. To protect against experimentwise error, we used the Bonferroni adjustment in the post hoc tests.
Changes in movement after corridor restoration could be confounded by changes in prey distribution, snow depth, and levels of human use. Therefore, we tested for differences in these variables among years. First, we examined factors that influenced the number of elk and deer within each node, Proshop, Corridor, Mountain, and Signal, using generalized linear models with a Poisson distribution. Explanatory variables in these models included node, year, pretreatment and posttreatment, snow depth, number of days since the previous transect, and interactions between node and year or treatment. To select the best predictive model, we created a set of candidate models using likely combinations of explanatory variables. We compared the predictability of the models using AICc and selected the best models with the lowest AICc score[24].
Second, we tested for changes in snow depth among years by modeling snow depth as a function of elevation, month, year, and the interaction between elevation and year. Snow depths within each track transect were correlated. Therefore, we included track transect as a random effect in a linear mixed-effects model. We selected the best model using AICc[25]. Lastly, we visually examined changes in trail and golf course use among years by comparing trail and golf course use by month over the 3 years of the project.
Results
One wolf pack traveled through the study area for one winter before and two winters following restoration. The number of wolves traveling through the study area ranged from one to four animals during each of the 3 years. We recorded 16, 36, and 14 passages by wolves through the study area in Year 1 (2000–2001), Year 2 (2001–2002), and Year 3 (2002–2003) respectively. Of these passages, 1, 81, and 51% were detected within the golf course corridor in Years 1, 2, and 3, respectively. It is clear from Fig. 3 that wolves used the corridor a higher proportion of the time following restoration. The proportion of wolf passages through the corridor was similar in the 2-yr post restoration period (G-test, Gadj = 1.75, P = 0.186). Wolf tracks were detected in the permanently fenced portion of the golf course on 1, 2, and 0 occasions in Years 1, 2, and 3, respectively. Between 23 and 26 transects were completed each winter.
| Table 1. Model predicting wolf occurrence using match case-control logistic regression. JPL: Jasper Park Lodge. | ||||
|---|---|---|---|---|
| Variable | ? | SE | t-value | P |
| Elevation | -8.56 | 3.10 | -2.76 | 0.006 |
| Slope | -0.046 | 0.016 | -2.96 | 0.003 |
| Prey | 0.035 | 0.027 | 1.31 | 0.190 |
| Node, reference = Signal Mountain | ||||
| Node, Corridor | 0.351 | 0.333 | 1.06 | 0.290 |
| Node, Mountai | -2.432 | 0.612 | -3.97 | < 0.001 |
| Node, Proshop | -2.499 | 0.804 | -3.11 | 0.002 |
| Distance to JPL (log) | 2.989 | 0.805 | 3.71 | < 0.001 |
| Distance to trail, reference > 200 m | ||||
| 0–25 | 2.166 | 0.26 | 8.14 | < 0.001 |
| 25–100 | 0.883 | 0.221 | 3.99 | < 0.001 |
| 100–200 | -0.032 | 0.243 | -0.13 | 0.900 |
| Trail use | -0.030 | 0.030 | -1.00 | 0.320 |
Wolf resource use in the study area
The most parsimonious model that predicted wolf use within the study area included elevation, slope, prey, node, distance from resort facilities, distance from trail, and level of human use on the nearest trail (ROC = 0.75; Table 1). This model indicated that wolves were positively associated with lower elevation and shallower slopes. Wolves avoided Mountain and Proshop Nodes, the two remaining fenced nodes, and the hotel facilities at the Jasper Park Lodge. Wolves neither selected nor avoided the corridor compared to Signal Mountain. Distance to the nearest trail was partitioned into four distance classes: 0–25 [[meter]s] (m), i.e., near or on the trail, 26–100 m, 101–200 m and > 200 m. At low levels of human use, wolves selected areas within 25 and 100 m of trails compared to areas > 100 m. When the wolves traveled through the study area, they weakly selected areas with lower levels of trail use.
Changes in resource use by wolves
The randomized analysis of variance tests revealed significant differences in wolf use of elevation, slope, prey, elk abundance, and snow among years (Table 2). In Year 2, i.e., the first year following restoration, but not Year 3, wolves used lower elevations and shallower slopes compared to Year 1. In the final year, wolves increased their use of areas with high prey abundance, specifically elk abundance. Finally, snow depths used by wolves were lower in Year 3 than Year 1, but this was because snow depths overall were lower during that year (see below).
| Table 2. Mean value of resources used by wolves in each year of the study. Comparisons among years were made using randomized ANOVA blocked by track with 10,000 replicates. Post-hoc tests used Bonferroni adjusted P-values and a critical P-value of 0.017. Identical letter symbols (a or b) indicate that means are similar among years. | ||||||
|---|---|---|---|---|---|---|
| Variables | Year 1 | Year 2 | Year 3 | |||
| Elevation | 1126.7 | a | 1067.3 | b | 1090.2 | a,b |
| Slope | 9.1 | a | 4.2 | b | 5.6 | a,b |
| Prey | 6.6 | a | 6.8 | a | 14.1 | b |
| Elk | 2.6 | a | 3.9 | a | 9.7 | b |
| Deer | 4.0 | a | 3.0 | a | 4.4 | a |
| Snow | 11.8 | a | 7.9 | a,b | 5.2 | b |
| Trail use | 1.8 | a | 3.2 | a | 2.0 | a |
Confounding factors: changes in prey distribution, snow depths, and human use
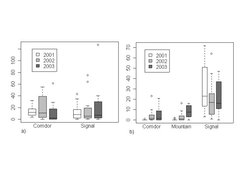
The number of elk tracks in a node was negatively associated with snow depth but positively associated with the number of days since the last snowfall or time since last transect (Table 3). Over 3 yr, elk numbers increased on Signal Mountain. In the corridor, elk numbers were similar in Years 1 and 2, but decreased in Year 3 (Fig. 4a). The observed and expected numbers of elk had similar distributions (Kolmogorov-Smirnov test, D = 0.3, P = 0.76), thus the model had strong overall fit. Prior to restoration, elk appeared complacent or aggressive towards people and after restoration elk usually fled when approached by people, especially when wolves had recently traveled through the corridor[26].
The number of deer tracks in a node was unaffected by snow depth but was positively associated with the number of days since last snowfall (Table 3). As expected, deer detections increased with the number of sampling days. On Signal Mountain, deer numbers decreased in Year 2 but then increased to prerestoration levels in Year 3. In the Mountain node, the number of deer increased each year (Fig 4b). In the Corridor, deer numbers increased following restoration, and there was little difference between Years 2 and 3. The observed and expected numbers of deer had similar distributions (Kolmogorov-Smirnov test, D = 0.2, P = 0.98), thus the model had strong overall fit. However, heteroscedasticity among residuals from our generalized linear model suggests that there was not a clear log-linear response between the number of deer and the explanatory variables.
| Table 3. Generalized linear models with a Poisson distribution predicting the number of (a) elk and (b) deer on a snow transect. | ||||
|---|---|---|---|---|
| Variable | ? | SE | t-value | P |
| (a) Elk | ||||
| Snow depth | -0.038 | 0.007 | -5.86 | < 0.001 |
| Number of sample days | 0.362 | 0.023 | 16.09 | < 0.001 |
| Node, reference = Signal | ||||
| Corridor | -0.104 | 0.121 | -0.86 | 0.390 |
| Year, reference = Year 1 | ||||
| Year 2 | 0.267 | 0.110 | 2.43 | 0.015 |
| Year 3 | 1.074 | 0.123 | 8.73 | < 0.001 |
| Node × Year | ||||
| Corridor × Year 2 | 0.113 | 0.151 | 0.75 | 0.455 |
| Corridor × Year 3 | -0.601 | 0.163 | -3.69 | < 0.001 |
| (b) Deer | ||||
| Number of sample days | 0.329 | 0.023 | 14.62 | < 0.001 |
| Node, reference = Signal | ||||
| Mountain | -4.748 | 0.580 | -8.19 | < 0.001 |
| Corridor | -5.846 | 1.001 | -5.84 | < 0.001 |
| Year, Reference = Year 1 | ||||
| Year 2 | -0.460 | 0.084 | -5.46 | < 0.001 |
| Year 3 | 0.105 | 0.097 | 1.09 | 0.278 |
| Node × Year | ||||
| Mountain × Year 2 | 2.859 | 0.607 | 4.71 | < 0.001 |
| Corridor × Year 2 | 4.344 | 1.013 | 4.29 | < 0.001 |
| Mountain × Year 3 | 3.721 | 0.595 | 6.26 | < 0.001 |
| Corridor × Year 3 | 4.570 | 1.012 | 4.52 | < 0.001 |
Snow depths ranged from 0 to 36 centimeters (cm). The best performing model for predicting snow depth included elevation, year, and month. Year 1 and January were reference categories. This model explains approximately 50% of the variation in snow depth (R2 = 0.496). As elevation increased, i.e., higher on Signal Mountain, snow depth increased (Table 4). Snow depth was significantly lower in Years 2 and 3 compared to Year 1, and snow was deeper in February and March than during December and January.
| Table 4. Model parameters for the best linear mixed effects model predicting snow depth determined by Akaike Information Criteria (AIC). | ||||
|---|---|---|---|---|
| Variable | ? | SE | t-value | P |
| Elevation | 0.036 | 0.002 | 23.60 | < 0.001 |
| Year, reference = 1 | ||||
| Year 2 | -2.784 | 1.129 | -2.46 | 0.018 |
| Year 3 | -6.348 | 1.330 | -4.77 | < 0.001 |
| Month, reference = January | ||||
| February | 3.525 | 1.222 | 2.89 | 0.006 |
| March | 9.461 | 1.539 | 6.15 | < 0.001 |
| December | -1.474 | 1.448 | -1.02 | 0.314 |
Human use of the golf course declined during Years 2 and 3 after track-set skiing and sleigh rides were relocated. Trail use also declined on trail 7a during Years 2 and 3 and on trail 7 during Year 3 when voluntary use restrictions were installed at the trailheads asking people to avoid these areas. Use on other trails in the study area increased slightly following restoration. Trail counters likely overestimated human use because daytime detections included wildlife and some snow events.
Discussion
After the corridor was restored, wolves shifted the proportions of their movements from Signal Mountain to the valley-bottom corridor, but rarely traveled through the permeable wood-rail fences adjacent to the corridor. Elk that were previously concentrated within the golf course dispersed along the corridor and Signal Mountain or out of the study area and were unable to cross the wood-rail fences adjacent to the corridor. The number of deer increased within the corridor and within the areas contained by the wood-rail fences, whereas the number of deer along the mountainside remained unchanged after restoration. Interestingly, wolves rarely traveled through the permeable fence to hunt deer. Three possible reasons for this are first, the wood-rail fences may have presented psychological barriers to most but not all wolves within the pack. Second, wolf movements may have been driven by the distribution of elk and not deer given that they appear to preferentially hunt elk and opportunistically hunt deer in this multi-prey system[27]. Third, the fenced areas adjacent to the corridor consisted of relatively open fairways. Wolves likely select forested areas within the corridor to minimize the probability of encountering people[28]. During the 3 years of study, the wolves killed just one deer within the corridor. Thus, corridor restoration provided wolves with limited access to elk and deer within the corridor and appeared to function more as a movement route than habitat for feeding and resting. More importantly, corridor restoration provided wolves with a movement route along the valley bottom that likely increased their access to elk and deer in the surrounding low elevation area.
Resources important to wolves and change in resource use
When wolves traveled through the study area, they selected lower elevations, shallower slopes, and areas of high prey abundance, and these movements were typical of wolves in other areas[29]. Consistent with wolf movement in other areas, they selected low use trails[30] likely because they offered easy travel routes across the study area with low probabilities of encountering people[31]. Conversely, the wolves avoided areas near the resort and weakly avoided trails with high levels of human use, presumably to minimize the probability of encountering people[32]. When wolves shifted their movement following restoration, they increased their use of low elevations, shallow slopes, and high prey abundance, suggesting corridor creation increased the area of high quality habitat available to wolves within the study area.
Relative importance of corridor opening vs. human use management
When the corridor was restored, the golf course fences were reconfigured, and at the same time, human activity was reduced within the corridor. Therefore, it is difficult to determine the relative importance of each factor on the frequency of wolf use within the corridor. However, our results suggest that wolf use of the corridor was primarily a response to fence restoration and secondarily to reduction in human activity. Before corridor restoration, fences prevented wolves from using most areas of the golf course, and subsequent fence reconfiguration provided wolves with access to the corridor. With this action alone, corridor restoration may have been less successful because wolves strongly avoided the hotel facilities and weakly avoided areas near trails with high levels of human activity. Although wolves in other areas are variable in their responses to people[33], many wolves spatially and temporally avoid human activity[34]. Thus, even though it is unclear how reducing human activity within the corridor affected our results, reducing human activity may be an important component of restoration actions.
Biological implications of corridor restoration
Few studies have been able to empirically estimate the biological consequences of corridor restoration. The biological implications of restoration in this study extended beyond restoring connectivity to valley-bottom habitat. Prior to corridor restoration, elk congregated in the golf course where they were relatively safe from wolf predation. After restoration, the abundance of elk decreased within the corridor and concurrently increased on Signal Mountain. Wolves, on the other hand, increased their movements within the corridor post-restoration. Given the changes in both elk and wolf distributions post-restoration and the potential effects of elk on vegetation[35], our results suggest that corridor restoration has potential to affect the broader ecology of the study area.
Confounding factors and limitations of study design
Our research indicates that wolves responded to fence reconfiguration and perhaps reduced levels of human activity within the corridor, and not to other possible confounding factors. However, we discuss three of these confounding factors that could contribute to shifts in wolf movement. First, a concurrent increase in prey within the corridor could explain the increased wolf movement. Interestingly, the number of elk declined overall through the study period while the relative abundance of deer increased. Thus, prey density remained unchanged or declined slightly within the corridor following restoration, which would not explain the increased wolf movement. Second, if snow depths increased following restoration, wolves would be more likely to select easier travel routes in the valley bottoms[36]. Instead, snow depth decreased following restoration, and yet, wolves used lower elevations during that time. The third confounding factor that could contribute to a shift in wolf movement is a change in pack behavior during that period. Tracking data from other areas of this pack’s home range and observations of this pack indicate that the pack’s home range and behavioral responses to people remained similar during the 3 years of this study. Although these confounding effects were unlikely, our study was limited in that it was unreplicated, and it did not systematically distinguish the effects of fence reconfiguration from the effects of human activity. Consequently, generalizations to other study areas must be made cautiously.
Wolves, elk, and deer in this study changed their distributions within 1 year of corridor restoration. This quick response to corridor restoration was also observed in Banff National Park, where after restoration, wolves frequently used an area in which they had not been observed the previous 8 years[37]. Together, these studies suggest that wide-ranging animals quickly learn how human activity changes within their home range, and that for these target species corridor restoration can improve habitat quality and reduce habitat fragmentation.
Acknowledgments
The Fairmont Jasper Park Lodge and Parks Canada cooperatively funded this research and corridor restoration. We thank George Mercer, Perry Cooper, and Glenn Griffis for designing the corridor. We thank Parks Canada staff for communication material that successfully reduced human activity in this area, and we thank the community of Jasper for supporting this restoration. We appreciate the efforts of Glenn Griffis, Mike Wesbrook, George Mercer, Anne Forshner, Rick Ralf, and Jeanine and Mike D'Antonio who helped snow-track wolves. Anne Forshner, Sal Rasheed and two anonymous reviewers provided constructive comments for this manuscript.
Notes (Response of wolves to corridor restoration and human use management)
Further Reading
- Beier, P., and R. F. Noss. 1998. Do habitat corridors provide connectivity? Conservation Biology 12:1241–1252.
- Burnham, K. P., and D. R. Anderson. 1998. Model selection and inference: a practical information–theoretic approach. Springer-Verlag, New York, New York, USA. ISBN: 0387985042
- Callaghan, C. J. 2002. The ecology of gray wolf (Canis lupus) habitat use, survival, and persistence in the central Rocky Mountains. Dissertation. University of Guelph, Guelph, Ontario, Canada.
- Davidson, A. C., and Hinkley, D. V. 1997. Bootstrap methods and their application. Cambridge University Press, New York, New York, USA. ISBN: 0521574714
- Dekker, D. G. 1985. Elk population fluctuations and their probable causes in the Snake Indian Valley of Jasper National Park: 1970–85. Alberta Naturalist 15:49–54.
- Dekker, D. G., W. Bradford, and J. R. Gunson. 1996. Elk and wolves in Jasper National Park, Alberta, from historical times to 1992. Pages 85–94 in L. N. Carbyn, S. H. Fritts, and D. R. Seip, editors. Ecology and conservation of wolves in a changing world. Canadian Circumpolar Institute, Edmonton, Alberta, Canada.
- Duke, D. L. 2001. Wildlife use of corridors in the Central Canadian Rockies: multivariate use of habitat characteristics and trends in corridor use. Thesis. University of Alberta, Edmonton, Alberta, Canada.
- Duke, D., M. Hebblewhite, P. Paquet, C. Callaghan, and M. Percy. 2001. Restoring a large-carnivore corridor in Banff National Park. Pages 261–275 in D. S. Maehr, R. F. Noss, and J. L. Larkin, editors. Large mammal restoration: ecological and sociological challenges in the 21st century. Island Press, Washington, D.C., USA. ISBN: 1559638176
- Haddad, N., D. Bowne, A. Cunningham, B. Danielson, D. Levey, S. Sargent, and T. Spira. 2003. Corridor use by diverse taxa. Ecology 84:609–615.
- Hebblewhite, M. 2006. Linking predation risk and forage to ungulate population dynamics. Thesis. University of Alberta, Edmonton, Alberta, Canada.
- Hebblewhite, M., D. H. Pletscher, and P. Paquet. 2002. Elk population dynamics in areas with and without predation by recolonizing wolves in Banff National Park, Alberta. Canadian Journal of Zoology 80:789–799.
- Hebblewhite, M., C. White, C. Nietvelt, J. McKenzie, and T. Hurd. 2005. Human activity mediates a trophic cascade caused by wolves. Ecology 86:2135–2144.
- Holroyd, G., and K. Van Tighem. 1983. Ecological (biophysical) land classification of Banff and Jasper National Parks. Volume 3. The wildlife inventory. Canadian Wildlife Service, Edmonton, Alberta, Canada.
- Huggard, D. J. 1993a. Effect of snow depth on predation and scavenging by gray wolves. Journal of Wildlife Management 57:382–388.
- Huggard, D. J. 1993b. Prey selectivity of wolves in Banff National Park: I. Prey species. Canadian Journal of Zoology 71:130–139.
- Ihaka, R., and R. Gentleman. 1996. R: a language for data analysis and graphics. Journal of Computational and Graphical Statistics 5:299–314.
- James, A. R. C., and A. K. Stuart-Smith. 2000. Distribution of caribou and wolves in relation to linear corridors. Journal of Wildlife Management 64:154–159.
- Kaartinen, S., I. Kojola, and A. Colpaert. 2005. Finnish wolves avoid roads and settlements. Annales Zoologici Fennici 42:523–532.
- McKenzie, J. 2001. The selective advantage of urban habitat use by elk in Banff National Park. Thesis. University of Guelph, Guelph, Ontario, Canada.
- McLaren, B. E., and Peterson, R. O. 1994. Wolves, moose, and tree rings on Isle Royale. Science 266:1555–1558.
- McNay, M. E. 2002. Wolf–human interactions in Alaska and Canada: a review of the case history. Wildlife Society Bulletin 30:831–843.
- Mladenoff, D. J., T. A. Sickley, and A. P. Wydeven. 1999. A regional landscape analysis and prediction of favorable gray wolf habitat in the northern Great Lakes region. Ecological Applications 9:37–44.
- Musiani, M., H. Okarma, and J. Wlodzimierz. 1998. Speed and actual distances traveled by radiocollared wolves in Bialowieza Primeval Forest (Poland). Acta Theriologica 43:409–416.
- Parks Canada. 2000. Jasper National Park of Canada Management Plan. Minister of Public Works and Government Services, Ottawa, Ontario, Canada.
- Percy, M. 2003. Temporal and spatial activity patterns of large carnivores in the Bow Valley of Banff National Park. Thesis. University of Alberta. Edmonton, Alberta, Canada.
- Ripple, W. J., and E. J. Larsen. 2000. Historic aspen recruitment, elk, and wolves in northern Yellowstone National Park, USA. Biological Conservation 95:361–370.
- Rosenberg, D. K., B. R. Noon, and E. C. Meslow. 1997. Biological corridors: form, function and efficacy. BioScience 47:677–687.
- Schultz, C. B. 1998. Dispersal behavior and its implications for reserve design in a rare Oregon butterfly. Conservation Biology 12:284–292.
- Schultz, C. B., and E. E. Crone. 2005. Patch size and connectivity thresholds for butterfly habitat restoration. Conservation Biology 19:887–896.
- Soule, M. E., and M. E. Gilpin. 1991. The theory of wildlife corridor capability. Pages 3–8 in D. A. Saunders and R. J. Hobbs, editors. Nature conservation 2: the role of corridors. Surrey Beatty and Sons, Chipping Norton, Australia. ISBN: 0949324353
- Soule, M. E., J. A. Estes, J. Berger, and C. M. Del Rio. 2003. Ecological effectiveness: conservation goals for interactive species. Conservation Biology 17:1238–1250.
- Telfer, E. S., and J. P. Kelsall. 1984. Adaptation of some large North American mammals for survival in snow. Ecology 65:1828–1834.
- Terborgh, J., L. Lopez, P. Nuñez, M. Rao, G. Shahabuddin, G. Orihuela, M. Riveros, R. Ascanio, G. H. Adler, T. D. Lambert, and L. Balbas. 2001. Ecological meltdown in predator-free forest fragments. Science 294:1923–1926.
- Tewksbury, J. J., D. J. Levey, N. M. Haddad, S. Sargent, J. L. Orrock, A. Welden, B. J. Danielson, B. J., Brinkerhoff, J., Damschen, E. I., and P. Townsend. 2002. Corridors affect plants, animals, and their interactions in fragmented landscapes. Proceedings of the National Academy of Sciences of the United States of America 99:12923–12926.
- Theuerkauf, J., W. Jedrzejewski, K. Schmidt, and R. Gula. 2003a. Spatiotemporal segregation of wolves from humans in the Bialowieza forest (Poland). Journal of Wildlife Management 67:706–716.
- Theuerkauf, J., W. Jedrzejewski, K. Schmidt, H. Okarma, I. Ruczynski, S. Sniezko, and R. Gula. 2003b. Daily patterns and duration of wolf activity in the Bialowieza Forest, Poland. Journal of Mammalogy 84:243–253.
- Thurber, J. M., R. O. Peterson, T. D. Drummer, and S. A. Thomasma. 1994. Gray wolf response to refuge boundaries and roads in Alaska. Wildlife Society Bulletin 22:61–68.
- Watters, M. E. 2003. The effects of grazing by large herbivores on carbon and nitrogen dynamics in montane grasslands of Jasper National Park. Thesis. University of Alberta, Edmonton, Alberta, Canada.
- Weaver, J. L. 1994. Ecology of wolf predation amidst high ungulate diversity in Jasper National Park, Alberta. Dissertation. University of Montana, Missoula, Montana, USA.
- Weaver, J. L., P. C. Paquet, and L. F. Ruggiero. 1996. Resilience and conservation of large carnivores in the Rocky Mountains. Conservation Biology 10:964–976.
- Whittington, J., C. C. St. Clair, and G. Mercer. 2005. Spatial responses of wolves to roads and trails in mountain valleys. Ecological Applications 15:543–553.
- Wolff, J. O., and T. Van Horn. 2003. Vigilance and foraging patterns of American elk during the rut in habitats with and without predators. Canadian Journal of Zoology 81:266–271.