Metrics of Climate Change
Metrics of climate change include ocean (Seas of the world) temperature, atmospheric (Earth's atmosphere) temperature, wind patterns, precipitation, glacial and sea ice extent. The Intergovernmental Panel on Climate Change (IPCC)[1] in 2007 declared that
“Observational evidence from all continents and most oceans shows that many natural systems are being affected by regional climate changes.”
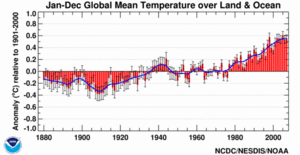
The Earth’s climate has warmed by 0.6o to 0.9o Celsius (1.1 to 1.6o Fahrenheit) since the Industrial Revolution and approximately 0.5oC compared to the 20th century average. (See Figure 1.) Precipitation has increased over the past century, although some regions have become wetter and some have become drier, consistent with scientists’ understanding of how heightened greenhouse gas concentrations affect climate regionally. Observed changes in ocean temperatures, altered wind patterns, ice sheet distribution, melting glaciers and sea ice, and timing of seasons may also be attributed in part to Greenhouse gas forcing. Although there is substantial natural variability in the climate system, a warming trend continued through 2008, with the year tied with 2001 as the eighth warmest globally since reliable measurements began in 1880.[2]
1880 - 2008

Figure 1 also shows that the global climate varies from year-to-year and over longer cycles, as well as showing a century-long trend to warming. Some influences are natural and some are very likely human-related. At regional and local scales, climate is generally even more variable. This illustrates the caution that should be exercised in trying to detect changes in trends in the context of variability. One or a series of hot or cool years, or a few extreme weather events, do not necessarily represent more than normal climate variability. For example, better scientific understanding of natural phenomena like La Nina, and solar variability have helped scientists to understand their cooling influence on global average temperatures since the year 2000, or the impact of El Nino on the extreme high temperature of 1998.[3] Detecting changes in the climate system requires measurements and assessment over decades or longer.
The U.S. Climate Change Science Program (CCSP) produced a new synthesis report in 2008, “reanalyzing” the U.S. climate from 1950 to the present,[4] evaluating observed and modeled changes, and attributing changes to different factors. The researchers estimated average warming over North America to have been 0.9oC (1.6oF) from 1951 to 2006, with almost all of the warming later than 1970. The reanalysis concluded, among other findings, that:
- The largest yearly average regional temperature increases have occurred over northern and western North America, with up to 2.0°C (3.6°F) warming in 56 years over Alaska, the Yukon Territories, Alberta, and Saskatchewan. On the other hand, there have been no significant yearly average temperature changes in the southern United Sates and eastern Canada.
- There has not been a significant trend in North American precipitation since 1951, although there have been substantial changes from year to year and even decade to decade.
The report did not find a significant trend in continental precipitation. Nor did it find systematic changes in how often or where severe droughts have occurred in the contiguous United States over the past decades. However, the demands and competition for water resources have increased in some regions, so that the vulnerability to drought is more severe.
References
Editor's Note
The first version of this article was drawn from Climate Change: Science Highlights by Jane Leggett, Congressional Research Service, February 23, 2009.
| Disclaimer: This article icontains information that was originally published by the Congressional Research Service. Topic editors and authors for the Encyclopedia of Earth have edited its content and added new information. The use of information from the Congressional Research Service should not be construed as support for or endorsement by that organization for any new information added by EoE personnel, or for any editing of the original content. |
Citation
Service, C. (2012). Metrics of Climate Change. Retrieved from http://editors.eol.org/eoearth/wiki/Metrics_of_Climate_Change- ↑ The IPCC is organized under the auspices of the United Nations and engages participation of more than 2000 scientists from around the world. According to its website, “The IPCC was established to provide the decision-makers and others interested in climate change with an objective source of information about climate change. The IPCC does not conduct any research nor does it monitor climate related data or parameters. Its role is to assess on a comprehensive, objective, open and transparent basis the latest scientific, technical and socio-economic literature produced worldwide relevant to the understanding of the risk of human-induced climate change, its observed and projected impacts and options for adaptation and mitigation. IPCC reports should be neutral with respect to policy, although they need to deal objectively with policy relevant scientific, technical and socio-economic factors. They should be of high scientific and technical standards, and aim to reflect a range of views, expertise and wide geographical coverage,” (extracted November 26, 2007). Previous assessment reports of the IPCC were published in 1990, 1995, and 2001.
- ↑ National Climate Data Center, Climate of 2008, National Oceanic and Atmospheric Administration, December 16, 2008. The NCDC is the United States federal government’s official source for climate data.
- ↑ National Climate Data Center, 2008 Annual Climate Review: U.S. Summary, National Oceanic and Atmospheric Administration, Asheville, NC, December 16, 2008, .
- ↑ Randall Dole, Martin Hoerling, and Siegfried Schubert, Reanalysis of Historical Climate Data for Key Atmospheric Features: Implications for Attribution of Causes of Observed Change, Final Report, CCSP Synthesis and Assessment Product 1-3 (Asheville: NOAA/NCDC, 2008).