Meig's Maps of Arid and Semiarid Regions
Peveril Meigs III (1903-1979) mapped the arid and semiarid regions of the world in the early 1950s for UNESCO and his maps have been widely used since that time. His original paper maps are digitized and present here in more useable formats. (Far more complete climate data are available for more of the world today, but the maps presented here have not been updated.)
Meigs first divided dryland climates into semiarid (S) and arid (A), generally separating areas with natural vegetation of grasses from those with desert plants. He used an index developed by C.W. Thornthwaite (1948) relating actual and potential evapotranspiration. Water is lost from a soil by direct evaporation and by evaporating from the surface of a leaf after it has been through a plant, a process known as transpiration. The two are lumped together and called evapotranspiration (ET). Potential Evapotranspiration (PET) occurs when there is enough water available for ET to operate at its maximum rate. Actual evapotranspiration (AET) is the amount of ET that does occur. If AET equals PET over a year, then there is ample water available for plants and Thornthwaite refers to that situation as ‘Humid.’ Where AET is less than PET, water deficits occur. Regions with a slight deficit are called ‘Sub-humid,’ moderate deficit is ‘Semiarid’ and areas with a large deficit of soil moisture are ‘Arid.’ Using precipitation, temperature, latitude, soil properties and other information, Thornthwaite and others (including Meigs) estimated PET and AET globally and Meigs used these maps to identify Semiarid and Arid regions of the world.
To further differentiate the dryland regions, Meigs analyzed the climate records for weather stations around the world in several ways. If a station had at least one year with no precipitation, then it was characterized at ‘Extremely Arid.’ Seasonality of precipitation was determined with no distinct seasonality (second letter: a), summer dominant (b) or winter dominant (c). For temperature, Meigs focused on the mean temperatures of the coldest (first number) and warmest months (second number). So, for example, much of Patagonia in South America is Aa12, and from the legend you can see that it is arid (A) with no distinct wet season (a), the average temperature of the coldest month is between 0 and 10°C (1) and the average temperature of the warmest month is between 10 and 20°C (2). On the same map, part of the Nordeste in Brazil is Sb33, making it semiarid (S) with more precipitation in Summer (b) and temperatures between 20 and 30°C in winter and summer (33).
References
Meigs, Peveril, 1953. World Distribution of Arid and Semi-arid Homoclimates. In, UNESCO, Reviews of Research on Arid Zone Hydrology, Paris: United Nations.
Thornthwaite, C. W., 1948. An Approach to a Rational Classification of Climate. Geographical Review, v. 38, no. 1, p. 55-94.
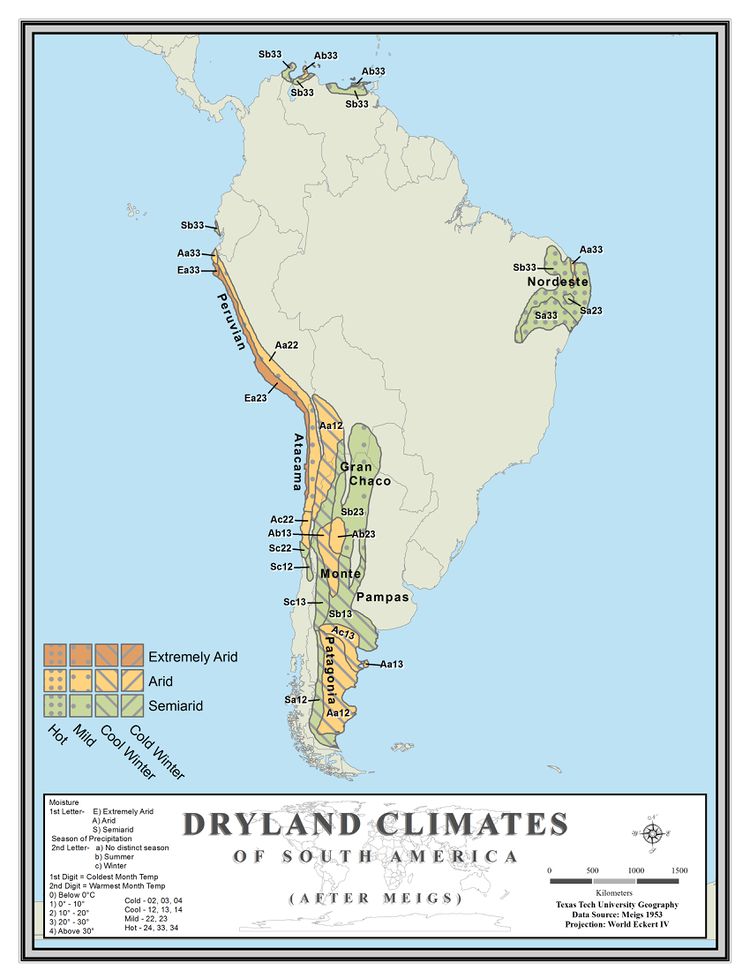 Dryland Regions of South America
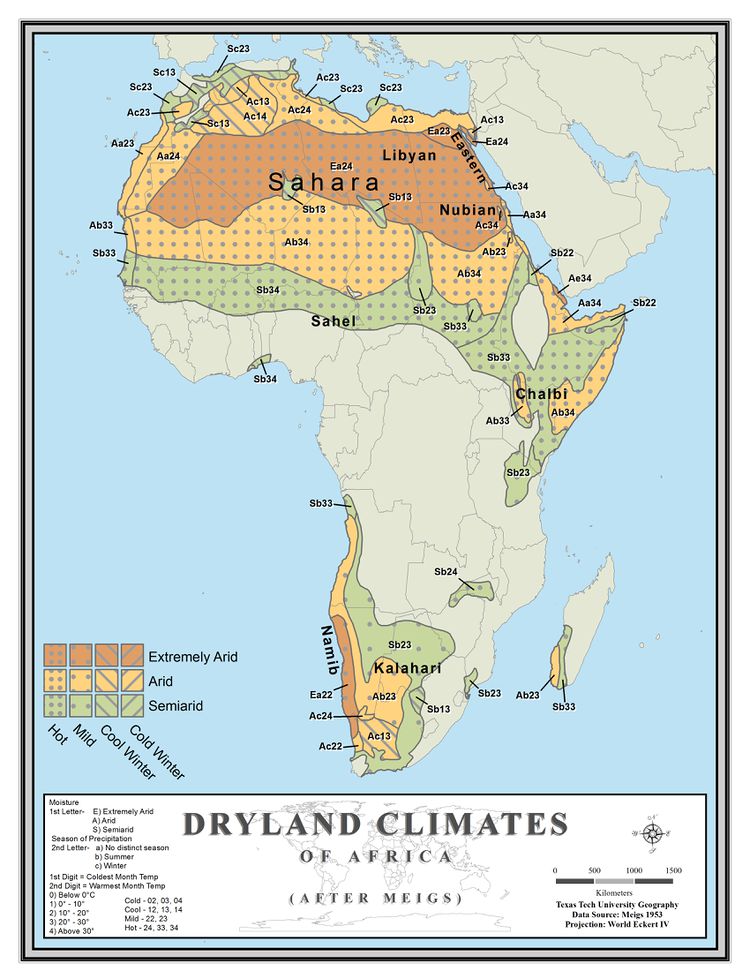 Dryland Regions of Africa
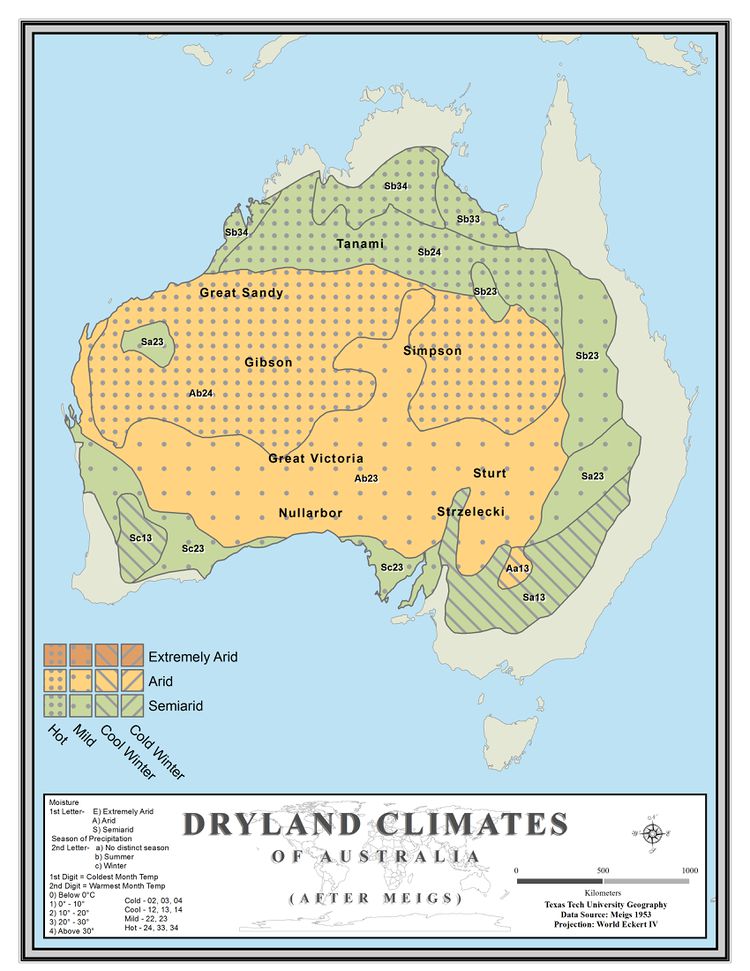 Dryland Regions of Australia
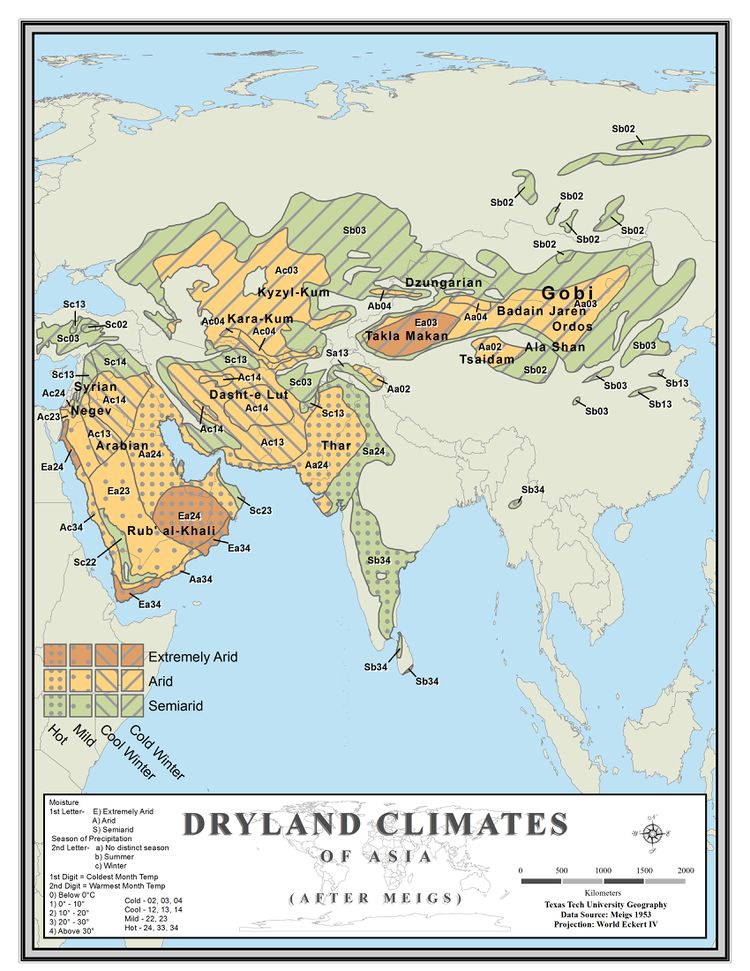 Dryland Regions of Asia
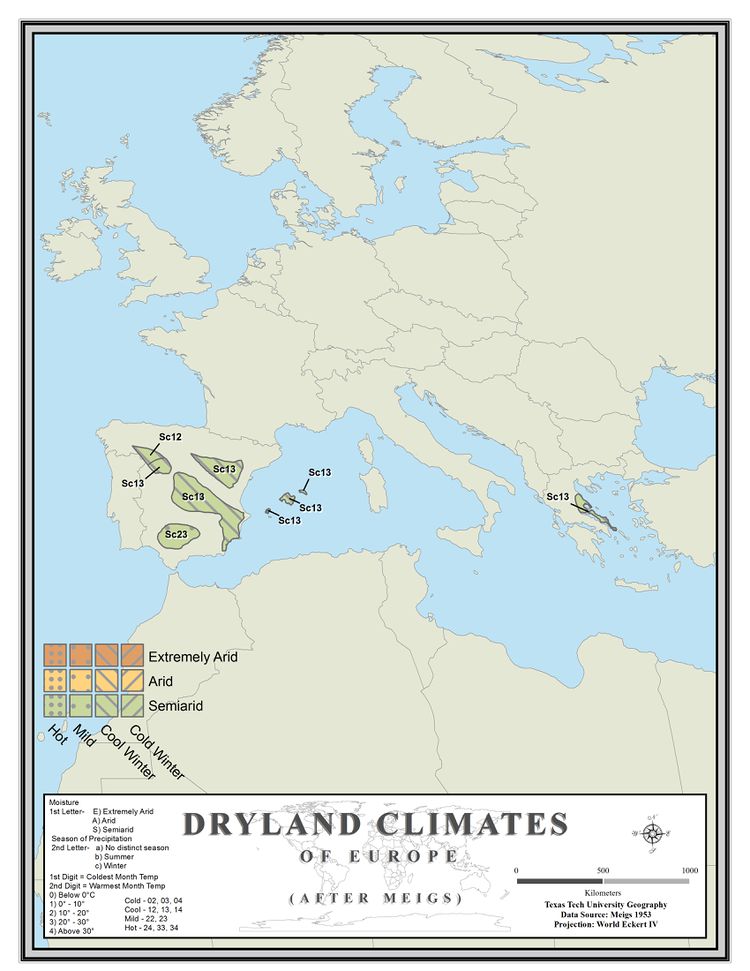 Dryland Regions of Europe
 Dryland Regions of North America