Experience curve (Energy)
Experience curve
| Topics: |
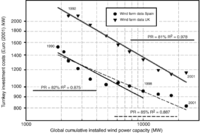
 Global experience curves for wind farms, using data from British and Spanish wind farms. All data are adjusted for inflation. The dotted line uses Spanish data from 1990 to 2001, the solid black line uses data from 1990 to 1998. The data set for the UK runs from 1992 to 2001. (Source: M. Junginger, A. Faaij and W. C. Turkenburg, Energy Policy, Volume 33, Issue 2, January 2005, Pages 133-150)
 Experience curves describe the reduction in unit cost of a product that is driven by economies of scale in production and distribution, and through learning by doing when a product moves from test markets into larger and larger markets, and is sold in higher numbers. Unit costs are thought to decay exponentially with the cumulative number of units sold. Experience curves are used to calculate the "progress ratio", which describes the relative cost after a doubling of units sold. A progress ratio of 85% means that costs are reduced by 15% with each doubling of units sold—or in the case of energy, of capacity installed. The progress ratio is assumed to be constant, and independent of the rate at which the experience is accumulated, of the developmental stage of the technology, and of potential qualitative evolution of the product or technology. Typically, progress ratios are assumed to be between 75 and 85%. Experience curves have been estimated for a variety of technologies (e.g., combined cycle gas turbines, wind turbines, solar photovoltaics, infrastructure, non-energy technologies). The results of the estimations are not always consistent, mostly due to problems with the availability and the statistical properties of data. Still, experience curves play an important role in medium- and long-term energy scenario calculations, for example for energy planning or climate policy purposes. They are used for the estimation of future cost of energy and determine the sequence in which technologies in least-cost optimization models are deployed.
Further Reading
- International Energy Agency. 2000. Experience Curves for Energy Technology Policy (PDF), International Energy Agency, Paris, France.
- Junginger, M., A. Faaij and W. C. Turkenburg. 2005. Global experience curves for wind farms, Energy Policy, 33(2)133-150.