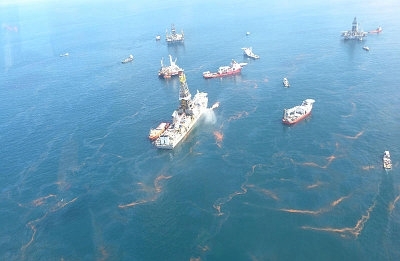
Estimate of Deepwater oil spill rate
NOAA-led analysis shows gases and oil in three chemically different mixtures: deep underwater, in the surface slick, and in the air.
Chemical measurements confirm
official estimate of Gulf oil spill rate
By combining detailed chemical measurements in the deep ocean, in the oil slick, and in the air, NOAA scientists and academic colleagues have independently estimated how fast gases and oil were leaking during the 2010 Deepwater Horizon oil spill in the Gulf of Mexico.
The new chemistry-based spill rate estimate, an average of 11,130 tons of gas and oil compounds per day, is close to the official average leak rate estimate of about 11,350 tons of gas and oil per day (equal to about 59,200 barrels of liquid oil per day).
“This study uses the available chemical data to give a better understanding of what went where, and why,” said Thomas Ryerson, Ph.D., a NOAA research chemist and lead author of the study. “The surface and subsurface measurements and analysis provided by our university colleagues were key to this unprecedented approach to understanding an oil spill.”
The NOAA-led team did not rely on any of the data used in the original estimates, such as video flow analysis, pipe diameter and fluid flow calculations. “We analyzed a completely separate set of chemical measurements, which independently led us to a very similar leak estimate,” Ryerson said.
The new study, Chemical data quantify Deepwater Horizon hydrocarbon flow rate and environmental distribution, was published online today in the journal Proceedings of the National Academy of Sciences USA.
The new analysis follows on another NOAA-led study published last year, in which Ryerson and colleagues estimated a lower limit to the Deepwater Horizon leak rate based on two days of airborne data collected during the spill and the chemical makeup of the reservoir gas and oil determined before the spill. The new analysis adds in many other sources of data, including subsurface and surface samples taken during six weeks of the spill and including a direct measure of the makeup of the gas and oil actually leaking into the Gulf.
Ryerson and his colleagues found that the leaking gas and oil quickly separated into three major pools: the underwater plume about 3,300-4,300 feet below the surface, the visible surface slick, and an airborne plume of evaporating chemicals. Each pool had a very different chemical composition.
The underwater plume was enhanced in gases known to dissolve readily in water, the team found. This included essentially all of the lightweight methane (natural gas) and benzene (a known carcinogen) present in the spilling reservoir fluid. The surface oil slick was dominated by the heaviest and stickiest components, which neither dissolved in seawater nor evaporated into the air. And the airborne plume of chemicals contained a wide mixture of intermediate-weight components of the spilled gas and oil.
The visible surface slick represented about 15 percent of the total leaked gas and oil; the airborne plume accounted for about another 7 percent. About 36 percent remained in a deep underwater plume, and 17 percent was recovered directly to the surface through a marine riser. The location of the balance, about 25 percent of the total, is not directly accounted for by the chemical data.
This information about the transport and fate of different components of the spilled gas and oil mixture could help resource managers and others trying to understand environmental exposure levels.
The chemical measurements made from mid-May through June showed that the composition of the atmospheric plume changed very little, suggesting little change in the makeup of the leaking gas and oil.
The team of researchers also used the detailed chemical measurements to calculate how much gas and oil, in total, was spilling from the breached reservoir deep underwater. The new chemistry-based estimate of 11,130 tons per day has an estimated range of 8,900 to 13,300 tons per day. By comparison, the official estimated range was 10,000 to 12,700 tons per day.
NOAA’s mission is to understand and predict changes in the Earth's environment, from the depths of the ocean to the surface of the sun, and to conserve and manage our coastal and marine resources.
January 9, 2012
Co-authors of the new paper, “Chemical data quantify Deepwater Horizon hydrocarbon flow rate and environmental distribution,” are R. Camilli (Woods Hole Oceanographic Institution), J.D. Kessler (Texas A&M University), E.B. Kujawinski and C.M. Reddy (Woods Hole Oceanographic Institution), D.L. Valentine (University of California, Santa Barbara), E.L. Atlas (University of Miami), D.R. Blake (University of California, Irvine), J.A. de Gouw (NOAA and Cooperative Institute for Research in Environmental Sciences, CIRES), S. Meinardi (University of California, Irvine), D.D. Parrish (NOAA), J. Peischl (NOAA and CIRES), J.S. Seewald (Woods Hole Oceanographic Institution), and C. Warneke (NOAA and CIRES).
