Deepwater Horizon trajectory map
Contents
Trajectory Maps
Beginning April 21, 2010, the modeling team at NOAA's Office of Reponse and Restoration (OR&R) began generating daily trajectories for the Deepwater Horizon/BP oil spill, continuing this work for 107 days. Click here (Deepwater Horizon trajectory map) to see the complete list of trajectory maps grouped by date. The production of trajectory maps was discontinued August 23, 2010.
Background
Cumulative trajectory maps were produced early in the Deepwater Horizon spill response (Oil Spill Response). They showed on one map the surface location of spilled oil for several consecutive days, as well as a forecast for the following day. As the area of water affected by the spill grew larger, the forecast aspect of these maps became more important than the day-to-day changes in surface oil, so the next trajectory products included only forecasts.
Forecasts for 24 hours, 48 hours, and 72 hours were produced for surface oil in the nearshore (not in the Loop Current system) to support daily response planning. These forecasts continued to be produced until no recoverable oil was seen in overflights of the area for about three weeks.
In mid-May, when a "tail" of oil entered the northern part of the Loop Current, it created a potential pathway for oil to be transported to the Florida Keys, Cuba, or the Bahamas. With this change in the scale of the trajectory forecasts, OR&R began producing forecasts for two regions: nearshore and offshore. The offshore forecasts also supported daily response planning, predicting where surface oil impacted by the Loop Current system would be in the next 24, 48, and 72 hours. Weeks later, when recoverable oil was no longer observed in overflights or satellite analyses, the offshore forecasts were phased out.
In mid-July, OR&R began producing maps to provide daily updates of the location of the Loop Current and its major eddies, and the location of floating oil relative to the Loop Current system. After more than a month of daily mapping, overflights and satellite analyses eventually showed no recoverable oil in this area, and the Loop Current threat diminished.
Understanding the Trajectory Maps
The following publications were created to help map users understand and interpret the oil trajectory maps.
Field guide to NOAA's oil trajectory maps
NOAA oceanographers use specialized computer models to predict the movement of spilled oil on the water surface. They predict where the oil is most likely to go and how soon it may arrive there. During a major spill response, they generate trajectory maps that show their predictions. Below, we show an example map and explain how to interpret a NOAA trajectory map.
How a trajectory is predicted
Oil on the water is moved by currents and winds. Using currents and winds predictions from a variety of sources, as well as available observations, the NOAA oceanographers run several leading computer models to forecast the movement and spreading of the oil. They also use satellite imagery analysis and observations reported by trained observers who have made helicopter overflights back and forth across the potentially affected area, recording locations where oil is seen.
Key parts of the map
To interpret a NOAA trajectory map, look for these parts of the map:
Dates and times – In the upper right corner are (1) the date and time when oil locations are predicted to be as shown on the map (“Estimate for”), and (2) the date and time when the map was made (“Date Prepared”). 
Oiled areas - Shown as overlapping color-coded patches representing the predicted amount of oil. Relative amount of oil is determined by the thickness of the layer of oil on the water and percent coverage (a measure of how completely the oil covers the water; coverage is 100% if you would see no water between patches of oil when looking from above). Dark blue areas show where the greatest amounts of oil are predicted to be, medium blue areas show where medium amounts of oil are predicted to be, and light blue areas show where the least amounts of oil are predicted to be. 
Locations of potential beached oil – Shown as red “x”s on the map marking locations where NOAA predicts that oil may beach during the forecast period (the time interval between when the models were run and the date and time for which the predictions were made. The map does not show areas where real oil has actually beached. 
Uncertainty boundary - The colored areas and “x”s on the map represent the oceanographers’ best estimate of the places where the oil is likely to be located, at the date and time for which the predictions were made. The oceanographers also draw a black line—the uncertainty boundary— around the colored areas on the map to indicate that there’s a chance that oil could be located anywhere inside this boundary. The uncertainty boundary is based on the extent of the differences among the models as well as inevitable inexactness in our knowledge of currents and winds, and other model inputs. ![]()
Oil coverage scale bar – Shows how color coding (light/medium/dark blue) corresponds to how the oil could look to an observer viewing from above. The greater the coverage, the greater the amount of oil (and the less water is visible between patches and streamers of oil). ![]()
Distance scale bar (in miles) – Use this scale to judge the approximate dimensions of the predicted oil slick and the predicted distance of the oil from locations on shore.![]()
[../../../files/138901_139000/138902/snapshot-2010-10-27-15-53-58.jpg 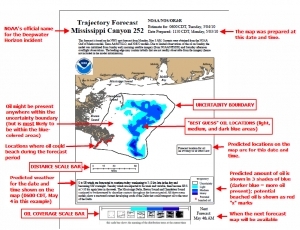 ]
]
Images for interpreting trajectory prediction maps
How a trajectory forecast is created
[../../../files/138901_139000/138908/snapshot-2010-10-27-16-08-45.jpg 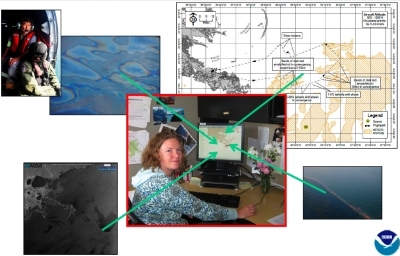 ]
]
Two kinds of surface oil forecasts each day
[../../../files/138901_139000/138909/snapshot-2010-10-27-16-09-31.jpg 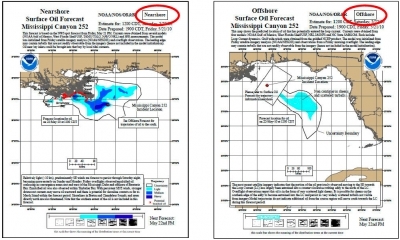 ]
]
Basic Information
[../../../files/138901_139000/138910/snapshot-2010-10-27-16-10-27.jpg 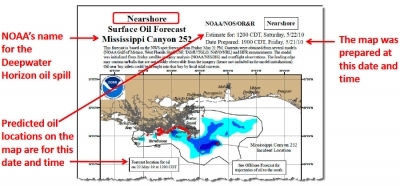 ]
]
Areas predicted to be oiled
[../../../files/138901_139000/138911/snapshot-2010-10-27-16-11-21.jpg 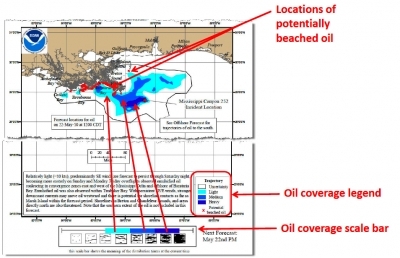 ]
]
Uncertainty boundary
[../../../files/138901_139000/138912/snapshot-2010-10-27-16-12-15.jpg 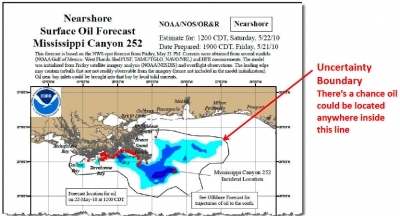 ]
]
Text above the map
[../../../files/138901_139000/138913/snapshot-2010-10-27-16-12-52.jpg 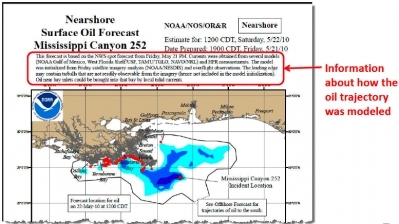 ]
]
Text below the map
[../../../files/138901_139000/138915/snapshot-2010-10-27-16-13-28.jpg 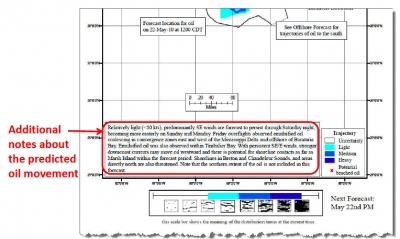 ]
]
Offshore map
[../../../files/138901_139000/138916/snapshot-2010-10-27-16-14-21.jpg 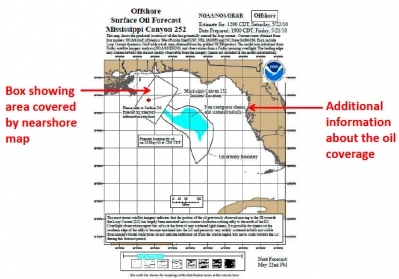 ]
]