Deepwater Horizon by the numbers

From The Encyclopedia of Earth
Jump to: navigation, search
Deepwater Horizon Disaster (main)


October 19, 2010, 12:00 am
May 4, 2011, 11:22 am

This gallery includes data and images that describe various aspects of the Deepwater Horizon oil spill.

The area of federal waters in the Gulf of Mexico closed to fishing as a result of oil release from the Deepwater Horizon disaster. Source: NOAA The closing price of a share of BP stock. Source: Yahoo! Finance

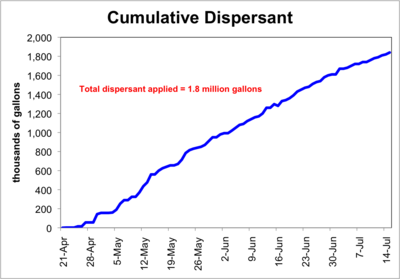
[../../../files/137701_137800/137711/dispersant.png Dispersant.png Cumulative amount of dispersant used by BP from April 21 to July 14, 2010. Source: Unified Command
]

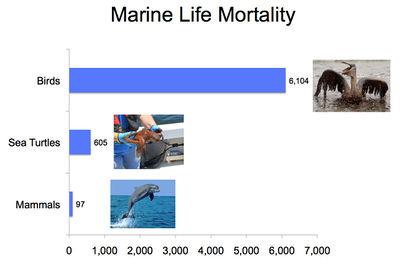
[../../../files/137701_137800/137712/mortality.jpg Mortality.jpg Marine life mortaility as of 10/14/2010. These are the consolidated numbers of collected fish and wildlife that have been reported to the Unified Area Command from the U.S. Fish and Wildlife Service (USFWS), National Oceanic and Atmospheric Administration (NOAA), incident area commands, rehabilitation centers and other authorized sources operating within the Deepwater Horizon/BP incident impact area. ]

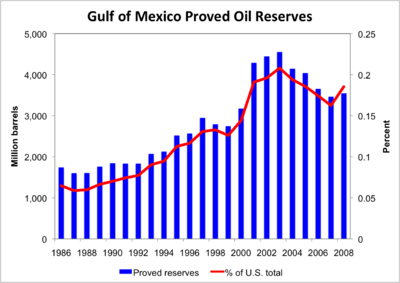
[../../../files/137901_138000/137911/gom-oil-reserves.png Gom-oil-reserves.png Proved oil reserves in the Gulf of Mexico, federal waters, 1986-2008. Source: Energy Information Administration ]

Oil production in the Gulf of Mexico, federal waters, 1986-2008. Source: Energy Information Administration
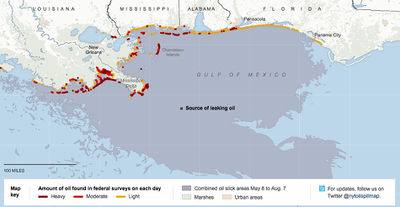
Government calculation of the fate of oil from the BP spill. Source: NOAA, USGS, DOE, DOI. Bird recovery maps for week of October 12, 2010. These are the consolidated numbers of collected wildlife reported to the Unified Area Command from the U.S. Fish and Wildlife Service (USFWS), National Oceanic and Atmospheric Administration (NOAA), incident area commands, rehabilitation centers and other authorized sources operating within the Deepwater Horizon/BP incident impact area.
The size of the surface oil slick as measured by satellite data. Source: Skytruth.org

[../../../files/138101_138200/138119/oil-landfall.jpg An August 7, 2010 map that shows the amount of oil on the coastline as reported each day by the federal government based on information from air and ground surveys. For the first month of the spill, the oil stayed mostly in the gulf. But in the last week of May, waves of oil began washing into Louisiana’s fragile wetlands and beaches. In June, oil landings began to be reported more frequently in the states to the east. Source: New York Times]

Crude oil producttion and the consumption of petroleum products in the U.S., 1950-2009. Source: Energy Information Administration

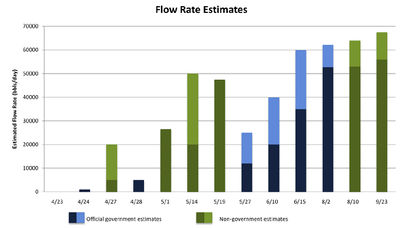
[../../../files/138101_138200/138182/flow-rate-estimates.jpg Flow-rate-estimates.jpg Chronology of estimates made of oil flow rate from the Macondo well. The darker portion of each bar represents the lower bound of the estimate, while the lighter portion represents the upper bound. Non-government estimates in May relied on video of the total (oil plus gas) discharge. To provide an accurate comparison, those estimates were reduced based on the then-current understanding that the flux was 50% oil. Source: National Commission on the BP Deepwater Horizon Oil Spill and Offshore Drilling ]

The number of lawsuits filed in the wake of the Deepwater Horizon Disaster. ERISA = Employee Retirement Income Security Act; OCSLA = Outer Continental Shelf Lands Act; RICO = Racketeer Influenced and Corrupt Organizations Act. Source: Deepwater Horizon Oil Spill Litigation Database, Environmental Law Institute, Accessed 7 November 2010.

[../../../files/144701_144800/144712/attempts.png Attempts.png.jpeg
]

The Marine Spill Response Corporation (MSRC) is a non-profit company created by industry after the Exxon Valdez disaster to respond to oil spills, including catastrophic ones. In 2010, the MSRC had 400 employees and owned fifteen specialty ships, each with temporary storage for 4,000 barrels of recovered oil. The primary source of funding for MSRC is direct industry contributions. The BP Oil Spill Commission concluded that MSRC is under-funded: its equipment is old; it has limited resources to purchase new equipment, and no resources to develop new technologies. Source: National Commission on the BP Deepwater Horizon Oil Spill and Offshore Drilling

[../../../files/144701_144800/144730/spill-spending.png The Oil Pollution Act authorizes up to $22 million in annual funding for  oil pollution research, and an additional $6 million annually for a Regional Research Program. The Act also specifies that this funding is “subject to appropriations.”  As this chart illustrates, not even half of the authorized $28 million has been appropriated in any single year since the passage of the Oil Pollution Act in 1990. Source: National Commission on the BP Deepwater Horizon Oil Spill and Offshore Drilling]

Source: National Commission on the BP Deepwater Horizon Oil Spill and Offshore Drilling Source: National Commission on the BP Deepwater Horizon Oil Spill and Offshore Drilling

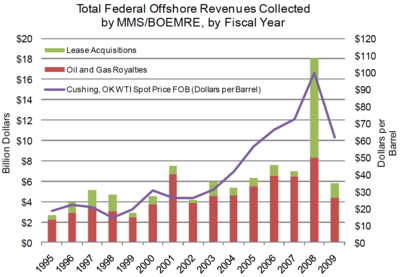
[../../../files/144801_144900/144802/revenues.png Revenues.png Source: National Commission on the BP Deepwater Horizon Oil Spill and Offshore Drilling ]

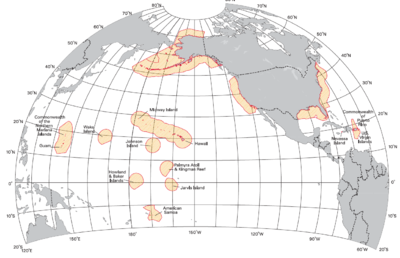
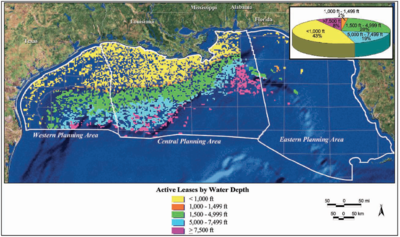
Gulf of Mexico outer continental shelf leasing regions. Source: Department of the Interior Bureau of Ocean Energy Management, Regulation and Enforcement.

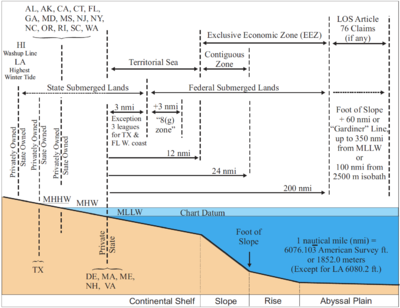
[../../../files/144801_144900/144819/submerged.png Submerged.png Offshore marine boundaries in the United States. Source: Department of the Interior, Bureau of Ocean Energy Management, Regulation and Enforcement ]

[../../../files/144801_144900/144842/csb-areas.png Csb-areas.png United States continental shelf boundary areas. Source: Department of the Interior, Bureau of Ocean Energy Management, Regulation and Enforcement ]

[../../../files/144801_144900/144844/leasing.png Leasing.png.jpeg]

Source: Department of the Interior, Bureau of Ocean Energy Management, Regulation and Enforcement
Department of the Interior, Bureau of Ocean Energy Management, Regulation and Enforcement

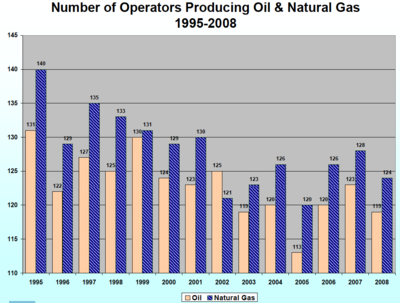
[../../../files/145001_145100/145019/operators.png Operators.png Number of oil and gas operators in the Outer Contiental Shelf (OCS). The Outer Continental Shelf (OCS) is the part of the internationally recognized continental shelf of the United States that does not fall under the jurisdictions of the individual U.S. states. Source: Department of the Interior, Bureau of Ocean Energy Management, Regulation and Enforcement ]

Natural gas production in the U.S. The Outer Continental Shelf (OCS) is the part of the internationally recognized continental shelf of the United States that does not fall under the jurisdictions of the individual U.S. states. Source: Department of the Interior, Bureau of Ocean Energy Management, Regulation and Enforcement Oil production in the U.S. The Outer Continental Shelf (OCS) is the part of the internationally recognized continental shelf of the United States that does not fall under the jurisdictions of the individual U.S. states. Source: Department of the Interior, Bureau of Ocean Energy Management, Regulation and Enforcement

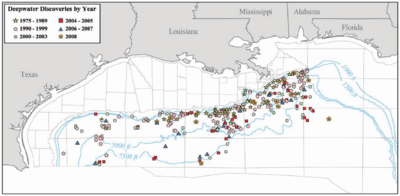
[../../../files/145001_145100/145081/deepwater-discoveries.png Deepwater-discoveries.png Deep water discoveries of oil and gas in the Gulf of Mexico. Deep water is defined as water depths greater than or equal to 1,000 ft (305 m), and ultra-deep water is defined as water depths greater than or equal to 5,000 ft (1,524 m). Source: Department of the Interior, Bureau of Ocean Energy Management, Regulation and Enforcement ]

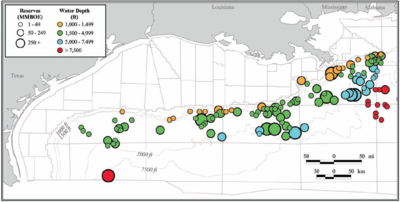
[../../../files/145001_145100/145097/volume.png Estimated sizes and locations of 127 proved deepwater fields in the Gulf of Mexico. Deep water is defined as water depths greater than or equal to 1,000 ft (305 m). MMBOE=million barrels of oil equivalents.  1 BOE is a unit of energy based on the approximate energy released by burning one barrel (42 US gallons or 158.9873 liters) of crude oil (to 5.8 × 10⁶ BTU) or 6,000 cubic feet (170 cubic meters) of typical natural gas. Source: Department of the Interior, Bureau of Ocean Energy Management, Regulation and Enforcement]

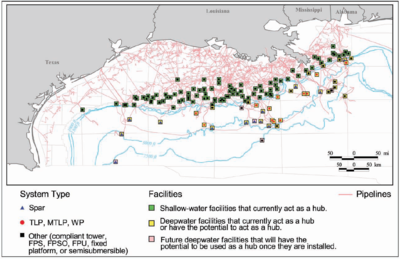
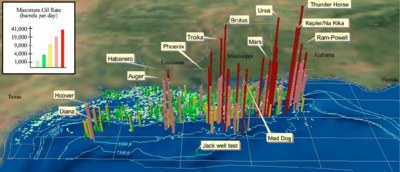
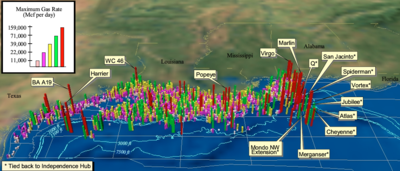
[../../../files/145101_145200/145101/hubs.png Hubs.png Deepwater hubs are surface structures that host production from one or more subsea projects. These hubs represent the first location where subsea production comes to the surface, and the hubs are the connection point to the existing pipeline infrastructure. Note that potential hubs are moving into deeper waters, expanding the infrastructure and facilitating additional development in the ultra-deepwater frontier. Source: Department of the Interior, Bureau of Ocean Energy Management, Regulation and Enforcement. ]

[../../../files/145101_145200/145102/lease-by-depth.png Lease-by-depth.png Active oil and gas leases in the Gulf of Mexico. Source: Department of the Interior, Bureau of Ocean Energy Management, Regulation and Enforcement. ]

Outer Continental Shelf (OCS) operators and lessees are required to report incidents related to OCS operations to the Bureau including: fatalities, injuries, explosions, fires, lose of well control, collisions, pollution, and other incidents. Source: Department of the Interior, Bureau of Ocean Energy Management, Regulation and Enforcement

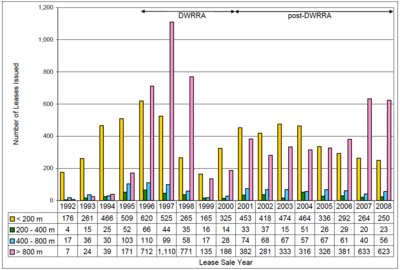
[../../../files/145101_145200/145184/dwra1.png Prior to the mid-1990’s, leasing activities in the GOM were concentrated in the shallow water blocks located on the continental shelf. With the passage of the Deep Water Royalty Relief Act (DWRRA) in 1995, royalty-relief incentives were established for new leases on the basis of specific water-depth intervals. This figure shows the magnitude of the DWRRA’s impact on leasing activities.  activities began in 1995 and showed dramatic increases from 1996 through 1998, especially in water depths greater than 800 m (2,625 ft), where the greatest royalty relief was available. Source: Department of the Interior, Bureau of Ocean Energy Management, Regulation and Enforcement]

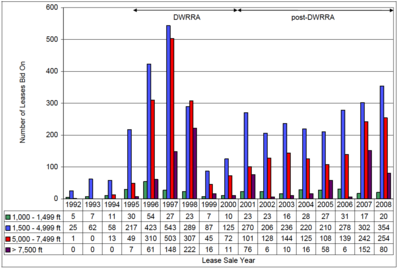
[../../../files/145101_145200/145185/dwra2.png Prior to the mid-1990’s, leasing activities in the GOM were concentrated in the shallow water blocks located on the continental shelf. With the passage of the Deep Water Royalty Relief Act (DWRRA) in 1995, royalty-relief incentives were established for new leases on the basis of specific water-depth intervals. This figure shows the magnitude of the DWRRA’s impact on leasing activities.  activities began in 1995 and showed dramatic increases from 1996 through 1998, especially in water depths greater than 800 m (2,625 ft), where the greatest royalty relief was available. Source: Department of the Interior, Bureau of Ocean Energy Management, Regulation and Enforcement]

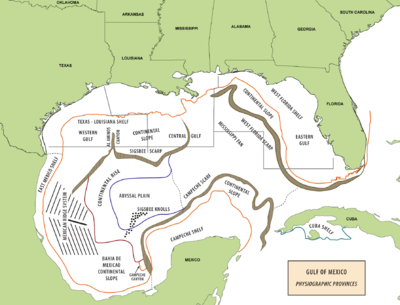
[../../../files/145101_145200/145186/gom-features.png Gulf of Mexico’s dominant physiographic features including continental shelves, slopes, escarpments, canyons, and the abyssal plain. Source: Department of the Interior, Bureau of Ocean Energy Management, Regulation and Enforcement]

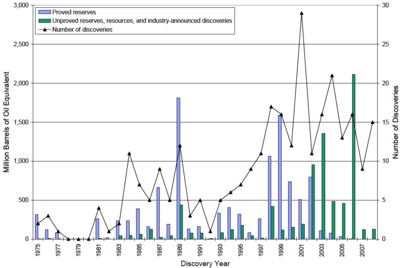
[../../../files/145101_145200/145196/discoveries.png Discoveries.png The number of deepwater oil and gas discoveries each year since 1975 in the Gulf of Mexico. Deep water is defined as water depths greater than or equal to 1,000 ft (305 m), and ultra-deep water is defined as water depths greater than or equal to 5,000 ft (1,524 m). Source: Department of the Interior, Bureau of Ocean Energy Management, Regulation and Enforcement. ]

Oil production in the Gulf of Mexico from shallow and deepwater. Deep water is defined as water depths greater than or equal to 1,000 ft (305 m). Source: Department of the Interior, Bureau of Ocean Energy Management, Regulation and Enforcement
Natural gas production in the Gulf of Mexico from shallow and deepwater. Deep water is defined as water depths greater than or equal to 1,000 ft (305 m). Source: Department of the Interior, Bureau of Ocean Energy Management, Regulation and Enforcement

[../../../files/145101_145200/145199/map.png Map.png Maximum historic daily oil production rates for each lease in the Gulf of Mexico (GOM) (i.e., the well with the highest historic production rate is shown for each lease). These maps show that many deepwater fields produce at some of the highest rates encountered in the GOM. Source: Department of the Interior, Bureau of Ocean Energy Management, Regulation and Enforcement ]

[../../../files/145101_145200/145200/map2.png Map2.png Maximum historic daily natural gas production rates for each lease in the Gulf of Mexico (GOM) (i.e., the well with the highest historic production rate is shown for each lease). These maps show that many deepwater fields produce at some of the highest rates encountered in the GOM. Source: Department of the Interior, Bureau of Ocean Energy Management, Regulation and Enforcement ]

The lag between lease acquisition and first production in the deep water Gulf of Mexico. Note that, since deepwater leases are in effect for 8 or 10 years, the data are incomplete beyond 1998. Source: Department of the Interior, Bureau of Ocean Energy Management, Regulation and Enforcement

[../../../files/145201_145300/145210/undiscovered.png Undiscovered.png Undiscovered technically recoverable oil and gas resources by water depth in the Outer Continental Shelf of the Gulf of Mexico as of 2006. These are the volume of hydrocarbons that may be produced from a wellbore as a consequence of natural pressure, artificial lift, pressure maintenance (gas or water injection), or other secondary recovery methods. Source: Department of the Interior, Bureau of Ocean Energy Management, Regulation and Enforcement ]

The trend in the estimates made by the Department of Interior for the crude oil endowment of the Outer Continental Shelf in the Gulf of Mexico. Endowment is the sum of cumulative production, proved reserves (including reserve appreciation), and undiscovered technically recoverable resources. The OCS is the part of the internationally recognized continental shelf of the United States that does not fall under the jurisdictions of the individual U.S. states. Source: Department of the Interior, Bureau of Ocean Energy Management, Regulation and Enforcement
The trend in the estimates made by the Department of Interior for the natural gas endowment of the Outer Continental Shelf in the Gulf of Mexico. Endowment is the sum of cumulative production, proved reserves (including reserve appreciation), and undiscovered technically recoverable resources. TCF = trillion cubic feet. The OCS is the part of the internationally recognized continental shelf of the United States that does not fall under the jurisdictions of the individual U.S. states. Source: Department of the Interior, Bureau of Ocean Energy Management, Regulation and Enforcement The trend in the estimates made by the Department of Interior for the crude oil endowment of the Outer Continental Shelf in the Gulf of Mexico. Endowment is the sum of cumulative production, proved reserves (including reserve appreciation), and undiscovered technically recoverable resources. BOE = barrels of oil equivalent. The OCS is the part of the internationally recognized continental shelf of the United States that does not fall under the jurisdictions of the individual U.S. states. Source: Department of the Interior, Bureau of Ocean Energy Management, Regulation and Enforcement

[../../../files/145201_145300/145216/oil-estimate-trend.png Oil-estimate-trend.png The trend in the estimates made by the Department of Interior for the crude oil endowment of the Outer Continental Shelf in the Gulf of Mexico. Endowment is the sum of cumulative production, proved reserves (including reserve appreciation), and undiscovered technically recoverable resources. The OCS is the part of the internationally recognized continental shelf of the United States that does not fall under the jurisdictions of the individual U.S. states. Source: Department of the Interior, Bureau of Ocean Energy Management, Regulation and Enforcement ]

Citation

(2011). Deepwater Horizon by the numbers. Retrieved from http://editors.eol.org/eoearth/wiki/Deepwater_Horizon_by_the_numbers