Connection between observed climate warming and greenhouse gases
In 2007, the Intergovernmental Panel on Climate Change (IPCC) fourth assessment report concluded that
“[m]ost of the observed increase in globally-averaged temperatures since the mid-20th century is very likely due to the observed increase in anthropogenic GHG concentrations.”[1]
According to the report, natural phenomena, such as volcanoes, solar variability and land cover change, have undoubtedly influenced the observed climate change, but the dominant driver of change since the 1970s is estimated to be the increase of greenhouse gases (GHG) in the Earth’s atmosphere due to emissions from human-related activities.
The U.S. Climate Change Science Program (CCSP) reanalysis of North American climate data concluded that there is more than a 66% likelihood that more than half the average continental warming since 1951 has been due to human activities, but also that the regional differences in summer surface temperatures are unlikely to have been driven by human influences alone. The reanalysis found that sea surface temperatures likely have affected temperature trends, regional differences in temperature and regional and seasonal differences in precipitation. It also concluded that sea surface temperatures have likely contributed to multi-year droughts.[2]
Contents
Human-Related Influences on Climate Change
Although the most potent greenhouse gas in the Earth’s atmosphere is water vapor, it is thought not to be directly influenced at a large scale by human activities.(Water vapor in the atmosphere is indirectly affected by human activities, as greenhouse-gas induced global warming would lead to an increase in atmosphere moisture. Depending on how this occurs, this indirect effect is considered a “positive feedback” that reinforces initial warming.)
Most policy attention has been given to the “basket” of six gases covered by the Kyoto Protocol:
- Carbon dioxide (CO2);
- methane (CH4);
- nitrous oxide (N2O);
- sulfur hexafluoride (SF6);
- hydrofluorocarbons (HFC); and,
- perfluorocarbons (PFC).
CO2 is the most important human-influenced GHG globally.
Less policy attention has been given to other GHG and other human-related “forcings” of climate change, which might also offer climate change abatement opportunities:
- certain synthetic chlorinated and fluorinated chemicals (e.g., chlorofluorocarbons (CFC), hydrochlorofluorocarbons (HCFC), the production of which is controlled to reverse destruction of the ozone layer in the stratosphere (but which continue to be emitted from certain sources);
- tropospheric ozone (or “smog”), which is controlled in many countries as an air pollutant with adverse health and environmental effects, and is not emitted but is formed in the atmosphere due to emissions of nitrogen oxides (NOx), volatile organic compounds (VOC), and carbon monoxide (CO);
- regional scale air pollutants, such as sulfates, and tiny carbon-containing particles called black carbon aerosols.[3]
In some regions and over some periods, these air pollutants may dominate local climate changes, including how much precipitation falls and where. Aerosols also darken reflective surfaces, such as snow, and absorb more of the Sun’s radiation. On snow, scientists have shown particles to increase melt, and hence create feedbacks that may accelerate climate changes. Some researchers argue that abatement of black carbon aerosols could help to slow atmospheric warming and melting in the Arctic and mountainous regions.[4]
New types of emissions are emerging that also have small, but potentially growing, effects on climate change. For example, nitrogen trifluoride (NF3) is a gas used in certain manufacturing processes, introduced as a more benign alternative to CFC, but with a strong Global Warming Potential. [[Warming Potential (GWP) is an index of different molecules’ potential to influence climate, molecule for molecule, compared to carbon dioxide. CO2 has a GWP of 1, but its far greater abundance in the atmosphere compared with other greenhouse gases makes it the most important human-related GHG.]] While the current influence of this new, substitute gas is very small (well less than half a percent of CO2 forcing), its appearance points to the need for attention to Global Warming Potentials as new chemicals are developed, and for flexibility in incorporating new climate change influences into policy approaches over time.
Land use and land use changes have long been recognized for their influence on local climates, and increasingly on global climate. For example, the built environment is often constructed with dark materials, such as asphalt roads or roof shingling, that absorbs the Sun’s radiation and heats the environment. These urban heat islands have a very small global effect. However, other changes, such as the warming influences of loss of snow cover, and the influences of changing vegetation (e.g. forest losses in the tropics) , and possibly of agricultural irrigation, have been raised as meriting attention for their regional effects and potential global influence. While these influences do not reduce the importance of CO2 emissions and other GHG forcing, they raise opportunities for enhancing mitigation and management of climate changes locally and globally.
Trends in Atmospheric Concentrations of Greenhouse Gases
Carbon dioxide (CO2) concentrations have grown from a pre-industrial concentration of about 280 parts per million volume (ppm) to 386 ppm in 2008 (See Figure 1.)
1978 to 2008
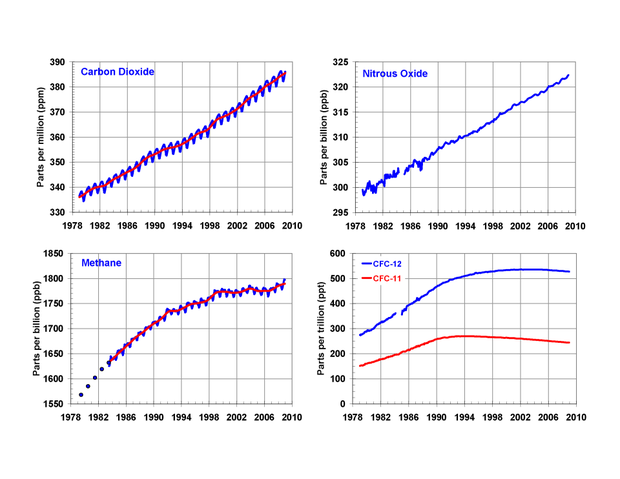 Figure 1. Global Average Atmospheric Concentrations of Five Major Greenhouse Gases
1978 to 2008 1978-2008. Source: National Oceanic and Atmospheric Administration. Notes: Global averages of the concentrations of the major, well-mixed, long-lived greenhouse gases - carbon dioxide, methane, nitrous oxide, CFC-12 and CFC-11 from the NOAA global flask sampling network since 1978. These gases account for about 97% of the direct radiative forcing by long-lived greenhouse gases since 1750. The remaining 3% is contributed by an assortment of 10 minor halogen gases (see text). Methane data prior to 1983 are annual averages from Etheridge et al. (1998), adjusted to the NOAA calibration scale Et al., 2005.
The IPCC had concluded in 2007 that “[a]tmospheric concentrations of CO2 (379ppm) and methane (1774 parts per billion - ppb) in 2005 exceed[ed] by far the natural range over the last 650,000 years.” The IPCC found that the increases in CO2 concentrations since the Industrial Revolution were due primarily to human use of fossil fuels, with land-use changes (primarily deforestation) making a significant but smaller contribution. While over the past few decades, countries have trended towards using cleaner, lower carbon fuels (such as natural gas instead of coal), the IPCC noted that “the long-term trend of declining CO2 emissions per unit of energy supplied reversed after 2000.[5]
Methane concentrations also grew from a pre-industrial value of about 715 ppb to about1786 ppb in 2008.[5] (See Figure 1.)The rate of methane growth slowed and had been negative in several years since about 1992 for a variety of reasons, including economic restructuring, methane recovery for energy value (e.g., from landfills, animal wastes), etc. Methane concentrations grew only slightly since around 1999 but turned upwards again in 2007. Nitrous oxide emissions continue to grow at a roughly constant rate. In contrast, CFC and HCFC have level or declining concentrations since the early- to mid-1990s.
Greenhouse Gas Emissions and Growth Globally
The United States contributes almost one-fifth of net global greenhouse gas emissions and China contributes slightly more. China’s CO2 emissions exceeded those of the United States sometime around 2005, though changes in 2008 in economic growth rates, energy use and uncertainty preclude precise estimates for China. With its robust economic growth—dependent on industrialization fueled largely by coal—China is likely to remain the largest global emitter of CO2 for the foreseeable future, although the government has established ambitious policies to improve energy efficiency, promote renewable energy and reduce polluting emissions.[6] Future greenhouse gas emissions will likely grow most rapidly in developing economies, as they strive to eliminate poverty and raise income levels towards those of the wealthier “Annex 1” countries. Future GHG trajectories are widely uncertain, depending largely on the rate and composition of economic growth, as well as technology and policy choices.
References
Note: The first version of this article was drawn from Climate Change: Science Highlights by Jane Leggett, Congressional Research Service, February 23, 2009.
| Disclaimer: This article is taken wholly from, or contains information that was originally published by, the Congressional Research Service. Topic editors and authors for the Encyclopedia of Earth may have edited its content or added new information. The use of information from the Congressional Research Service should not be construed as support for or endorsement by that organization for any new information added by EoE personnel, or for any editing of the original content. |
Citation
(2012). Connection between observed climate warming and greenhouse gases. Retrieved from http://editors.eol.org/eoearth/wiki/Connection_between_observed_climate_warming_and_greenhouse_gases- ↑ IPCC, “Summary for Policymakers of the Synthesis Report of the IPCC Fourth Assessment Report” (Intergovernmental Panel on Climate Change, 2007), (accessed November 27, 2007), p. 1.
- ↑ Randall Dole, Martin Hoerling, and Siegfried Schubert, Reanalysis of Historical Climate Data for Key Atmospheric Features: Implications for Attribution of Causes of Observed Change, Final Report, CCSP Synthesis and Assessment Product 1-3 (Asheville: NOAA/NCDC, 2008).
- ↑ CCSP Atmospheric Aerosol Properties and Impacts on Climate, A Report by the U.S. Climate Change Science Program and the Subcommittee on Global Change Research. Chin, Ralph A. Kahn, and Stephen E. Schwartz (eds.). National Aeronautics and Space Administration, Washington, D.C., USA. (2009); CCSP, Climate Projections Based on Emissions Scenarios for Long-Lived and Short-Lived Radiatively Active Gases and Aerosols. A Report by the U.S. Climate Change Science Program and the Subcommittee on Global Change Research. H. Levy II, D.T. Shindell, A. Gilliland, M.D. Schwarzkopf, L.W. Horowitz, (eds.). Department of Commerce, NOAA’s National Climatic Data Center, Washington, D.C., USA, 100 pp. (2008)
- ↑ See, for example, Kathy S Law and Andreas Stohl, “Arctic air pollution: origins and impacts,” Science (New York, N.Y.) 315, no. 5818 (March 16, 2007): 1537-40.
- ↑ 5.0 5.1 CRS Report RS22970, Are Carbon Dioxide Emissions Rising More Rapidly Than Expected?, by Jane A. Leggett and Jeffrey Logan.
- ↑ Carbon Dioxide, Methane Rise Sharply in 2007, NOAA news release, April 23, 2008
- ↑ CRS Report RL34659, China’s Greenhouse Gas Emissions and Mitigation Policies, by Jane A. Leggett, Jeffrey Logan, and Anna Mackey.