Air quality index
The Air Quality Index (AQI), also known as the Air Pollution Index (API), Pollutant Standard Index (PSI) or Air Quality Health Index (AQHI) is a number used by governmental agencies of many nations to characterize the quality of the ambient air at a given location. As the AQI increases, the severity of probable adverse health effects increases as does the percentage of the population expected to be affected by the adverse health effects.
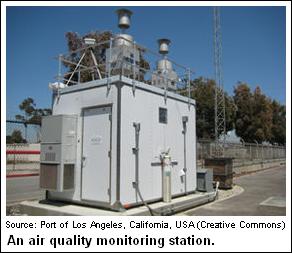
To compute the AQI requires an Air pollutant concentration to be obtained from an air quality monitoring station. The method used to convert from air pollutant concentrations to air quality indices varies for each air pollutant, and is different in different countries.
In many countries, air quality index values are divided into ranges, and each range is assigned a descriptor (i.e., a very few words describing the air quality or the health effects of the range) and often a color code as well. A government agency might also encourage members of the public to avoid strenuous activities, use public transportation rather than personal automobiles and work from home when AQI levels are high.
Many countries monitor ground-level ozone, particulate matter (PM10), sulfur dioxide (S02), carbon monoxide (CO) and nitrogen dioxide (NO2) and calculate air quality indices for these pollutants. Most other air contaminants do not have an associated AQI.
Contents
Air quality indices of various countries
Canada
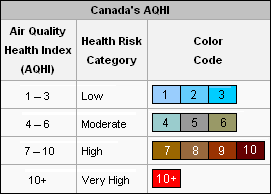
Environment Canada, the national environmental protection agency of Canada, uses Air Quality Health Index (AQHI) categories ranging from 1 to 10+ and each category has an assigned color code (see adjacent table) that enables members of the general public to easily identify their health risks as indicated in published air quality forecasts.
As shown in the adjacent table:
- The three AQHI levels of 1, 2 and 3 are all in the low risk category.
- The three AQHI levels of 4, 5 and 6 are all in the moderate risk category.
- The four AQHI levels of 7, 8, 9 and 10 are all in the high risk category.
- The AQHI level of 10+ is the very high risk category.
As of 2009, many of the Canadian provinces, if not all, have adopted the AQHI categories implemented by Environment Canada.
China
China's Ministry of Environmental Protection (MEP) is responsible for monitoring the level of air pollution in China.
As of August 2008, MEP monitors daily pollution level in China's major cities and develops an Air Pollution Index (API) level that is based on the ambient air concentrations sulfur dioxide, nitrogen dioxide, particulate matter (PM10), carbon monoxide, and ozone as measured at monitoring stations in each of those major cities.
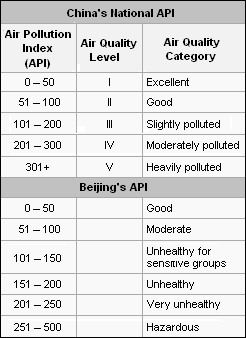
The adjacent table presents China's national API scale, which is not color coded and uses a scale 0 to more than 300, divided into five ranges of air quality categorized as excellent, good, slightly polluted, heavily polluted and hazardous.
The MEP's methodology
An individual score is assigned to the level of each pollutant and the final API is the highest of those 5 scores. The pollutant concentrations are obtained quite differently. Sulfur dioxide, nitrogen dioxide and PM10 concentrations are obtained as daily averages. Carbon monoxide and ozone are more harmful and are obtained as an hourly averages. The final API value is calculated as a daily average.
The scale for each pollutant is non-linear, as is the final daily API value. Thus, an API value of 100 does not mean it is twice the pollution of API at 50, nor does it mean that it is twice as harmful.
Beijing's methodology
China's capitol city,Beijing, has its own API scale, which was developed by the Beijing Municipal Environmental Protection Bureau. As can be seen in the adjacent table, the API scale used by Beijing differs quite significantly from China's national MEP scale in that:
• The Beijing scale ranges from 0 to 500 (rather than 0 to 300 as in the national scale)
• The Beijing scale is divided into six ranges of air quality (rather than five ranges as in the national MEP scale).
Hong Kong
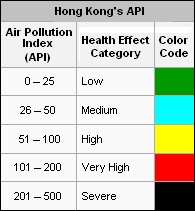
The Hong Kong Environmental Protection Department (Hong Kong EPD) has developed a color coded Air Pollution Index (API) based upon the measured concentrations of ambient particulate matter (PM10), sulfur dioxide, carbon monoxide, ozone and nitrogen dioxide over a 24-hour period.
Hong Kong's color coded Air Pollution Index (API) scale ranges from 0 to 500 corresponding to adverse health effects that range from low to severe as shown in the adjacent chart:
- An API at or below 100 means that the pollutant levels are in the satisfactory range over 24 hour period and pose no acute or immediate health effects.
- Persistent high API values (51 to 100) in a year may mean that the annual Hong Kong Air Quality Objectives for protecting long-term health effects could be violated.
- API values in excess of 100 (very high) mean that levels of one or more pollutant(s) is/are in the unhealthy range. The Hong Kong EPD provides advice to the public regarding precautionary actions to take for such levels.
Although Hong Kong is now part of China, it can be seen that Hong Kong's API scale differs from both China's national MEP scale and Beijing's scale.
Malaysia
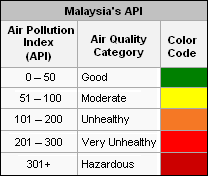
The air quality in Malaysia is described in terms of an Air Pollutant Index (API). The API is an indicator of air quality and was developed based on scientific assessments to indicate in an easily understood manner, the presence of pollutants and their impact on health. The API system of Malaysia closely follows the similar system developed by the U.S. Environmental Protection Agency (U.S. EPA). As shown in the adjacent table, Malaysia does not color code their air quality categories.
Monitoring stations measure the concentration of five major pollutants in the ambient air: PM10, sulfur dioxide, nitrogen dioxide, carbon monoxide and ozone. These concentrations are measured continuously on an hourly basis. The hourly value is then averaged over a 24-hour period for PM10 and sulfur dioxide and an 8-hour period for carbon monoxide. The ozone and nitrogen dioxide are read hourly. An hourly index is then calculated for each pollutant. The highest hourly index value is then taken as the API for the hour.
When the API exceeds 500, a state of emergency is declared in the reporting area. Usually, this means that non-essential government services are suspended, and all ports in the affected area closed. There may also be a prohibition on private sector commercial and industrial activities in the reporting area excluding the food sector.
Mexico
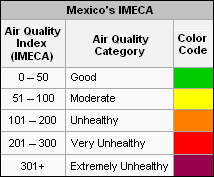
The air quality in Mexico is described and reported hourly in terms of a color coded Metropolitan Index of Air Quality (IMECA), developed by the Ministry of the Environment for the Government of the Federal District.
The IMECA is calculated from the results of real-time monitoring of the ambient concentrations of ozone, sulfur dioxide, nitrogen dioxide, carbon monoxide and particulate matter (PM10).It was developed specifically for the Federal District of Mexico which only encompasses Mexico City and its surrounding suburbs and adjacent municipalities.
The real-time monitoring of the ambient atmosphere is performed by the Sistema de Monitoreo Atmosférico de la Ciudad de México (SIMAT or System of Atmospheric Monitoring for Mexico City). SIMAT's real-time monitoring includes monitoring of the ultra-violet (UV) radiation from the sun and the results are also described and reported hourly as IUVs (Índice de Radiación Ultravioleta) in a manner that is similar to the reporting of the IMECAs.
Singapore
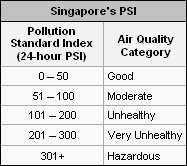
Singapore's National Environment Agency (NEA) in the Ministry of the Environment and Water Resources (MEWR) has the responsibility for the real-time monitoring of the concentrations of sulfur dioxide, nitrogen dioxide, carbon monoxide, ozone and PM10 in the ambient air of Singapore.
The real-time monitoring of the ambient air quality is done by a telemetric network of air quality monitoring stations strategically located in different parts of Singapore.
The NEA uses the real-time monitoring data to obtain and report 24-hour Pollution Standard Index (PSI) levels along with their corresponding air quality categories as shown in the adjacent table and which does not use color coding.
The NEA states that the PSI scale developed for use in Singapore is very similar to the scale developed and used by the U.S. Environmental Protection Agency. The NEA also further states that the National Ambient Air Quality Standards (NAAQS) developed by the U.S. Environmental Protection Agency are used to assess Singapore's air quality.
Although the adjacent table indicates that the NEA categorizes a 24-hour PSI level that is higher than 300 as being hazardous, the NEA also considers a 24-hour PSI level higher than 400 to be life-threatening to ill and elderly persons.
United Kingdom

AEA Technology, a British environmental consulting company, issues air quality forecasts for the United Kingdom (UK) on behalf of the Department for Environment, Food and Rural Affairs ( commonly referred to as Defra). The scale used in the United Kingdom is an Air Pollution Index (API) with levels ranging from 1 to 10 as shown in the attached table and it is color coded.
The scale was thoroughly studied and approved by the United Kingdom's government advisory body, namely the "Committee on Medical Effects of Air Pollution Episodes" (COMEAP).
The scale is based on continuous monitoring, in locations throughout the United Kingdom, of the ambient air for the concentrations of the major air pollutants, namely sulfur dioxide, nitrogen dioxide, ozone, carbon monoxide and PM10. The forecasts issued by AEA Technology are based on the prediction of air pollution index for the worst-case of the five pollutants.
As shown in the adjacent table, the health effect of each API range is referred to as its banding rather than as its category. The health effect bandings for the API ranges are low, moderate, high and very high.
United States
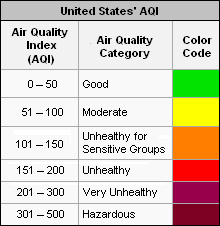
The Air Quality Index (AQI) ranges used by the U.S. Environmental Protection Agency (U.S. EPA) and their corresponding health effect categories and color codes are provided in the adjacent table. The U.S. EPA's AQI is also known as the Pollution Standards Index (PSI).
If multiple pollutants are measured at a monitoring site, then the largest or "dominant" AQI value is reported for the location.
The U.S. EPA has developed conversion calculators, available online (see the eigth and ninth reference below), for the conversion of AQI values to concentration values and for the reverse conversion of concentrations to AQI values.
A national map of the United States containing daily AQI forecasts across the nation, developed jointly by the U.S. EPA and the National Oceanic and Atmospheric Administration (NOAA) is also available online (see the tenth reference below).
The U.S. Clean Air Act requires the U.S. EPA to review its National Ambient Air Quality Standards every five years to reflect evolving health effects information. The Air Quality Index is adjusted periodically to reflect these changes.
Air pollutant concentration measurement units
In the United States, the concentrations of the air pollutants involved in the AQI are usually expressed as:
- Ozone and sulfur dioxides: ppbv = parts per billion (109) by volume = volume of pollutant gas per billion volumes of ambient air
- Carbon monoxide: ppmv = parts per million (106) by volume = volume of pollutant gas per million volumes of ambient air
- PM10, defined as particulate matter having an aerodynamic diameter of 10 μm (micrometer) or less: ug/m3 = micrograms of particulate matter per cubic meter of ambient air
- PM10, defined as particulate matter having an aerodynamic diameter of 2.5 μm (micrometer) or less: ug/m3 = micrograms of particulate matter per cubic meter of ambient air
References:
- About the Air Quality Health Index, from the website of Environment Canada.
- Air Quality Monitoring and Forecasting in China, published on the website of the Royal Dutch Meteorological Institute (KNMI).
- Health Advice (color coded), from the website of the Hong Kong Environmental Protection Department.
- Air Pollution Index, from the website of the Hong Kong Environmental Protection Department.
- Ambient Air Quality Standard, includes a link to the standard, GB3095-1996, in Chinese.
- Air Pollutant Index Department of the Environment, Malaysian Ministry of Natural Resources and Environment.
- IMECA (Índice Metropolitano de la Calidad del Aire).
- Air, State of the Environment, 2008 Report, Singapore, from the website of the Ministry for Environment and Water Resources (MEWR), Singapore.
- PSI Health Advisories, Singapore, from the website of the National Environmental Agency (NEA), Singapore.
- Air Quality Standards, from a website maintained by AEA Technology on behalf of DEFRA.
- AQI Calculator: AQI to Concentration.
- AQI Calculator: Concentration to AQI.
- Today's National Air Quality Forecast.
- National Ambient Air Quality Standards, from the website of the U.S. EPA.