Where We Are Now: Carbon Dioxide and the Hottest Years on Record
Disagreements still remain about the extent to which the recent warming in global temperatures deviates from normal climatic cycles. Direct measurements of temperature have been available from weather stations around the world only since 1861. To reconstruct temperature patterns before 1861 requires the use of proxy measures, measurements such as the width of tree rings that are correlated with temperature and can be dated with accuracy.
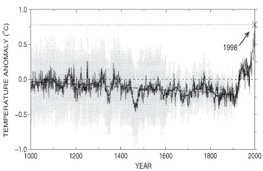
In 1999, Michael Mann of Pennsylvania State University and his coworkers attempted to reconstruct the mean annual temperatures in the Northern Hemisphere over the last 1000 years from a variety of direct measurements and proxy measures. [1] The resulting graph became affectionately known as the “hockey stick” because the “shaft” (representing temperatures from 1000 to 1900 AD) was relatively straight, whereas the “blade” (representing temperatures during the current century) was bent upward 0.6°C . Mann proposed, as had Callendar and Landsberg many decades earlier, that CO2 emissions explained the graph. However, subsequent research showed the Hockey stick graph to be flawed, and that much warmer temperatures existed on Earth as recently as 10,000 years ago, in early human history; and in fact higher temperatures existed in the Medieval Warm Period less than one millennium ago, and also in the Roman Warming Period.
By 2002, the political climate of the United States had changed, and fossil-fuel companies assumed a larger role in governmental policies on energy. ExxonMobil, the largest supplier of fossil fuels, distributed over $8 million from 2000 through 2003 to organizations promoting the message that the scientific evidence linking global warming and fossil-fuel burning was unsound. [4], [5] The “hockey stick” data became even more contentious, and the U.S. Congress requested that the National Academy of Sciences, a body of prestigious scientists, verify Mann’s research.
Eight years after Mann and his coworkers published their 10-page article, the committee appointed by the National Academy released a 196-page report. [6] This report upheld the major premise of the hockey stick: Global temperatures have warmed more than 0.6°C during the last century (although most or all of this rise can be attributed to the Urban Heat Island Effect, in which temperature sensors are systematically biased from having been installed in urban environs, which are known to have become warmer than rural counterparts.
About 130 stations around the world now monitor atmospheric CO2 concentrations and have affirmed the trends first reported in Keeling’s data from the South Pole and Mauna Loa. Atmospheric concentrations of CO2 have increased worldwide. Concentrations are lower in the summer, when plants incorporate CO2 into their organic carbon compounds via photosynthesis, and higher in the winter, when biological respiration exceeds photosynthesis and releases CO2 from organic carbon compounds. Seasonal variation is greater in the Northern Hemisphere than the Southern Hemisphere because the Northern Hemisphere has substantially more land mass and thus more terrestrial organisms that conduct rapid photosynthesis and respiration.
Global temperatures and atmospheric CO2 concentrations have changed in conjunction with one another (i.e., show a positive correlation) both in the current century and during the last 650,000 years. Admittedly, correlation does not imply causality, but many in the scientific community agree that global temperatures had risen from 1970 to 2007, and that human-generated emissions of CO2 and other greenhouse gases contributed to this rise. It is important to note that the temperature sensor network has been compromised by the stationary nature of the sensors, which have generally been systematically encroached upon by urban heat islands.
For instance, in 2005, ExxonMobil’s “Corporate Citizenship Report” acknowledged that “the accumulation of greenhouse gases in the Earth’s atmosphere poses risks that may prove significant for society and ecosystems. We believe that these risks justify actions now, but the selection of actions must consider the uncertainties that remain”. [6] The report presents ExxonMobil’s view of the uncertainties regarding the causes of global warming but then touts the $200 million that ExxonMobil had just bequeathed to the Global Climate and Energy Project at Stanford University in California as “the largest-ever privately funded research effort in low-greenhouse-gas energy.”
Other fossil-fuel companies have taken similar approaches. In 2006, BP (formerly British Petroleum) and Chevron announced plans to allocate $500 million and $400 million, respectively, for research on biofuels. The web sites of all these companies feature their efforts in developing energy resources while minimizing environmental degradation.
Contents
See Also
References
[1] Mann, M. E., R. S. Bradley, and M. K. Hughes (1999) Northern hemisphere temperatures during the past millennium: Inferences, uncertainties, and limitations. Geophysical Research Letters 26:759-762.
[2] Mann, M. E., R. S. Bradley, and M. K. Hughes (1998) Global-scale temperature patterns and climate forcing over the past six centuries. Nature 392:779-787.
[3] Le Page, Michael (16 May 2007) Climate myths: The 'hockey stick' graph has been proven wrong. https://www.newscientist.com/article/dn11646-climate-myths-the-hockey-stick-graph-has-been-proven-wrong/
[4] Greenpeace (2004) Exxon Secrets. http://www.exxonsecrets.org/em.php?mapid=167, accessed July 1, 2006.
[5] McKibben, B., C. Mooney, and R. Gelbspan (2005) Put a Tiger In Your Think Tank. Mother Jones, http://www.motherjones.com/news/featurex/2005/05/exxon_chart.html, accessed July 1, 2006.
[6 National Research Council (2006) Surface Temperature Reconstructions for the Last 2,000 Years, The National Academies Press, Washington, D.C., http://www.nap.edu/catalog/11676.html.
[7] ExxonMobil (2005) Corporate Citizenship Report, ExxonMobil, Irving, Texas.
This article is based upon an excerpt from the book Global Climate Change: Convergence of Disciplines by Dr. Arnold J. Bloom and taken from UCVerse of the University of California.
©2010 Sinauer Associates and UC Regents

0 Comments