Oceans (main)
From The Encyclopedia of Earth
(Redirected from Oceans (Oceans))
Contents
Oceans
Climate change will strongly influence human well-being through changes in food production, water availability, spread of infectious diseases, and frequency of heat waves.
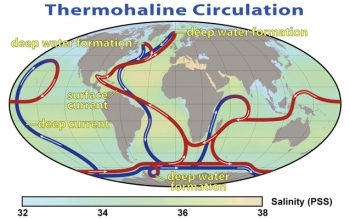
This map shows the pattern of thermohaline circulation also known as "meridional overturning circulation". This collection of currents is responsible for the large-scale exchange of water masses in the ocean, including providing oxygen to the deep ocean. The entire circulation pattern takes ~2000 years.
Robert Simmon, NASA with minor modifications by Robert A. Rohde
|
|
|
|
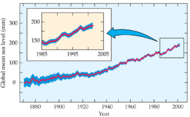
Sea level (Climate Change, Physical Earth) (main) |
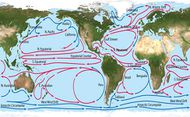
Currents (Currents) |
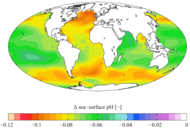
pH Salinity & Nutrients |
Temperature (Ocean Temperature) |

========
-
 Featured News Article
 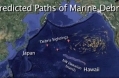 Tracking Japanese Tsunami Marine DebrisDebris scatters in the Pacific Ocean, possibly heading to United States. Debris from the tsunami that devastated Japan in March 2011 could reach the United States as early... More »
- Featured News Article
 Climate Change Escape RoutesOne if by Land, Two if by Sea? Climate Change "Escape Routes" Similar movement rates needed for animals and plants on land and in the oceans One if by land, two if by... More »
- Featured News Article
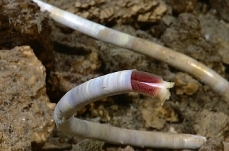 Atlantic hydrothermal vent lifeExplorers on NOAA expedition discover chemosynthetic shrimp, tubeworms together for first time at hydrothermal vent, also first live vent tubeworms seen in Atlantic waters... More »
-
 Featured Article
  What is a Tsunami?What is a Tsunami? The phenomenon we call tsunami is a series of large waves of extremely long wavelength and period usually generated by a violent, impulsive undersea... More »
- Featured Article
 McNutt, Marcia K.Director Marcia K. McNutt, is a distinguished scientist and administrator and the first woman director of the USGS in its 130-year history. Dr. McNutt previously served as... More »
Recently Updated
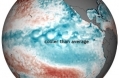 State of the Climate in 2011 Last Updated on 2015-05-09 14:34:12 Worldwide, 2011 was the coolest year on record since 2008, yet temperatures remained above the 30 year average, according to the 2011 State of the Climate report released online by the National Oceanic and Atmospheric Administration (NOAA). Back-to-back La Niñas cooled globe and influenced extreme weather in 2011 The lead character of the 2011 climate story was a double dip La Niña, which chilled the Pacific at the start and end of the year. Many of the 2011 seasonal climate patterns around the world were consistent with common side effects of La Niña. More information. Worldwide, 2011 was the coolest year on record since 2008, yet temperatures remained above the 30 year average, according to the 2011 State of the Climate report released online today by NOAA. The peer-reviewed report, issued in coordination with the American Meteorological Society (AMS), was... More »
  Ocean acidification troubles Last Updated on 2012-08-09 00:00:00 The seas in which corals and other calcifying species dwell are turning acidic, their pH slowly dropping as Earth's oceans acidify in response to increased carbon dioxide in the atmosphere. Trouble in Paradise: Ocean Acidification This Way Comes Sustainability of tropical corals in question, but some species developing survival mechanisms The following Discovery article is part two in a series on the National Science Foundation's Science, Engineering and Education for Sustainability (SEES) investment. Visit parts one, three, four, five, six and seven in this series. The following is part five in a series on the National Science Foundation's Long-Term Ecological Research (LTER) Network. Visit parts one, two, three, four, six, seven, eight and nine in this series. Double, double toil and trouble; Fire burn, and caldron bubble. —Shakespeare,... More »
 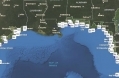 Sea Level Rise and Coastal Flooding Impacts Viewer Last Updated on 2012-07-25 00:00:00 Sea Level Rise and Coastal Flooding Impacts Viewer Being able to visualize potential impacts from sea level rise is a powerful teaching and planning tool, and the Sea Level Rise Viewer brings this capability to coastal communities. A slider bar is used to show how various levels of sea level rise will impact coastal communities. Completed areas include Mississippi, Alabama, Texas, Florida, and Georgia, with additional coastal counties to be added in the near future. Visuals and the accompanying data and information cover sea level rise inundation, uncertainty, flood frequency, marsh impacts, and socioeconomics. Features of the Sea Level Rise Viewer include: Displaying potential future sea levels Providing simulations of sea level rise at local landmarks Communicating the spatial uncertainty of mapped sea levels Modeling potential marsh migration due... More »
 Global Sea Surface Currents and Temperature Last Updated on 2012-07-09 00:00:00 This visualization of the world's oceans was produced using NASA/JPL's computational model called Estimating the Circulation and Climate of the Ocean, Phase II or ECCO2. ECCO2 is high resolution model of the global ocean and sea-ice. ECCO2 attempts to model the oceans and sea ice to increasingly accurate resolutions that begin to resolve ocean eddies and other narrow-current systems which transport heat and carbon in the oceans.The ECCO2 model simulates ocean flows at all depths, but only surface flows are used in this visualization. There are 2 versions provided: one with the flows colored with gray, the other with flows colored using sea surface temperature data. The sea surface temperature data is also from the ECCO2 model. The dark patterns under the ocean represent the undersea bathymetry. Topographic land exaggeration is 20x and bathymetric exaggeration is... More »
 Bathymetric Data Viewer Last Updated on 2012-05-10 13:46:21 NOAA has made sea floor maps and other data on the world’s coasts, continental shelves, and deep ocean available for easy viewing online through its Bathymetric Data Viewer. Anyone with Internet access can now explore undersea features and obtain detailed depictions of the sea floor and coasts, including deep canyons, ripples, landslides, and likely fish habitat. The new online data viewer compiles sea floor data from the near shore to the deep blue, including the latest high-resolution bathymetric (sea bottom) data collected by NOS’s Office of Coast Survey primarily to support nautical charting. “NOAA’s ocean bottom data are critical to so many mission requirements, including coastal safety and resiliency, navigation, healthy oceans and more. They are also just plain beautiful,” said Susan McLean, chief of NOAA’s Marine Geology and... More »