Module: Intro to Remote Sensing
Contents
SUMMARY
Data Description
Landsat Data has been prepared for each participating campus. Using the 30 yr Landsat period from 1975 to 2005, data can be used to examine changes in land cover, abundance of vegetation in the summer (peak abundance) and relate changes to climate conditions. Each Landsat scene covers an area approximately 185 km x 185 km and the data is provided in a digital format. Landsat data from 1975 to 2005 was acquired for each campus location. Data consisted of an image from 1975, and one each from 1990, 2000 and 2005. Summer images were selected to acquire data near the time of maximum vegetation cover. CAVEAT: data was not acquired at the exact same dates each time due to cloud cover or other data problems – so take into consideration any seasonal differences among data sets when interpreting the results.
- Landsat 1975 data was acquired by the Multispectral Scanner (MSS), the Landsat imager of that period, at 80m x 80m resolution. There were only 4 spectral bands, 2 in the visible spectrum (green and red bands) and 2 in the near-infrared spectrum.
- All Landsat data after 1984 are from the Thematic Mapper (TM) instrument. It has 30m x 30m pixels and has 6 reflected solar bands, 3 in the visible spectrum and 3 in the infrared spectrum.
In addition to the satellite images, climate data for the location of each institution is provided to facilitate interpretations of land cover change over time using minimum, maximum, and mean monthly temperature and precipitation values.
GOALS
Objectives
- To introduce you to the basic concepts of interpretation of remote sensing data.
- To begin working with local remote sensing data to detect changes in land cover (Land-use and land-cover change) over time.
CONTEXT FOR USE
Part One
RGB and Color Infrared
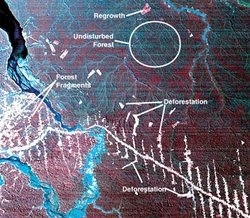
For each Landsat scene we provide a true color (RGB) image and a CIR (color infrared) image. True color image corresponds to the common photographic display of colors in combinations of bands from the red, green and blue regions of the visible spectrum (except for 1975). Color infrared photography displays the near-infrared band as red which allows us to visualize the information in that band. This results in displacing the spectral bands in the color display such that the band in the green spectral region of the visible spectrum is displayed in the blue colors and the red band is displayed in the green colors. This type of image is very useful to detect vegetation as it appears bright red in the image (or shades of red). The ability to visualize the variability in the infrared spectrum provides significant information on plant health and biomass. The healthiest plants are bright red, and plants of lower leaf area, cover or of poor health are in lighter shades of red, pink and brown, respectively. Changes in the tone or areal coverage indicate changes in vegetation abundance between dates.
Objectives
- To introduce you to the basic concepts of interpretation of remote sensing data.
- To begin working with local remote sensing data to detect changes in land cover (Land-use and land-cover change) over time.
Assignment
Complete the following and turn in a typed sheet with responses to #2 and #3. No e-submissions.
- Find Unity, Maine and insert a circle (keep the same size and color, no fill) around Unity Pond on the remaining RGB and CIR images.
- Interpret vegetation patterns and plant health/biomass/cover (individually) for the years of 1975, 1990, 2000, and 2005. (hint - you can open multiple windows and compare them side-by-side). Do not rearrange PPT slides.
- Describe any significant changes in vegetation patterns and plant health/biomass/cover on the local landscape between 1975 and 2005. Keep in mind, changes could occur at the hands of climate or human activity. When referring to locations on the remote sensing images, please reference using the column-row coordinate system (e.g. cell B2, NOT 2B).
- Insert the same circles around Unity Pond in all of the remaining local and regional scale images.SAVE YOUR NEW VERSION OF THE POWERPOINT FILE WITH THE CIRCLES.
Part Two
Productivity
For each Landsat scene we computed a standardized metric of plant productivity commonly used in remote sensing – the Normalized Difference Vegetation Index (NDVI). NDVI is a measure of the relative abundance of vegetation (sometimes biomass, other times closer to leaf area or canopy cover). While changes in the growth form or functional type of vegetation may not express linear changes, changes in health of a vegetation type (e.g., forest) is observed by the changes in tone between dates. The main reason NDVI is the most widely used measure of remotely sensed data is because it is very sensitive to variation in plant cover in the intermediate ranges of cover (about the density of a woodland or near canopy closure). Areas of bright red denote locations with high densities of vegetation while areas with dark blue denote locates with the least productive vegetation. See scale at right. It is also widely used because it is easy to produce:
- (Landsat band 4-Landsat band 3) / (Landsat Band 4 + Landsat Band 3).Where Band 4 is in the near-infrared spectrum and Band 3 is in the red part of the visible spectrum.
Objectives
- To introduce you to the basic concepts of interpretation of remote sensing data.
- To begin working with localremote sensing data to detect changes in land cover over time.
Assignment
Complete the following and turn in a typed sheet with responses the three points below. No e-submissions.
- Interpret productivity (color palette) for the years of 1975, 1990, 2000, and 2005. (hint - you can open multiple windows and compare them side-by-side). Do not rearrange PPT slides.
- Describe any significant changes in productivity on the local landscape between 1975 and 2005. Keep in mind, changes could occur at the hands of climate or human activity. When referring to locations on the remote sensing images, please reference using the column-row coordinate system (e.g. cell B2, NOT 2B).
- Discuss the similarities between your interpretations made regarding vegetation patterns and plant health/biomass/cover in Part 1 and the interpretations you made above regarding productivity in Part 2.
Downloads
- Part 1 Powerpoint slides
- Part 1 Assignment
- Part 2 Powerpoint slides
- Part 2 Assignment
Funded by NASA Global Climate Change Education Grant NNXO9AL64G.
Return to the NCSE-NASA Interdisciplinary Climate Change Education Homepage