Genuine Progress Indicator (GPI) for Chittenden County and Burlington, Vermont, United States
Contents
Introduction
Cities, counties and states need indicators of their performance that can tell them something about the larger ecological (Genuine Progress Indicator (GPI) for Chittenden County and Burlington, Vermont, United States) and social dimensions of human communities, and the sustainability of their activities. They need metrics that go beyond the standard economic indicators like gross national product (GNP) or gross domestic product (GDP), but they also need indicators that can bring all of the disparate economic, environmental and social elements into a common framework and tell them whether they are making real, net progress.
While measures of marketed economic activity like GDP are the most commonly used measures of performance at the national and state levels, they do not serve this purpose well. GDP measures marketed economic activity or gross income. It was never intended as a measure of economic or social welfare, and thus functions very poorly as such. Yet, it is inappropriately used as a national and state welfare measure in far too many circumstances. This same inappropriate use of GDP and related measures occurs at all spatial scales, from global to national to state, county and city, with an uncritical equation of good performance with high levels of marketed economic activity.

The well-known problems with GDP as an economic welfare measure include the following. First, it counts everything as a positive. It does not separate desirable, economic welfare-enhancing activity from undesirable welfare-reducing activity. For example, an oil spill increases GDP because someone has to clean it up, but it obviously detracts from our overall well-being. From the perspective of GDP, more crime, sickness, war, pollution, fires, storms and pestilence are all potentially good things, because they all generate economic activity in the formal market. Second, GDP leaves out many things that do enhance welfare but are outside the market. For example, the unpaid work of parents caring for their own children at home does not show up, but if these same parents decide to work outside the home and to pay for child care, GDP increases. The non-marketed work of nature in providing clean air and water, food, natural resources and other ecosystem services do not adequately show up in GDP. However, if those services are damaged and we have to pay to fix or replace them, then GDP will increase. Third, GDP does not account for the distribution of income among individuals. But it is well-known that an additional US$1 worth of income produces more welfare if one is poor rather than rich.
Several researchers have proposed alternatives that try to separate the positive from the negative components of marketed economic activity, add in non-marketed goods and services, and adjust for income-distribution effects. These include the Measure of Economic Welfare (MEW) the Index of Sustainable Economic Welfare (ISEW), Redefining Progress' more recent variation of ISEW, the Genuine Progress Indicator (GPI) and another variation of ISEW, the Sustainable Net Benefits Index (SNBI). The ISEW or GPI have been estimated for a number of countries worldwide, as shown in Figure 1, and for a few Canadian provinces, but had not been estimated for a U.S. state, county or city.
Table 1 is a summary description of the 26 elements of the GPI, how they are calculated in general and the basis of the regional estimates. The GPI starts with personal consumption expenditures (column A), which are adjusted for distribution of income (column B) to yield adjusted personal consumption (column C). Next, follow a series of additions that estimate non-marketed positive benefits (columns D–G) ranging from the value of unpaid household work to the services of highways and streets. These are followed by a list of subtractions (negative values are in parentheses—in columns H–X). Ranging from losses of social capital (i.e. column H—cost of crime, column I—cost of family breakdown and divorce, column J—loss leisure time and column K—cost of underemployment) to losses in natural capital (i.e. column U—depletion of non-renewable resources, column V—long-term environmental damage and column W—cost of ozone depletion). Finally, there are two columns (Y and Z) that deal with net investment and net “foreign” lending and borrowing, which can be either positive or negative.
GPI is calculated as the sum of columns C through Z. Our data collection efforts yielded reasonable estimates for all columns except column Z, net foreign lending and borrowing. The data for column Z for the three Vermont scales allowed us to calculate “foreign” (i.e. outside the area) borrowing, but not lending (for which we were unable to assemble reasonable data at these scales). This omission dramatically skews the results, so we decided to leave column Z out of the GPI index altogether, at least until we can find a way to estimate data on “foreign” lending at these scales. We also left column Z out of the national GPI for ease of comparison.
Application to Vermont

Figure 2 is a summary of the GPI per capita for all four spatial scales for the 1950–2000 time period. This allows the most direct comparison with the national figures. While national GPI per capita peaked in 1970–1980 and has continued downward to 1997, all three scales in Vermont have continued upward over the entire interval, although at decreasing rates in the last decade. While Burlington was initially well below the national average GPI per capita in 1950, with Chittenden County and the state as a whole slightly above it, by 2000 all three scales in Vermont were well above the national average GPI per capita. The national average GPI per capita in 2000 was about US$8000, while all three scales in Vermont were above US$16,000, more than double the national average.

Why has Vermont done so much better in recent years than the national average? The positive side of the ledger (income and households) per capita are very similar to the national average. For example, Figure 3 plots adjusted personal consumption per capita for all four scales and one can see very similar patterns of growth at all four scales. Figure 4 lots household work and capital. Burlington stands out slightly in this plot, mainly due to the increased value of household labor per capita relative to the other scales.
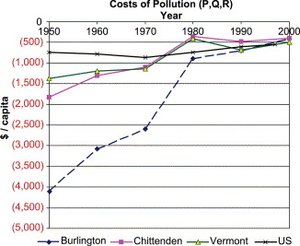
The major differences with the national averages are in the pollution, land loss and natural capital groups. Figures 5 through 7 plot these groups of columns for all four scales. Note that the figures plot costs (negative numbers) increasing as one moves down the y-axis. Figure 5 shows that the per capita costs of pollution for Burlington were much higher than the national average in the 1950–1970 period, but that since 1980 this has come down to approximately the national average. This explains Burlington's lower GPI per capita in 1950 than the other three scales. Figure 6 shows the land loss group, showing all three Vermont scales with significantly lower costs per capita than the national average. This is due in part to the regrowth of northeastern forests as farming and timber production moved westward, and more recently to Vermont's strict planning and zoning regulations that protect farmlands, forests and wetlands. Vermont's relatively low rates of population growth and population density relative to the national average also contribute to reduced pressure on the environment. Vermont's land area is 24,900 km2 with a population in the year 2000 of 588,067. This is slightly larger than New Jersey in area (at 20,160 km2) with less than 10% of New Jersey's population of more than 7 million. Vermont is slightly smaller in area than Belgium at 30,500 km2. Vermont has about 24 people/km2. New Jersey has about 370 people/km2 and Belgium has about 330 people/km2 for comparison. Alaska has about 0.3 people/km2 and the average for the lower 48 States is about 35 people/km2.
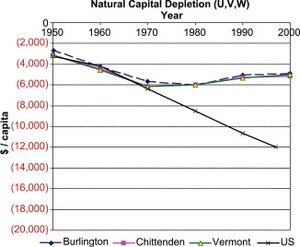
Figure 7 shows the natural capital depletion group. This group shows the largest difference between the three Vermont scales and the national average, with Vermont having more than US$6000 per capita less natural capital depletion than the U.S. average. This is due to Vermont's shift away from fossil energy sources to hydro (from Hydo Quebec and other smaller-scale local sources) and biomass (e.g. the McNeill wood-burning power plant in Burlington), as well as a focus on energy conservation at all three Vermont scales


Limitations
There are, of course, numerous sources of error and uncertainty in estimating the GPI at the national scale, which are only compounded at the three smaller scales. These include:
- There are several assumptions built into the GPI that are open to question. For example, when valuing household or volunteer work, one has to decide on a wage rate. The GPI assumes the “going rate” for household workers or volunteers performing the same tasks as paid workers. But this could be well below or well above the “real” rate, because, for example, paid household workers may be significantly underpaid or volunteers may be significantly less skilled than paid workers doing the same jobs.
- Data availability for the elements of the GPI generally decreased with decreasing scale. Data at the state level was relatively available for the GPI elements, but at the county and especially city scales it got significantly more difficult. In lieu of local data, some of the data were based on national or state figures scaled down to the local level using ratios of various kinds. This method obviously does not fully capture the unique qualities present at the smaller scales.
- Interregional flows of non-marketed goods and services (i.e. ecosystem services) are not captured in either GDP or GPI. For example, while Vermont may be benefiting from a better local environment, this may be at least partly at the expense of a depleted environment elsewhere in the country or the world. This effect is not addressed. However, the same effect is also a factor at the national scale. The U.S. is certainly benefiting at the expense of depletion of natural capital located elsewhere in the world. The question for explaining the differences between Vermont and the U.S. is whether this effect is significantly larger for Vermont than for the U.S. as a whole. While incorporating some measure of these transboundary effects would improve GPI in general, it seems highly unlikely that this effect would explain very much of the differences between the Vermont and the U.S. GPI's.
==Conclusions==
The GPI is a significantly different and more comprehensive approach to assessing economic progress (Genuine Progress Indicator (GPI) for Chittenden County and Burlington, Vermont, United States) than conventional measures like GDP. While it is far from perfect, it is a better approximation to economic welfare than GDP, because it accounts for income distribution effects, the value of household and volunteer work, costs of mobility and pollution, and the depletion of social and natural capital. *This was the first attempt to estimate GPI at multiple scales (the city, county and state levels). We have shown that it is feasible to apply the GPI approach at these scales and to compare across scales and with the national average. Data limitations and problems still exist, but potential solutions to these problems also exist. * All three Vermont scales have had significantly higher GPI per capita since 1980 than the national average. The GPI per capita for all Vermont scales was twice the national average in 2000. This indicates a significantly higher sustainable economic welfare for Vermont residents. The main factors explaining this difference had to do with Vermont's much better environmental performance than the national average. * Continued emphasis on the environment in Vermont will help the state maintain its lead in sustainable economic welfare per capita. It can enhance welfare even further by improving income and its distribution, social capital and personal mobility, but in a balanced way that does not sacrifice gains in the other factors or in environmental performance.
Editor's Note
This article is adapted from Robert Costanza, Jon Erickson, Karen Fligger, Alan Adams, Christian Adams, Ben Altschuler, Stephanie Balter, Brendan Fisher, Jessica Hike, Joe Kelly, Tyson Kerr, Megan McCauley, Keith Montone, Michael Rauch, Kendra Schmiedeskamp, Dan Saxton, Lauren Sparacino, Walter Tusinski and Laurel Williams, Estimates of the Genuine Progress Indicator (GPI) for Vermont, Chittenden County and Burlington, from 1950 to 2000, Ecological Economics, Volume 51, Issues 1-2, 1 November 2004, Pages 139-155.
Further Reading
- Costanza, R., J.C. Cumberland, H.E. Daly, R. Goodland and R. Norgaard, 1997. An Introduction to Ecological Economics, St. Lucie Press, Boca Raton, 275 pp. ISBN: 1884015727
- Costanza, R., R. D'Arge, R. de Groot, S. Farber, M. Grasso, B. Hannon, K. Limburg, S. Naeem, R.V. O'Neill, J. Paruelo, R.G. Raskin, P. Sutton and M. Van Den Belt, 1997. The value of the world's ecosystem services and natural capital. Nature, 387:253–259.
- Daly, H.E. and J. Cobb, 1989. For the Common Good: Redirecting the Economy Towards Community, the Environment, and a Sustainable Future, Beacon Press, Boston, 482 pp. ISBN: 0807047023.
- Lawn, P.A., 2003. A theoretical foundation to support the Index of Sustainable Economic Welfare (ISEW), Genuine Progress Indicator (GPI), and other related indexes. Ecological Economics, 44.
- Neumayer, E. 2000. On the methodology of the ISEW, GPI, and related measures: some constructive suggestions and some doubt on the threshold hypothesis. Ecological Economics, 34: 347–361.
- Redefining Progress. Sustainability Indicators: Genuine Progress Indicator (GPI).
- United Nations Environment Programme's Green Accounting Virtual Resource Center