Energy transitions
| Topics: |
Contents
Introduction
Growth in world population (billions, shown as lines and referring to the scale on the right-hand axis) and primary energy use (EJ, shown as bars and referring to the scale on the left-hand axis), industrialized (white squares and bars) versus developing (gray triangles and bars) countries, 1800 to 2000 in 25-year intervals. Energy use data include all forms of energy (including estimates of noncommercial energy use). Data prior to 1950 are estimates. Patterns of energy (Energy transitions) have changed dramatically since the onset of the Industrial Revolution in terms of both energy quantities and energy quality. These changing patterns of energy use, where energy quantities and quality interact in numerous important ways, are referred to in this article as energy transitions and are described mainly from a historical perspective. Far from being completed,many of these transitions are continuing to unfold in industrial and developing countries alike indicating powerful trends towards higher energy use and environmental impacts as a twin result of population (Population growth rate) and economic growth. These upward pressure trends are moderated however by continued improvements in the efficiency of energy use and improvements in energy quality, illustrated in this article by the energy intensity of economic activity and the carbon intensity of energy both at the level of primary energy and final energy.
Changes in Energy Use Quantities
Global energy use has grown by a factor of more than 20 over the past 200 years. This 20-fold increase, far in excess of world population growth rate, which rate has increased by a factor of 6 since 1800), constitutes the first major energy transition, a transition from penury to abundance. This transition is far from complete, however, and is characterized by persistent spatial and temporal heterogeneity (i.e., differences in who uses how much energy and where). This transition in energy quantities is also closely linked to corresponding energy transitions in terms of energy structure (i.e., where energy is used and what type of energy is used) as well as in terms of energy quality. Figure 1 illustrates this first energy transition, the growth in energy use quantities, using the minimum degree of representation of spatial heterogeneity, that is, by differentiating between industrialized and developing countries.
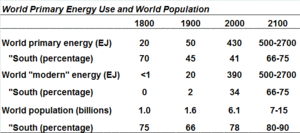
As is evident from Figure 1, the first energy transition of increasing energy use is only weakly related to population growth. Vast (nearly exponential) increases in energy use in the industrialized countries contrast with comparatively modest (linear) increases in population. Conversely, in developing countries, a nearly exponential increase in population has yielded (with the exception of the period since 1975) only a linear increase in energy use. In other words, most of the growth in energy use in industrialized countries has resulted from increases in per capita consumption, whereas for developing countries, most of the increase in energy use historically has been driven by increases in population. Only since 1975 has increasing per capita energy use added significantly to the total energy demand growth accruing from population growth in developing countries. This latter trend is expected to continue, and thus the next 100 years (for a quantitative scenario overview see Table 1) are likely to be quite different from the preceding century, indicating that the future is unlikely to unfold as a mere extrapolation of the past.
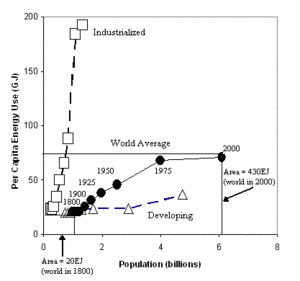 [2]. Growth in population (billions), x-axis) versus per capita energy use (GJ/capita, y-axis) in trajectories of 25-year intervals from 1800 to 2000 (based on Figure1). Data for industrialized countries (squares), developing countries (triangles), and the world average (circles). Areas of squares connecting x- and y-axis coordinates (illustrated for 1800 and 2000 in the Figure) are proportional to total energy use. Energy use data include all forms of energy (in particular estimates of noncommercial energy use). Data prior to 1950 are estimates.
 Energy use has increased in both industrialized and developing countries alike over the past 200 years, but the underlying driving forces have been radically different. The differences lie in the nature of the industrialization process and the defining characteristic of industrialized countries—income growth leading to affluence and high levels of material (and energy) consumption. In fact, disparities in the growth of energy use between industrialized and developing countries roughly mirror disparities in income growth because growth in energy use 2 is linked to growth in incomes. Many developing countries are today at the beginning of a long uphill development path that will require many decades to unfold and is likely to include many setbacks, as evidenced by the historical record of the industrialized countries. However, overall levels of energy use can be expected to increase as incomes rise in developing countries.
Although the pattern of energy use growth with economic development is pervasive, there is no unique and universal ‘‘law’’ that specifies an exact relationship between economic growth and energy use over time and across countries. Notwithstanding the overall evident coupling between economic and energy growth, the growth experiences of one country cannot necessarily be used to infer those of another country, neither in terms of speed of economic development nor in terms of how much growth in energy use such development entails. Furthermore, in many industrialized countries, per capita energy use since 1975 has remained remarkably flat despite continuing growth in per capita income, illustrating an increasing decoupling of the two variables (income and per capita energy use) as a lasting impact of the so-called ‘‘energy crisis’’ of the early 1970s.
There is a persistent difference between development trajectories spanning all of the extremes from ‘‘high-energy intensity’’ (United States) at one end to ‘‘low-energy intensity’’ (Japan). The concept of ‘ path dependency ’ helps to explain these persistent differences in energy use patterns among countries and regions even at comparable levels of income, especially when there are no apparent signs of convergence. Path dependency in energy systems arises from differences in initial conditions (e.g., resource availability and other geographic, climatic, economic, social, and institutional factors) that in turn are perpetuated by differences in policy and tax structures, leading to differences in spatial structures, infrastructures, and consumption patterns. These in turn exert an influence on the levels and types of technologies used, both at the consumer’s end and within the energy sector, that are costly to change quickly due to high sunk investment costs, hence the frequent reference to the concept of ‘‘technological lock-in.’’
Changes in the Structure of Energy Use
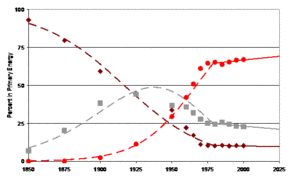 Figure 3. Structural changes in (percent of) world primary energy supply 1850-2000. Traditional fuels (brown), coal (grey), and modern energy forms (oil/gas and renewables/nuclear, red) in percent of world primary energy. Dashed and solid lines indicate model estimates: 1850-1980 (dashed lines) based on a logistic substitution model, 1980-2000 trends are approximated by linear trends (solid lines). Note in particular the trend break around in the late 1970s with a switch to much slower market penetration dynamics -- bad auspices for a required accelerated energy transition in a climate constrained world.
 A second important transition is the structural change of energy use in terms of where energy is used, and in what form. Historically, this transition entailed a move away from traditional energy forms, collected locally and used largely in rural areas, to processed modern energy forms, imported to and used predominantly in urban settings. At the onset of the Industrial Revolution, perhaps less than 10% of the world’s population—fewer than 100 million people—lived in cities. The United Nations estimates that by around 2010 the world urban population world will account for the first time in human history about half of the total world population. This is important, as urban dwellers currently use more than two-thirds of global energy and an even higher share of high-quality processed energy carriers such as liquid transportation fuels and electricity. Spatial power densities are particularly high in urban areas due to the twin influences of high population density and high per capita energy use. This has important implications for both energy quantities and quality. A comparative advantage of fossil fuels that led to their widespread use with industrialization is their high power density; that is, production, transport, and use of energy were no longer confined by site specific limitations characteristic of traditional renewable energy flows.
There are three major components that characterize historical (and future) structural changes in energy supply: the transition from traditional, noncommercial , renewable energy forms to commercial, largely fossil-based fuels; structural shifts in the share of various commercial fuels (coal , oil, natural gas, and ‘‘modern’’ renewables and nuclear energy) at the level of primary energy; and structural shifts in the various fuels actually demanded by the consumer, i.e. at the level of final energy and produced from a varying mix of energy sources, leading to a corresponding ‘‘conversion deepening’’ of the energy system.
The shift from traditional, noncommercial renewable fuels toward fossil fuels, particularly coal (Figure 3), was initiated with the introduction of coal-fired steam power during the Industrial Revolution. This shift was largely completed by the 1920s, when coal reached its maximum market share in global energy supply. Between 1920 and the early 1970s, coal was progressively replaced by increasing shares of oil and natural gas and non-fossil energy sources (Figure 3). Since then structural changes in the global primary energy mix have slowed down considerably, largely a result of a lack of a new fuel or technology that could be implemented on a large scale. This trend break towards a slow-down in the historical dynamics of structural change in energy supply systems represents a major challenge for the need of accelerated future energy transitions in a climate constrained world. It is important to recognize that these two major historical shifts in energy supply were not driven by resource scarcity or by direct economic signals such as prices, even if these exerted an influence at various times. Put simply, it was not the scarcity of coal that led to the introduction of more expensive oil. Instead, these major historical shifts were, first of all, technology shifts, particularly at the level of energy end use. Thus, the diffusion of steam and gasoline engines, of electric motors and appliances can be considered the ultimate driver, triggering important innovation responses in the energy sector and leading to profound structural change in energy supply.
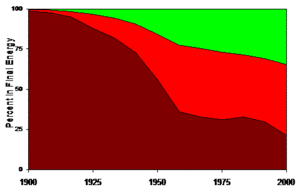
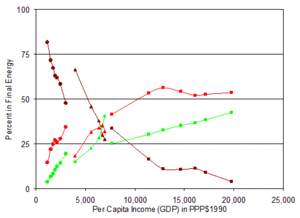 [5]: Structural change in final energy fuel mix (percent) as a function of income (GDP per capita at purchasing power parity exchange rates, PPP$/head). As incomes rise, demand for household consumption of solids (coal and biomass, brown) decreases, whereas demand for liquids (oil, red) and grids (natural gas and electricity, green) rises. This figure separates developing countries (circles) from more industrialized countries (reforming economies of Eastern Europe and the former Soviet Union Triangles, and OECD countries, squares) to highlight differences in wealth and final energy choices. Data are from 1960-2000 for developing countries and OECD countries. For REF Countries data are shown only for 1960-1985. In order to improve the clarity of graphical representation the effects of the post 1990 economic depression with declining per capita incomes are not shown.
 The continuing growth of high-quality processed fuels (liquids, gases, and electricity) that reach the consumer via dedicated energy infrastructure grids illustrates another structural change in energy supply, but this time not at the point of primary energy supply but rather at the point of delivery to the final consumer (i.e., at the level of final energy). By the beginning of the 20th century, nearly all energy reached consumers worldwide in the form of solids (fuelwood and coal for the home and for industry) 4. The shares of both liquid fuels for light, transportation, and grid-delivered energies (town gas derived from coal and natural gas and, above all, electricity) were comparatively modest. Today, solids account for only 20% of final energy in the world and less than 5% of final energy in OECD and Reforming Economies (REF) countries. With rising incomes, consumers pay increasing attention to convenience and ‘‘cleanliness,’’ favoring liquids and grid-delivered energy forms (even if their costs to consumers are above those of solid energy forms) 5.
The other side of the coin of energy forms of ever higher quality and convenience at the point of final energy is that ever more primary energy must be converted into the high-quality fuels consumers actually demand. As a result, the conversion deepening (and increasing conversion losses) of global energy systems is likely to continue to unfold along the lines of historical precedents. For instance, around 1900, little global primary energy was converted into electricity. Today, over 35% of all primary energy harnessed worldwide is converted into electricity. In OECD and REF countries, 42% of all primary energy is converted into electricity. The global transition toward liquids and grids is likely to follow the precedents of high-income industrialized countries (depending, of course, on the rate of economic development, i.e., income growth). Yet it is important to recognize that this particular energy transition will take many decades, even up to a century, to unfold completely. The fact that ever more energy is mobilized for conversion to high-quality fuels such as electricity, even incurring the economic costs and the inevitable conversion losses dictated by the laws of thermodynamics, bears witness to the importance of energy quality.
Changes in Energy Quality and Productivity
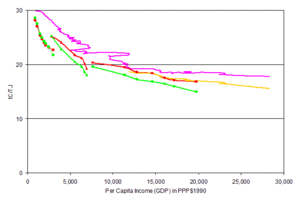 [6]: Decarbonization of energy, i.e. carbon intensity per unit of energy supplied (in tons elemental carbon [tC] per TJ) at the level of primary (red) and final energy (green) versus income (PPP$ GDP per capita). For more prosperous countries (Reforming Economies [REF] and OECD countries), final energy carbon intensity is absolutely lower than primary energy carbon intensity; this indicates a preference at the end-user for cleaner fuels. Data are from 1960-2000 for developing countries (circles) and OECD countries (squares), and from 1960-1985 for REF countries (triangles). For comparison also the historical development trajectory of the US is shown for the primary energy (1800-2000, in magenta) and for the final energy (1960-2000, in orange) carbon intensity.
 Perhaps the single most important transition in global energy systems is that of increasing energy quality and energy productivity. Here, the carbon intensity of energy is used as an indicator of energy (and environmental) quality pars pro toto. In addition, the important linkages between energy quality and energy quantities are discussed by looking at a final energy transition: the move toward higher energy productivity and energy efficiency.
The decline in the carbon intensity of primary energy use is generally referred to as ‘‘decarbonization.’’ Although decarbonization is usually described as a phenomenon at the level of primary energy use, its ultimate driver is energy consumers and their preference for convenience and clean fuels—if their incomes allow. The overall correlation between declining carbon intensities of final energy and rising incomes across countries and time 6 is a powerful indication that income effects are important not only for energy quantities but also for energy quality. Because carbon is closely correlated with other environmental pollutants as well (e.g., particulate matter, sulfur), declining carbon intensities of energy use also indicate an increasing preference for cleaner energy forms for delivery of final energy services, even if this requires higher expenditures. The fact that carbon intensities of final energy are universally lower than carbon intensities of primary energy at higher incomes reinforces this notion.
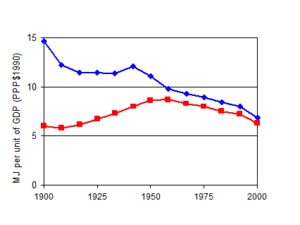 Figure 7: Improvements in energy efficiency as indicated by energy intensity (primary energy use in MJ per unit of GDP, in PPP90) at the global level. A unit of GDP now requires less than half of the primary energy input of some 100 years ago (blue, diamonds). Also notice how the energy intensity of commercial energy (coal, oil, natural gas, hydropower, nuclear; shown in red, squares) follows a different path from the aggregate energy intensity including noncommercial fuels: first it rises, and then it falls.
 An important relation exists between improvements in energy quality and those of energy efficiency and energy productivity. The last major energy transition discussed here is the improvement of energy intensity (or energy productivity), measured at the aggregate macroeconomic level in terms of energy use per unit of GDP. Aggregate energy intensities, including noncommercial energy use, generally improve over time across all countries. For example, a unit of GDP on the global scale now requires less than one-half the primary energy needed some 100 years ago 7, in blue. This corresponds to an average annual decrease in energy intensity of close to 1% per year. The process is not always smooth, as periods of rapid improvements are interlaced with periods of stagnation or short-term trend reversals (see the pre-1950 period in Figure 7, and according to some statistical sources perhaps also the period after the year 2000 Shown in Figure 7).
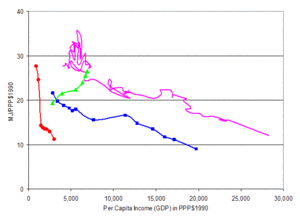 [8]: Long-term trends of higher energy and economic productivities displaying path dependent behavior. As incomes (total factor productivity) rise, energy intensities (energy use per unit of GDP) decline, i.e. energy productivity rises as well. At similar income levels, OECD countries (blue, squares) have significantly lower energy intensities than the U.S. (in magenta), highlighting the importance of path dependency as a result of differences in initial conditions (e.g. resource availability) and persistent differences in the economic environment (e.g. energy prices). Note also how energy intensities of the (formerly) centrally planned economies (REF countries, green, triangles) run counter global trends, illustrating the unique energy and material intensive development model characteristic of central planning under Communism, now recognized as both economically and environmentally unsuccessful. Data are from 1950-2000 for developing countries (red, circles), from 1960-1985 for REF countries (green, triangles), and from 1900-2000 for the U.S (magenta, solid line) and from 1900-2000 for (all) OECD Countries (blue, squares). Long-run estimates of economic output (GDP) for the centrally planned economies are based on Maddison, 2003, but are affected by large uncertainties.
 Whereas aggregate energy intensities generally improve over time, commercial energy intensities follow a different path 7, in red. They first increase, reach a maximum, and then decrease. The initial increase is due to the substitution of commercial energy carriers for traditional energy forms and technologies. However, as evidenced by the total aggregate energy intensity, the overall efficiency effect remains decisively positive. Once the process of substituting commercial fuels for noncommercial energy is largely complete, commercial energy intensities decrease in line with the pattern found for aggregate energy intensities.
Although the trend is one of conditional convergence in energy intensities across countries (especially when measured at purchasing power parities as done here), the patterns of energy intensity improvements in various countries reflect their different situations and development histories. Economic development is a cumulative process that, in various countries, incorporates different consumption lifestyles, different settlement patterns and transport requirements, different industrial structures, and different take-off dates toward industrialization 8. The history of the formerly centrally planned economies (REFs in [8]) also suggests that in the long-run successful development is only possible with broad-based productivity growth, i.e. energy productivity needs to improve along the lines of other productivities (capital, labor) as well. Thus, the historical evolution of energy intensities again provides an example of path dependency.
Income is important because income levels determine both the quantities and quality of energy affordable to consumers as well as the type of energy end use conversion devices available to them (e.g., a capital-intensive, energy-efficient cooking stove vs. a traditional cheap but inefficient one). Thus, the final energy transition discussed here, the move toward more efficient energy use, is far from completed. Efficiency improvement potentials remain large in affluent and poor societies alike. Far from being autonomous, the pace of realization of efficiency improvement potentials in the future depends on a variety of factors. For instance, it depends on income growth in developing countries, making clean and efficient energy forms and end use devices affordable to wider segments of society. And it depends on new technologies and incentives that promote more efficient energy use in affluent countries. This last energy transition toward higher efficiency needs to be pursued actively and continuously because it remains forever ‘‘unfinished business.’’
Endnotes
Data Sources: The data used in this article and their sources are given in Appendix I (Energy transitions) .
Acknowledgment: The research assistance of Jordan Macknick in the preparation of this revised entry is gratefully acknowledged.
References
- Arthur, W.B. (1994). Increasing Returns and Path Dependence in the Economy. University of Michigan Press, Ann Arbor, MI. ISBN: 0472064967.
- Fouquet, R., and Pearson P.J.G. (1998). A thousand years or of energy use in the United Kingdom. The Energy Journal 19(4), 1-41.
- Grubler, A. (1998). Technology and Global Change. Cambridge University Press, Cambridge, UK. ISBN: 0521543320.
- Grubler, A. (2004). Transitions in energy use, Encyclopedia of Energy, Vol. 6, 163–177. Reprinted as RR-04-005, International Institute for Applied Systems Analysis, Laxenburg, Austria.
- Grubler, A., and Nakicenovic, N. (1996). Decarbonizing the global energy system. Technological Forecasting and Social Change 53, 97-100.
- Maddison, A. (2003). The World Economy: A Millennial Perspective. Overseas Press, New Dehli for OECD, Paris, France. ISBN: 9264022619.
- Nakicenovic, N., Grubler, A., and McDonald, A., eds (1998). Global Energy Perspectives. Cambridge University Press for International Institute for Applied Systems Analysis (IIASA) and World Energy Council (WEC), Cambridge, UK. ISBN: 0521642000.
- Smil, V. (1994). Energy in World History. Westview Press, Boulder, CO. ISBN: 0813319021.
Glossary
Carbon Intensity: A measure of the amount of carbon (Energy transitions) contained in various energy forms. It is commonly expressed as units of carbon emitted per unit of energy (in tons elemental carbon [tC] per MJ in this entry).
Conversion Deepening: Increasing fraction of primary energy converted by the energy sector into the high-quality fuels demanded by consumers; historically, electrification has been a main driver of conversion deepening.
Decarbonization : A trend referring to a persistent long-term decline in carbon intensity, resulting from cleaner and more modern fuels being used on primary and final energy levels.
Energy : The ability to do work. Specifically, in this context the ability of different fuels to be processed and converted into forms that provide useful services for consumers ranging from large power plants to individual households.
Energy Efficiency: Energy use per unit of energy output or per unit of energy service provided.
Energy Intensity: A macroeconomic measure of the energy required per unit of economic output. It is commonly expressed as units of energy per unit of Gross Domestic Product (GDP).
Energy Productivity: Output of energy services for a given amount of energy input.
Final Energy: Energy forms and fuels as sold to or as used by final consumers (e.g., households, industrial establishments, government agencies); typically, modern final energy forms and fuels are generated, involving various steps of conversion from primary energy to final energy.
Noncommercial Fuels: Traditional fuels, such as fuelwood and dried cow dung, which are collected and used by energy consumers directly, without involving market transactions (exchange for money) or energy conversions to processed fuels.
Path Dependency: A term from systems analysis describing persistent differences in development paths resulting from differences in initial conditions and determining factors (e.g., economic, institutional, technological) responsible for growth in energy use and the like; path dependency implies only limited convergence among various systems as well as ‘‘lock-in’’ in particular development patterns accruing from the accumulation of past decisions that are difficult (and costly) to change.
Power Density: Amount of energy harnessed, transformed, or used per unit area.
