Dose-response relationship
| Topics: |
Knowledge of the dose-response relationship:
- establishes causality that the chemical has in fact induced the observed effects
- establishes the lowest dose where an induced effect occurs – the threshold effect
- determines the rate at which injury builds up – the slope for the dose response.
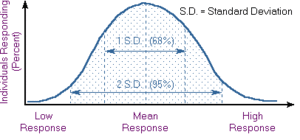
Within a population, the majority of responses to a toxicant are similar; however, a wide variance of responses may be encountered—some individuals are susceptible and others resistant. As demonstrated in Figure 1, a graph of the individual responses can be depicted as a bell-shaped standard distribution curve.
Dose responses are commonly presented as mean ± 1 S.D. (standard deviation), which incorporates 68% of the individuals (see Figure 2). The variance may also be presented as two standard deviations, which incorporates 95% of the responses. A large standard deviation indicates great variability of response. For example, a response of 15±8 mg indicates considerably more variability than 15±2 mg.
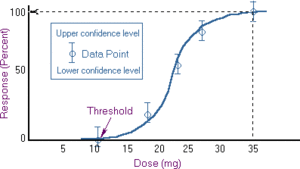
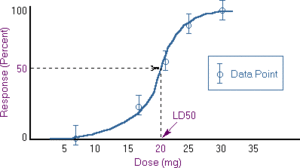
The dose-response curve normally takes the form of a sigmoid curve (see Figure 3). It conforms to a smooth curve as close as possible to the individual data points. For most effects, small doses are not toxic. The point at which toxicity first appears is known as the threshold dose level. From that point, the curve increases with higher dose levels. In the hypothetical curve in Figure 3, no toxicity occurs at 10 mg whereas at 35 mg 100% of the individuals experience toxic effects.
A threshold for toxic effects occurs at the point where the body's ability to detoxify a xenobiotic or repair toxic injury has been exceeded. For most organs there is a reserve capacity so that loss of some organ function does not cause decreased performance. For example, the development of cirrhosis in the liver may not result in a clinical effect until over 50% of the liver has been replaced by fibrous tissue.
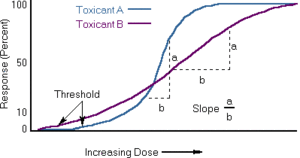
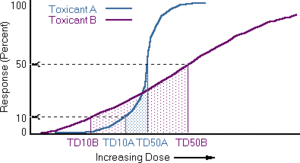
Knowledge of the shape and slope of the dose-response curve is extremely important in predicting the toxicity of a substance at specific dose levels. Major differences among toxicants may exist not only in the point at which the threshold is reached but also in the percent of population responding per unit change in dose (i.e., the slope). As illustrated in Figure 4, Toxicant A has a higher threshold but a steeper slope than Toxicant B.
Dose Estimates of Toxic Effects
Dose-response curves are used to derive dose estimates of chemical substances. A common dose estimate for acute toxicity is the LD50 (Lethal Dose 50%). This is a statistically derived dose at which 50% of the individuals will be expected to die. Figure 5 illustrates how an LD50 of 20 mg is derived.
Other dose estimates also may be used. LD0 represents the dose at which no individuals are expected to die. This is just below the threshold for lethality. LD10 refers to the dose at which 10% of the individuals will die.
For inhalation toxicity, air concentrations are used for exposure values. Thus, the LC50 is utilized which stands for Lethal Concentration 50%, the calculated concentration of a gas lethal to 50% of a group. Occasionally LC0 and LC10 are also used.
The term Lethal Concentration is also used to describe aquatic toxicity, where concentration refers to the concentration in water.
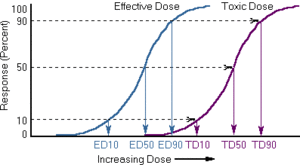
Effective Doses (EDs) are used to indicate the effectiveness of a substance. Normally, effective dose refers to a beneficial effect (relief of pain). It might also stand for a harmful effect (paralysis). Thus the specific endpoint must be indicated. The usual terms are:
Toxic Doses (TDs) are utilized to indicate doses that cause adverse toxic effects. The usual dose estimates are listed below:
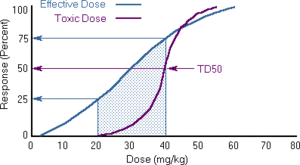
Knowledge of the effective and toxic dose levels aides the toxicologist and clinician in determining the relative safety of pharmaceuticals. As shown in Figure 6, two dose-response curves are presented for the same drug, one for effectiveness and the other for toxicity. In this case, a dose that is 50-75% effective does not cause toxicity whereas a 90% effective dose may result in a small amount of toxicity.
Therapeutic Index
The Therapeutic Index (TI) is used to compare the therapeutically effective dose to the toxic dose. The TI is a statement of relative safety of a drug. It is the ratio of the dose producing toxicity to the dose needed to produce the desired therapeutic response. The common method used to derive the TI is to use the 50% dose-response points. For example, if the LD50 is 200 mg and the ED50 is 20 mg, the TI would be 10 (200/20). A clinician would consider a drug safer if it had a TI of 10 than if it had a TI of 3.
The use of the ED50 and LD50 doses to derive the TI may be misleading as to safety, depending on the slope of the dose-response curves for therapeutic and lethal effects. To overcome this deficiency, toxicologists often use another term to denote the safety of a drug – the Margin of Safety (MOS).
The MOS is usually calculated as the ratio of the dose that is just within the lethal range (LD01) to the dose that is 99% effective (ED99). The MOS = LD01/ED99. A physician must use caution in prescribing a drug in which the MOS is less than 1.
Due to differences in slopes and threshold doses, low doses may be effective without producing toxicity. Although more patients may benefit from higher doses, this is offset by the probability that toxicity or death will occur. The relationship between the Effective Dose response and the Toxic Dose response is illustrated in Figure 7.
Knowledge of the slope is important in comparing the toxicity of various substances (see Figure 8). For some toxicants a small increase in dose causes a large increase in response (toxicant A, steep slope). For other toxicants a much larger increase in dose is required to cause the same increase in response (toxicant B, shallow slope).
NOAEL and LOAEL
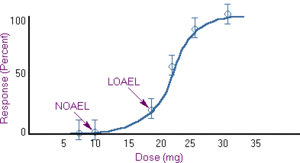
Two terms often encountered are No Observed Adverse Effect Level (NOAEL) and Low Observed Adverse Effect Level (LOAEL). They are the actual data points from human clinical or experimental animal studies.
Sometimes the terms No Observed Effect Level (NOEL) and Lowest Observed Effect Level (LOEL) may also be found in the literature. NOELs and LOELs do not necessarily imply toxic or harmful effects and may be used to describe beneficial effects, or in some cases, any measurable biological effect of chemicals.
The NOAEL, LOAEL, NOEL, and LOEL have great importance in the conduct of risk assessments.
| Disclaimer: This article is taken wholly from, or contains information that was originally published by, the National Library of Medicine. Topic editors and authors for the Encyclopedia of Earth may have edited its content or added new information. The use of information from the National Library of Medicine should not be construed as support for or endorsement by that organization for any new information added by EoE personnel, or for any editing of the original content. |
