Climate Solutions: Chapter 9
| Topics: |
Contents
Is Nuclear Power Low on Carbon?
It is sensible to improve energy efficiency and to develop alternative and sustainable sources of supply; it's sensible to replant the forests which we consume; it's sensible to reexamine industrial processes; it's sensible to tackle the problem of waste. I understand that the latest vogue is to call them “no regrets” policies. Certainly we should have none in putting them into effect. —Margaret Thatcher, 1990
My belief is, and I am going to say this in a careful way, the best way to fund R&D might simply be a charge on every kilowatt-hour delivered to every customer in America, so that money is earmarked and focused on technologies.—James Rogers, Chairman and President, Duke Energy, 2008
Will switching fromcoal, our dirtiest fuel source, tonuclear fission solve the emission growth problem while providing us the vast amount of future electricity the world needs? Or, put another way, how much greener isnuclear power than burning coal? The short answer is, nuclear fission is not as green as you might think. And even if it is the option we choose, it may be impossible to construct enough new nuclear plants in time.'higher relative cost nuclear power than nearly all competitors, per unit of netCO2displaced, means that every dollar invested in nuclear expansion will worsenclimate changeby buying less solution per dollar.—Amory Lovins and Imran Sheikh[12]
A nuclear power plant may have cooling towers to chill its reactor water, but it does not have the tall exhaust stack that always accompanies coal-fired plants. Some nations, such as France, rely very heavily already on nuclear power for electricity. For years, the US government support for nuclear power has been enormous, with almost half a trillion dollars of public subsidies and incentives over the past 50 years. In 2007, 439 nuclear plants were in operation worldwide, with an average age since construction of 23 years, supplying about 15% of the world’s electricity. These represent a total installed capacity of 372 gigawatts in 31 countries. At the end of 2007, a total of 34 reactors were under construction around the world. Three new nuclear power reactors were connected to the grid—in China, India, and Romania. An additional 117 nuclear reactor plants have been decommissioned and mothballed. In fact, the International Atomic Energy Agency had to admit that nuclear power generation actually dipped in 2007. [10]
The US Nuclear Regulatory Commission (NRC) did receive applications in 2007 for four new nuclear reactors, the first in nearly 30 years. But over the past decade, the marketplace has not responded by building very many nuclear plants, here or elsewhere. None of the plants currently under construction are being financed by private-risk capital. And the industry’s own tally of future growth is quite modest. See Table 9.4 for a view on this growth.
| Table 9.4 Global Nuclear Power Capacity Projections | |||||||
| Country group | 2006 | 2010 | 2020 | 2030 | |||
| Actual | Low | High | Low | High | Low | High | |
| Western Europe | 123 | 121 | 122 | 91 | 131 | 71 | 149 |
| North America | 112 | 114 | 115 | 125 | 132 | 129 | 168 |
| Far East | 78 | 79 | 82 | 112 | 136 | 133 | 179 |
| Eastern Europe | 47 | 48 | 49 | 70 | 85 | 81 | 111 |
| Middle East and south Asia | 4 | 10 | 11 | 16 | 27 | 21 | 46 |
| Latin America | 4 | 4 | 5 | 8 | 8 | 9 | 10 |
| Africa | 2 | 2 | 2 | 3 | 5 | 3 | 12 |
| Southeast Asia and the Pacific | 0 | 0 | 0 | 0 | 1 | 1 | 7 |
| World totals | 370 | 378 | 386 | 425 | 525 | 447 | 691 |
| Note: These IAEA power projections are in gigawatts of electric capacity, GW(e). | |||||||
| Table Source: [10] | |||||||
The International Atomic Energy Agency reports that of the more than 30 nuclear units under construction in 13 countries, at least a dozen sites have been so for at least 20 years. Why? While existing nuclear plants may appear cheap to run—if securing spent fuel is overlooked—new plants are extremely expensive to build and are getting more so each year. Construction cost overruns are typically double to triple the initial projections. For existing plants, as the fuel contracts expire, the likely cost for new contracts for fission-grade uranium, a scarce metal, will rise steeply. Aging plants face mounting maintenance and repair costs. The nuclear industry blames such cost overruns on barriers imposed by citizen activism, such as the antinuclear movement in the United States. Yet, countries without such citizen barriers have also experienced similar cost escalations and overruns in their nuclear programs, for example, Canada, France, Japan, and the former Soviet Union.
Florida Power and Light (FPL) Group is the nation’s largest utility company, with a market cap of roughly $40 billion. In early 2008, FPL Group revised steeply upward the expected costs for a 2.2 to 3.04 gigawatt two-unit plant it is seeking to build, from $12 to $24 billion. It is doubtful that even a corporation that large would proceed on a project costing more than $5 or $6 billion without federal loan guarantees, let alone a nuclear facility costing two or more times that amount. So taxpayers would be left as the insurance of last resort. Moody's, which ranks the credit worthiness of borrowers, estimates that new US nuclear reactors will cost from $5,000 to $6,000 per kilowatt, as reported in the Wall Street Journal. [24]
In somewhat brutal words, Lovins and Sheikh tell us that nuclear power is an “industry that is failing and unfinanceable despite wildly escalating subsidies, has been massively outpaced by competitors it doesn’t even recognize, and is unable even in principle to deliver its claimed climate and security benefits.” [12]
Even if we ignore the considerable full–life cycle emissions of ore extraction, uranium refining, and plant construction for nuclear power, the powerful opportunity costs that nuclear power requires will eat up cash and credit that could have been used for far-less-expensive, equally scalable electric power options, from cogeneration (where waste heat is reused) to combined-cycle gas plants, wind farms, and more. On the cost-versus-benefit scale, as Lovins and Sheikh write, “efficiency, though, beats everything, often including just running an existing thermal power station even if building it were free.” [12] See Figure 9.14.
Online Figures
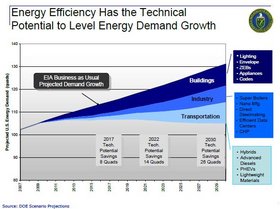 Figure 9.5 Energy efficiency’s potential to level energy demand growthIn the next two decades, potential technology gains in energy efficiency could help the United States produce a growing US economy that uses the same or less energy than we currently use. (Note that “quad” is a quadrillion Btus.) Source: [27] as compiled by D. Rodgers | |
 Figure 9.8 Projected global CO2 emission growth for key economic sectorsThe emission growth rates in the business-as-usual base case are 1.6% from 2000 to 2030 and 2.2% from 2030 to 2050. Power generation and transportation sources are the fastest-growing sectors. Managing these sources will be vital to any successful emission mitigation strategy. The energy transformation category includes petroleum refining, natural gas, and conversion of coal to liquids and conversion of biomass to alcohols, much of which will feed liquid fuel to the transportation sector. The carbon dioxide equivalent (CO2e) units are annual metric gigatons (Gt per year). Source: [19] as adapted from [25] | |
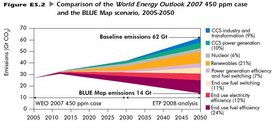 Figure 9.9 Contributions of technology wedgesThe potential carbon mitigation from different energy technologies under the IEA’s Blue Scenario shows some room for optimism for reducing emissions. Carbon capture and sequestration represents almost one-fifth of the entire mitigation potential, almost as much as all renewables combined. Source: [17] |
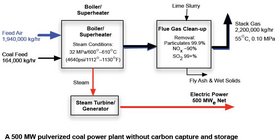 Figure 9.10 A 500 MW pulverized-coal plant without carbon capturePulverizing coal makes the process more efficient and allows coal to burn more completely once ignited. If the plant has 164 metric tons per hour of arriving coal, the resulting coal mineral matter produces about 23 metric tons per hour of fly and bottom ash. This ash can be used in cement or brick manufacture. Desulfurization of the flue gas produces about 41 metric tons per hour of wet solids that may be used in wallboard manufacture or disposed of in an environmentally safe way. Source: [15] |
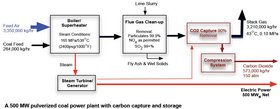 Figure 9.11 A 500 MW pulverized coal plant with carbon captureNote that we have added the carbon capture in the plant, in which 90% of the carbon is removed from the flue gas after combustion. Note also that the plant now requires a substantially higher coal feed rate to produce the same power output of 500 MW. Source: [15] |
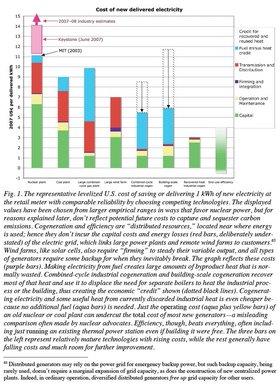 Figure 9.14 Cost of new delivered electricityThe costs of saving or delivering 1 kWh of new electricity at the retail meter in the United States with comparable reliability is displayed here for power ranges in ways that actually favor nuclear power. Future costs for carbon capture are not included. The three bars on the left represent relatively mature technologies that also happen to have rising costs: nuclear, coal and large combined cycle gas plants. The five bars on the right generally have falling delivery costs with more room for further cost reductions: wind, industrial and building scale combined cycle cogeneration, recovered heat industrial cogeneration, and–the least expensive option–end-user efficiency. Source: [12] |
Bibliography
- Canadell JG, Le Quéré C, Raupach MR, Field CB, Buitenhuis ET, Ciais P, Conway TJ, Gillett NP, Houghton RA, Marland G (2007) Contributions to accelerating atmospheric CO2 growth from economic activity, carbon intensity, and efficiency of natural sinks. Proceedings of the National Academy of Sciences 104(47):18866. http://www.pnas.org/cgi/content/abstract/104/47/18866
- Cowart R, Vale S, Bushinsky J, Hogan P (2008) State Options for Low-Carbon Coal Policy. http://www .pewclimate.org/white_papers/coal_initiative/
- Doornbosch R, Gielen G, Koutstaal P (2008) Mobilising Investments in Low-Emission Energy Technologies on the Scale Needed to Reduce the Risks of Climate Change. Round Table on Sustainable Development. http://www.iea.org
- Edmonds JA, Wise MA, Dooley JJ, Kim SH, Smith SJ, Runci PJ, Clarke LE, Malone EL, Stokes GM (2007) Global Energy Technology Strategy: Addressing Climate Change. Global Energy Technology Strategy Program. http://www.pnl.gov/gtsp/publications/
- Energy Future Coalition (2008) Diverse Coalition of Organizations Calls upon the Congress and Next President to Make Energy Efficiency a National Priority. Press Release (September 16, 2008). http://www.energyfuturecoalition.org
- Field CB, Raupach MR, eds (2004) The Global Carbon Cycle: Integrating Humans, Climate and the Natural World (Island Press, Washington, DC). http://islandpress.org
- Friedman T (2008) Hot, Flat and Crowded: Why We Need a New Green Revolution and How It Can Renew America, 410. (Farrar, Straus, and Giroux, New York). http://www.thomaslfriedman.com
- Herzog T, Baumert K, Pershing J (2006) Target: Intensity: An Analysis of Greenhouse Gas Intensity Targets. http://wri.org
- Hoffert MI, Caldeira K, Benford G, Criswell DR, Green C, Herzog H, Jain AK, Kheshgi HS, Lackner KS, Lewis JS (2002) Advanced Technology paths to global climate stability: energy for a greenhouse planet. Science 298 (5595): 981. http://www.sciencemag.org
- IAEA (2008) Nuclear´s Great Expectation: Projections Continue to Rise for Nuclear Power, but Relative Generation Share Declines. International Atomic Energy Agency. September 11, 2008 (read October 20, 2008). http://www.iaea.org/NewsCenter/News/2008/np2008.html
- Leinen M (2008) Oceans: A Carbon Sink or Sinking Ecosystems? National Conference on Science, Policy, and the Environment: Climate Science and Solutions. http://ncseonline.org/2008conference/
- Lovins A, Sheikh I (2008) The nuclear illusion. Ambio, in November 2008 preprint. http://www.rmi.org/sitepages/pid257.php#E08-01
- Lovins A (2008) RMI Stanford Energy Lectures: Lecture 5: Implications (March 2008). Rocky Mountain Institute (read September 4, 2008). http://www.rmi.org/stanford
- Metz B, Davidson O, de Coninck H, Loos M, Meyer L (2005) Special Report: Carbon Dioxide Capture and Storage. IPCC. http://www.ipcc.ch
- MIT (2007) MIT Study on the Future of Coal: Options for a Carbon-Constrained World. http://web.mit.edu/coal/
- NETL (2001) Coal and Power Systems Strategic and Multi-year Program Plans. http://www.doe.gov/sciencetech/carbonsequestration.htm
- OECD IEA (2008) Energy Technology Perspectives 2008: Scenarios & Strategies to 2050: Executive Summary. http://www.iea.org
- OECD IEA (2008) Key World Energy Statistics from the IEA 2008. http://www.iea.org
- Princiotta F (2009) Global climate change and the mitigation challenge. Journal of the American Waste and Air Management Association (forthcoming, 2009). http://www.epa.gov/appcdwww
- Randolph J, Masters GM (2008) Energy for Sustainability: Technology, Planning, and Policy. (Island Press, Washington, DC). http://www.energyforsustainability.org
- Raupach MR, Marland G, Ciais P, Le Quéré C, Canadell JG, Klepper G, Field CB (2007) Global and regional drivers of accelerating CO2 emissions. Proceedings of the National Academy of Sciences 104(24):10288. http://www.pnas.org/cgi/content/long/104/24/10288
- Renard F, Gundersen E, Hellmann R, Collombet M, Le Guen Y. (2005) Numerical modeling of the effect of carbon dioxide sequestration on the rate of pressure solution. Oil & Gas Science and Technology Review 60:381?– 399. http://ogst.ifp.fr/
- Rodgers D (2008) Commentary on Energy and Technological Challenges. Climate Change Science and Solutions: Eighth National Conference on Science, Policy, and the Environment. http://ncseonline.org/2008conference/
- Smith R (2008) “New Wave of Nuclear Plants Faces High Costs.” Wall Street Journal, May 12, 2008. http://online.wsj.com/
- Taylor P (2008) Energy Technology Perspectives 2008: Scenarios and Strategies to 2050.IEEJ Workshop, July 7, 2008. Energy Technology Policy Division, Tokyo (read September 3, 2008). http://www.iea.org/Textbase/publications/free_new_Desc.asp?PUBS_ID=2012
- US EIA (2008) Annual Energy Outlook 2008 with Projections to 2030. Department of Energy. DOE/EIA-0383(2008)(read October 1, 2008). http://www.eia.doe.gov/oiaf/aeo/demand.html
- US EIA (2008) Scenario Projections. Department of Energy Energy Information Agency (read September 3, 2008). http://www.eia.doe.gov
- US EIA (2008) US Carbon Dioxide Emissions from Energy Sources 2007 Flash Estimate. May 2008 (read September 5, 2008). http://www.eia.doe.gov/oiaf/1605/flash/flash.html
- US EPA (2007) Emissions & Generation Resource Integrated Database (read September 2, 2008). http://www.epa.gov/egrid/
- USGS (2008) Mineral Commodity Summaries: Cement. http://usgs.gov
- WBCSD (2005) Cement Sustainability Initiative Progress Report. http://www.wbcsdcement.org
- WRI CAIT (2008) Climate Analysis Indicators Tool (CAIT) 5.0. http://cait.wri.org
- Yamaji K, Matsuhashi R, Nagata Y, Kaya Y (1991) An integrated systems for CO2/energy/GNP Analysis: Case studies on economic measures for CO2 reduction in Japan. Workshop on CO2 reduction and removal. http://www.iiasa.ac.at
Online resources
- Carbon capture and storage
- Energy Information Administration (EIA), United States
- Energy transitions
- Nuclear power reactor
- Rebound effect
- Ten most distortionary energy subsidies
- U.S. Department of Energy: Energy Efficiency and Renewable Energy (EERE)
- Global Carbon Project
- International Energy Agency (IEA)
- Pew Center on Global Climate Change: Coal Initiative Reports
- Renewable Energy Policy Network for the 21st Century
- Online Unit Converter
Action items
- Action 6: Energy Efficiency and Conservation
- Action 7: Biofuel Industry and CO2 Emissions?— Implications for Policy Development
- Action 8: Solar Energy:Scaling Up?— Science and Policy Needs
- Action 9: How to Ensure Wind Energy Is Green Energy
- Action 10: Nuclear Energy?— Using Science to Make Hard Choices
- Action 21: The US Global Change Research Program (USGCRP)?— What Do We Want from the Next Administration?
Instructor resources
(password required)
|
|