PowerPoint 2010
Working with Charts
Introduction

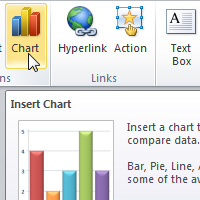
A chart is a tool you can use to communicate your data graphically. Displaying charts in PowerPoint allows your audience to see the meaning behind the numbers, and they make showing comparisons and trends a lot easier. In this lesson, you will learn how to insert charts and modify them so they communicate information effectively.


