PowerPoint 2003
Adding Charts, Diagrams, and Tables
Challenge!
- Open the My Hobbies presentation.
- Insert a new slide that contains a chart icon. This will be the fifth slide in the presentation.
- Decide whether you would like to insert a chart or table. This chart or table needs to be related to the topic of your presentation, how you spend you free time/your hobbies.
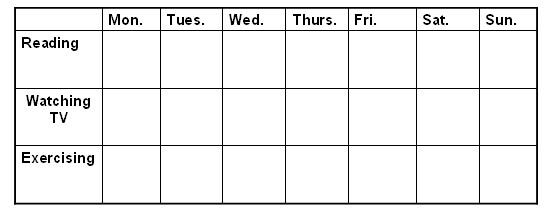
An example of a table related to your hobbies: You could create a table to track how many hours you spend on each activity for a week. To do this, insert a table with eight columns and four rows. It might look like this:
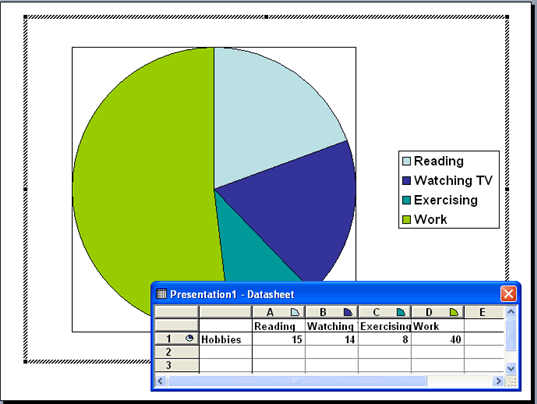
An example of a chart related to your hobbies: You could create a chart that shows the estimated amount of time you spend on each hobby in a week (out of 168 hours, or seven days multiplied by 24 hours). It might look like this:

- Format the table or chart as necessary.
- Save and close your presentation.


