PowerPoint 2003
Adding Charts, Diagrams, and Tables
Setting a maximum value for a chart
As you enter numbers in your chart, a maximum value will automatically be set, or you can set a maximum value of your own. The top value will automatically round up from the top value of the data you are entering. Depending on your data, it will be rounded to the nearest ten, hundred, or thousand.
To set a maximum value:
- Double-click a value on the side of the chart.
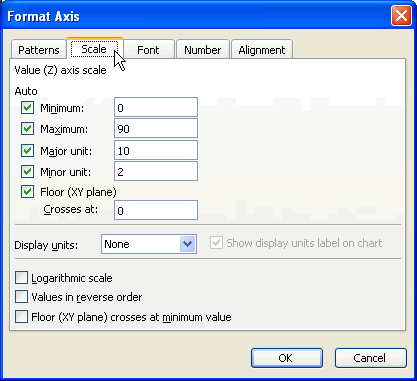
- The Format Axis dialog box appears.
- Click the Scale tab.

- Change the number for Maximum to the maximum number in your presentation, such as 100.

- Click OK.


