PowerPoint 2003
Adding Charts, Diagrams, and Tables
Inserting a chart
PowerPoint allows you to insert charts into your slide presentation to display different types of information for your audience.
To insert a chart:
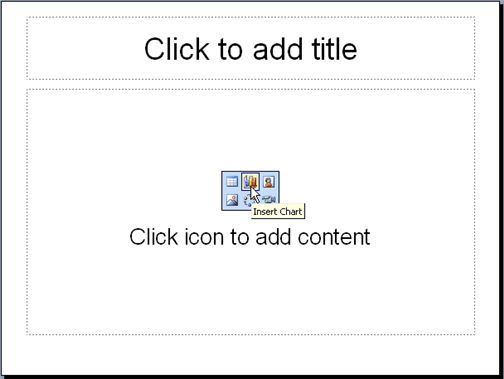
- Insert a new slide with a title and chart icon.
- When the slide appears, click the Insert Chart icon.

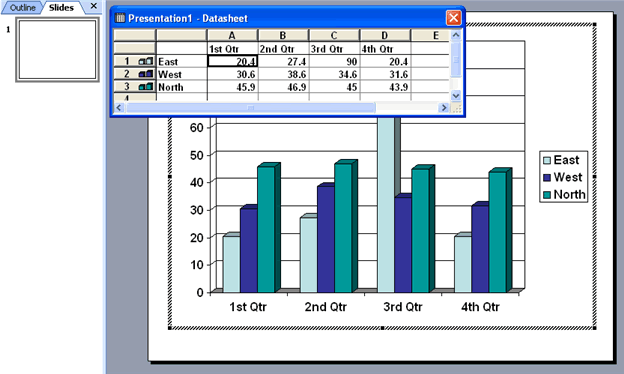
- A chart appears with a data sheet and sample data.

- Replace the sample data in the data sheet with actual data you want to present. The Y axis is for values or numbers, like the number of hours worked or amount of money earned. The X axis is the label for the information. It now reads East, West, and North.
- You can delete some information in columns or rows of the sheet. Right-click the row or column and choose Cut, Delete, or Clear Contents.
- NOTE: You can expand the chart columns to fit your data or titles. Place your mouse pointer over the end of the column in the gray heading. A black cross with double arrows appears. Right-click and drag the columns to the size you want.
- To format column width, click Format
 Column width.
 - Notice as you enter new data and titles that the chart on the slide changes to show this new information.
 If the datasheet disappears, double-click the chart and choose View
  Datasheet.


