

Excel 2010
Creating PivotTables
PivotTables
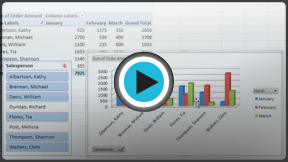
Video: PivotTables in Excel 2010: Part 1
 Watch the video (4:16).
When you have a lot of data, it can sometimes be difficult to analyze all of it. A PivotTable summarizes the data, making it easier to manage. Best of all, you can quickly and easily change the PivotTable to see the data in a different way, making this an extremely powerful tool.
Video: PivotTables in Excel 2010: Part 2
 Watch the video (2:59).
Using PivotTables to answer questions
The example below contains sales statistics for a fictional company. There is a row for each order, and it includes the order amount, the name of the salesperson who made the sale, the month, the sales region, and the customer's account number.
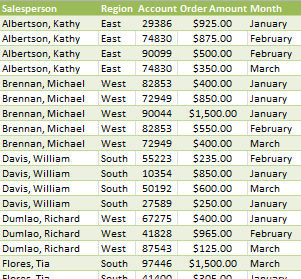 Company Sales Statistics
Suppose we wanted to answer the question, "What is the amount sold by each salesperson?" This could be time consuming, as each salesperson appears on multiple rows, and we would need to add up all of the order amounts for each salesperson. Of course, we could use the Subtotal feature to add them, but we would still have a lot of data to sift through.
Luckily, a PivotTable can instantly do all of the math for us and summarize the data in a way that's not only easy to read but also easy to manipulate. When we're done, the PivotTable will look something like this:
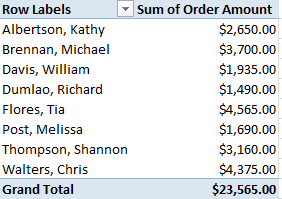 A finished PivotTable
As you can see, the PivotTable is much easier to read. It only takes a few steps to create one, and once you create it you'll be able to take advantage of the PivotTable's powerful features.


