

Excel 2010
Working with Sparklines
Changing the display range
By default, each sparkline is scaled to fit the maximum and minimum values of its own data. This allows it to fill the entire cell, no matter how high or low the values are. However, it has a downside: If you are trying to compare several sparklines, you won't be able to tell at a glance which ones have higher or lower values. The solution is to make the display range the same for all of the sparklines.
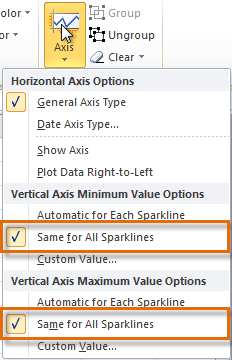
To change the display range:
- Select the sparklines you want to change.
- In the Design tab, click the Axis command. A drop-down menu will appear.
- Under Vertical Axis Minimum Value Options and Vertical Axis Maximum Value Options, select Same for All Sparklines.
 Changing the range of the sparklines
 - The sparklines will update to reflect the new range.
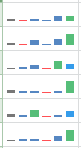 The updated sparklines


