Correlational studies are used to show the relationship between two variables. Unlike experimental studies, however, correlational studies can only show that two variables are related—they cannot determine causation (which variable causes a change in the other). A correlational study serves only to describe or predict behavior, not to explain it. In psychological research, it is important to remember that correlation does not imply causation; the fact that two variables are related does not necessarily imply that one causes the other, and further research would need to be done to prove any kind of causal relationship.
Positive and Negative Correlations
The attributes of correlations include strength and direction. The strength, or degree, of a correlation ranges from -1 to +1 and therefore will be positive, negative, or zero. Direction refers to whether the correlation is positive or negative. For example, two correlations of .78 and -.78 have the exact same strength but differ in their directions (.78 is positive and -.78 is negative). In contrast, two correlations of .05 and .98 have the same direction (positive) but are very different in their strength. Although .05 indicates a relatively weak relationship, .98 indicates an extremely strong relationship between two variables. A correlation of 0 indicates no relationship between the variables.
A positive correlation, such as .8, would mean that both variables increase together. You might expect to see a positive correlation between high school GPA and college GPA—in other words, that those students with high grades in high school will also tend to have high grades in college.
A negative correlation, such as -.8, would mean that one variable increases as the other increases. You might expect to see a negative correlation between the amount of partying the night before a test and the score on that test—in other words, that more partying relates to a lower grade.
Correlational Strength
It is extremely rare to find a perfect correlation between two variables, but the closer the correlation is to -1 or +1, the stronger the correlation is.
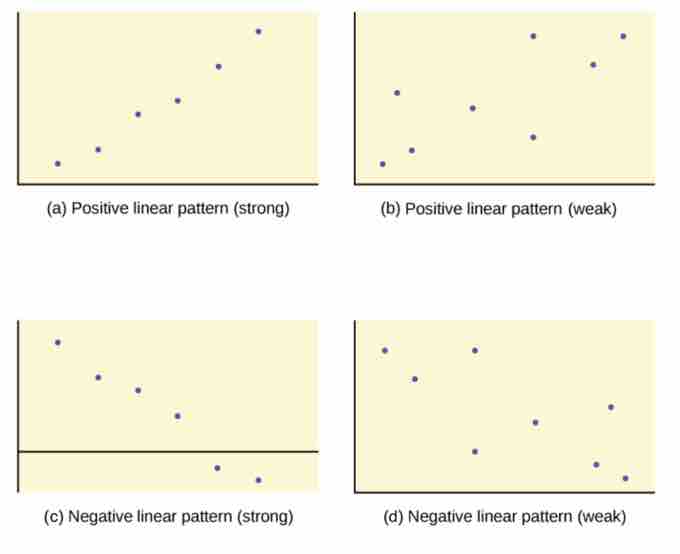
Correlations of varying directions and strengths
Panels (a) and (b) show the difference between strong and weak positive linear patterns—the strong pattern more closely resembles a straight line. The same is true for panels (c) and (d)—the strong negative linear pattern more closely resembles a straight line than does the weak negative pattern. Finally, comparing panels (a) and (c) shows the difference between positive and negative linear patterns—a positive linear pattern slopes up (both variables increase at the same time), and a negative linear pattern slopes down (one variable decreases while the other increases).
Statistical Significance
Statistical testing must be done to determine if a correlation is significant. Even a seemingly strong correlation, such as .816, can actually be insignificant due to a variety of factors, such as random chance and the size of the sample being tested. With smaller sample sizes, it can be easy to obtain a large correlation coefficient but difficult for that correlation coefficient to achieve statistical significance. In contrast, with large samples, even a relatively small correlation of .20 may achieve statistical significance.
Benefits of Correlational Research
An experiment is not always the most appropriate approach to answering a research question. Sometimes it is not possible to carry out a true experiment for practical or ethical reasons because it is impossible to manipulate the independent variable. If a researcher was to look at the psychological effects of long-term ecstasy use, it would not be ethical to randomly assign participants to a condition of long-term ecstasy use. An experiment is also not feasible when examining the effects of personality and individual differences since participants cannot be randomly assigned into these categories. Correlational research allows a researcher to determine if there is a relationship between two variables without having to randomly assign participants to conditions.
The strength of correlational research is its predictive capabilities. With a large sample size, you can use one variable to predict the likelihood of the other when there is a strong correlation between the two. For instance, you could take two measurements from 1,000 families—whether the father is an alcoholic and whether a son is an alcoholic—and calculate the correlation. If there is a strong correlation between the two measurements, it will allow you to predict, within certain limits of probability, what the chances are that the son of an alcoholic father will also have a problem with alcohol.
Limitations of Correlational Research
A correlational study serves only to describe or predict behavior, not to explain it. Always remember that correlation does not imply causation. Since there is no random assignment to conditions, a researcher cannot rule out the possibility that there is a third variable affecting the relationship between the two variables measured. Even if there is no third variable, it is impossible to tell which factor is influencing the other. Only experimental research can determine causation. In the above example, while a research could predict the likelihood of an alcoholic father having an alcoholic son, they could not describe why this was the case.
An excellent example used by Li (1975) to illustrate the "third variable" problem is the positive correlation in Taiwan in the 1970's between the use of contraception and the number of electric appliances in one's house. Of course, using contraception does not induce you to buy electrical appliances or vice versa. Instead, the third variable of education level affects both.
Another popular example is that there is a strong positive correlation between ice cream sales and murder rates in the summer. As ice cream sales rise, so do murder rates. Is this because eating ice cream makes us want to murder people? The actual explanation is that when the weather is hot, more people buy ice cream, but they also go out more, drink more, and socialize more, leading to an increase in murder rates. Extreme temperatures observed in the summer also have been shown to increase aggression. In this case, there are many other variables at play that feed the correlation between murder rates and ice cream sales.