PowerPoint 2007
Working with Charts
Modifying the chart layout
To change the chart layout:
- Select the chart.
- Select the Design tab.
- Scroll through the options in the Chart Layout group, or click the More drop-down arrow to see all available chart layout options.
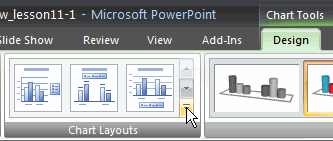
- Click a chart layout to select it. The chart layout will change on the slide.
The chart layout determines how specific chart information will appear. For example, some layouts include chart titles, legends, and axis labels.
To modify specific areas of the chart layout:
- Select the chart.
- Select the Layout tab.
- Locate the Labels group.
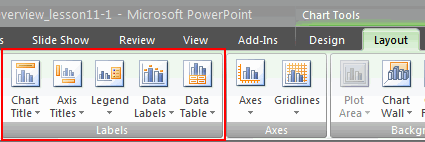
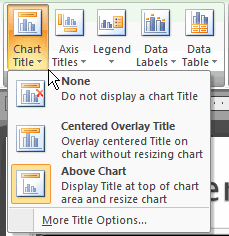
- Chart Title: Click this command to remove or add a chart title.
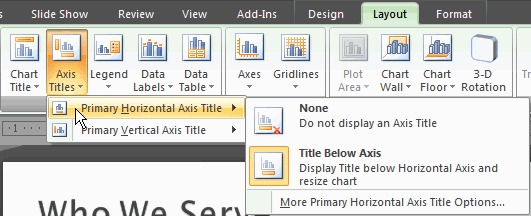
- Axis Titles: Click this command and choose to hide or display the horizontal, or X axis, label; hide or display the vertical, or Y axis, label; and change the direction of the axis labels to horizontal or vertical.
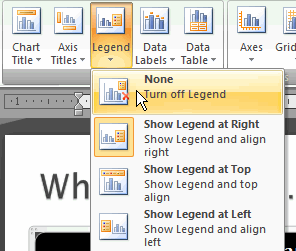
- Legend: Click this command to select a location for the legend to appear, or choose to not display a legend.
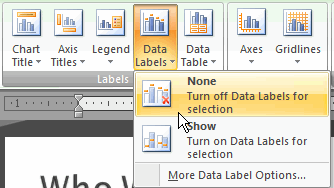
- Data Labels: Click this command to display or hide data values next to each chart element.
Other important commands on the Layout tab
In the Axes group, there are several commands that control both axes and whether the gridlines are visible. In the Background group, there are several commands that control visual aspects of the chart. Some commands in the Analysis group will appear active only if the selected chart is a line, area, or bubble chart.

Additional chart formatting
Use the commands on the Format tab to modify the chart in additional ways. For example, from this tab you can change the chart outline, format chart text as WordArt, and perform other functions.


