PowerPoint 2007
Working with Charts
Inserting Charts
Watch the video! (8:53 min)
Download the example to work along with the video.
To insert a chart:
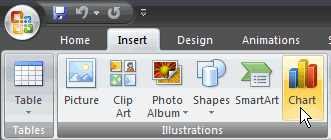
- Select the Insert tab.
- Click the Insert Chart command. The Insert Chart dialog box appears.
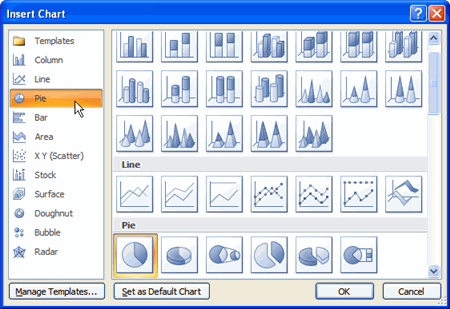
- Click and drag the scroll bar to view the chart types, or click a label on the left of the dialog box to see a specific chart style.
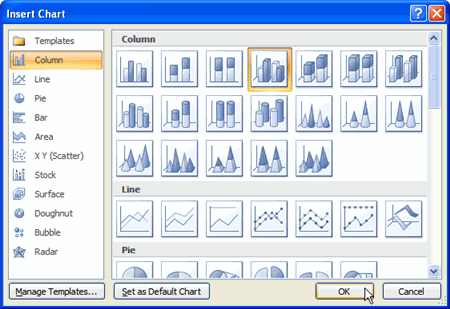
- Click a chart to select it.
- Click OK. Excel will open. Usually, Excel will appear on one side of the screen, while PowerPoint appears on the other side of the screen.
If a slide layout has a content placeholder, click the Insert Chart command to insert a new chart.
Enter chart data
The data that appears in the Excel spreadsheet is placeholder source data that you will replace with your own information. The Excel source data is used to create the PowerPoint chart.
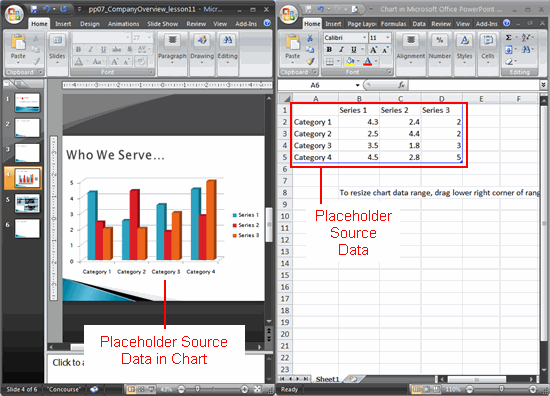
To enter chart data:
- Select a cell in the Excel spreadsheet.
- Enter your data in the cell. If the cell contains placeholder data, the placeholder data will disappear. As you enter your data, it will appear in the Excel spreadsheet and the PowerPoint chart.
- Move to another cell.
- Repeat the above steps until all of your data is entered.
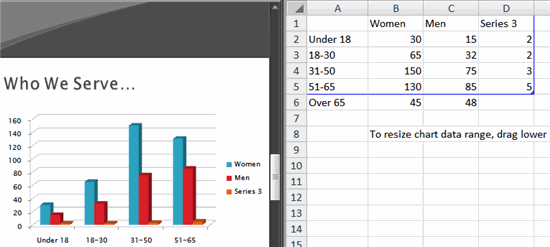
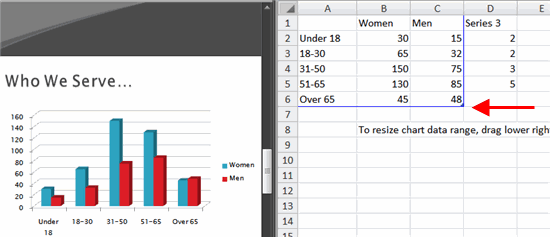
- Click and drag the lower-right corner of the blue line to increase or decrease the data range for columns. The data enclosed by the blue lines will appear in the chart.
- Click and drag the lower-right corner of the blue line to increase or decrease the data range for rows.
- Select any cells with placeholder data remaining. In the example, the column with Series 3 data was not needed.
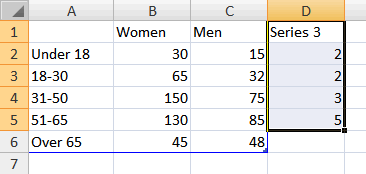
- Press the Delete key to delete the remaining placeholder data.
- Close Excel. You do not need to save the spreadsheet. The new Excel source data appears in the PowerPoint chart.


