PowerPoint 2007
Working with Charts
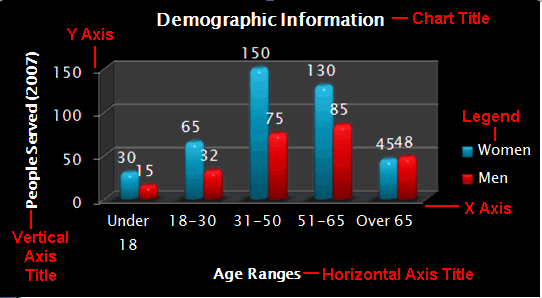
Identifying the parts of a chart
Have you ever read something you didn't fully understand, but when you saw a chart or graph the concept became clear and understandable? Charts are a visual representation of data. They make it easy to see comparisons, patterns, and trends in the data.

Source data
The range of cells that make up a chart. The chart is updated automatically whenever the information in these cells change.
Title
The title of the chart.
Legend
The chart key, which identifies what each color on the chart represents.
Axis
The vertical and horizontal parts of a chart. The vertical axis is often referred to as the Y axis, while the horizontal axis is referred to as the X axis.


