

Excel 2013
Sparklines
Changing the display range
By default, each sparkline is scaled to fit the maximum and minimum values of its own data source: The maximum value will go to the top of the cell, while the minimum will go to the bottom. However, this doesn't show how high or low the values are when compared to the other sparklines. Excel allows you to modify the sparkline display range, which makes it easier to compare sparklines.
To change the display range:
- Select the sparklines you want to change.
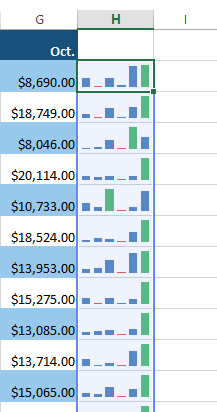 Selecting a group of sparklines
 - From the Design tab, click the Axis command. A drop-down menu will appear.
- Below Vertical Axis Minimum Value Options and Vertical Axis Maximum Value Options, select Same for All Sparklines.
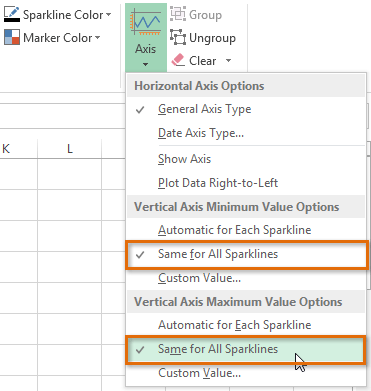 Modifying the sparklines' display range
 - The sparklines will update to reflect the new display range. In our example, we can now use the sparklines to compare trends for each salesperson.
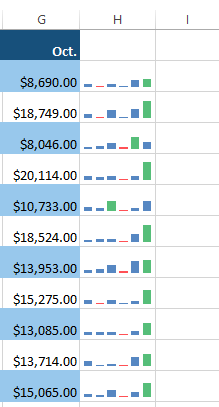 The updated display range


