

Excel 2010
Outlining Data
Creating your own groups
The Group command allows you to group any range of cells—either columns or rows. It does not calculate a subtotal or rely on your data being sorted. This gives you the ability to show or hide any part of your worksheet and display only the information you need.
To create and control your own group:
In this example, we will prepare a list of T-shirt colors and sizes that need to be distributed to each homeroom. Some of the data in the worksheet is not relevant to the distribution of T-shirts; however, instead of deleting it, we will group it, then temporarily hide it from view.
- Select the range of cells you want to group. In this example, we will group the First Name, Last Name, and Payment columns.
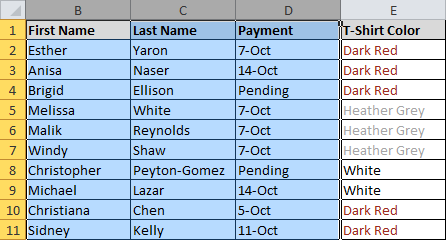 Selecting a range of cells to group
 - From the Data tab, click the Group command.
 Grouping the selected cells
 - Excel will group the selected columns or rows.
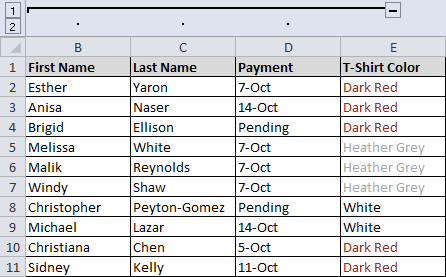 Grouped cells
 - Click the minus sign, also known as the Hide Detail symbol, to hide the group.
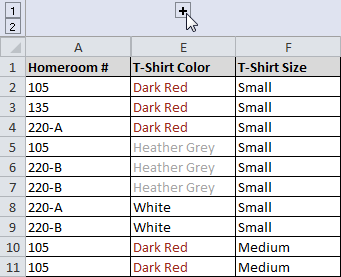
- The group will be hidden from view.
 Click to show a hidden group
Click the plus sign, also known as the Show Detail symbol, to show the group again.


