Excel 2000
Editing Charts
Formatting the Value and Category Axis
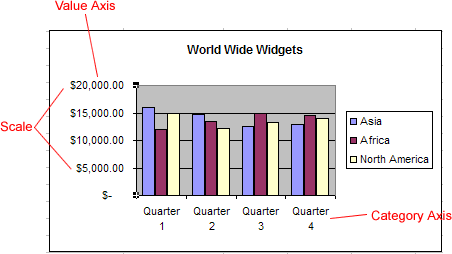
You have several options when formatting the Value and Category Axis of your chart. In addition to changing font, color, and style, you can also adjust the numbers on the Scale of the chart.

To format a Chart Axis:
- Select the Axis that you wish to edit.
- Click the Format Button
 on the Chart Toolbar (or double click the chart axis).
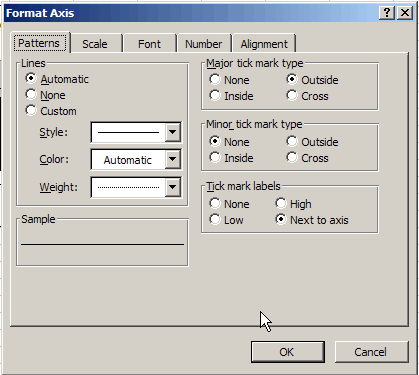
 - Use the different tabs of the Format Axis dialog box to apply formatting.
- Click OK.

![]() You can also use the angle axis buttons
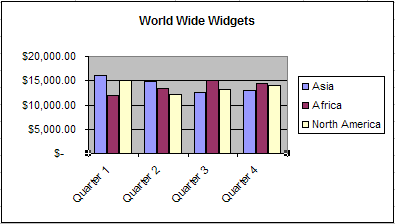
You can also use the angle axis buttons  on the chart toolbar to change the angle of the value and category axis.


