Excel XP
Creating a Chart
Creating an Embedded Chart
Charts can be created in either of two ways in Excel XP: Embedded Charts and a Chart Sheet. Excel creates an embedded chart by default. An embedded chart is placed on the same worksheet as the source data used to create it.
To Embed a Chart in a Worksheet:
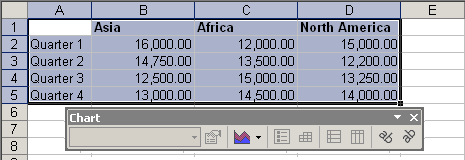
- Choose View
 Toolbars
  Chart on the menu bar.
 - Select the range of cells that you want to chart. Your source data should include at least three categories or numbers.

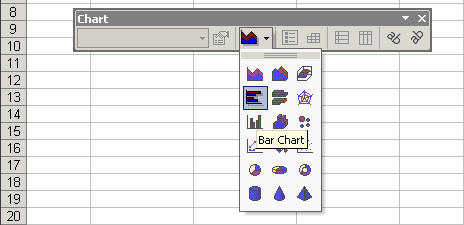
- Click the chart type pull down on the chart toolbar and select the chart that you would like to use.

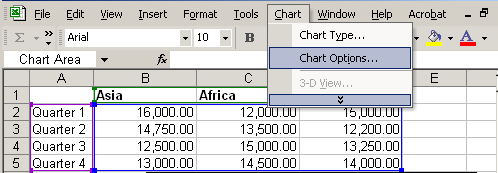
- Open the chart options dialog box: Chart
 Options to add a title to your chart.

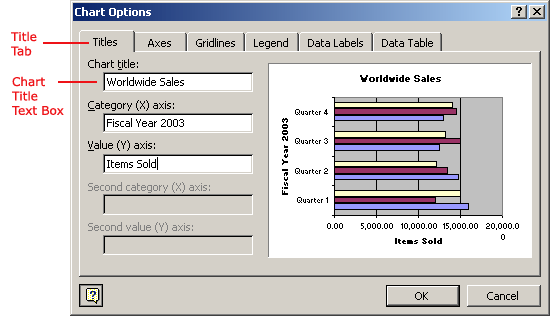
- Select the Titles tab and type the title of the chart in the Chart Title text box.

 Different charts work best with different data. A pie chart, for example, can only display one data series at a time.
 Excel XP includes a 4-step Chart Wizard that you can use to guide you through the steps for creating a chart. Highlight the cell range you want to chart, choose Insert
  Chart on the menu bar and follow the instructions in the wizard.


