Excel 2007
Creating Pivot Tables
Moving, or pivoting, data:
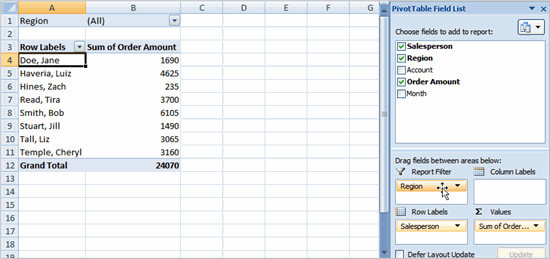
- Click and drag a field from one area to another.

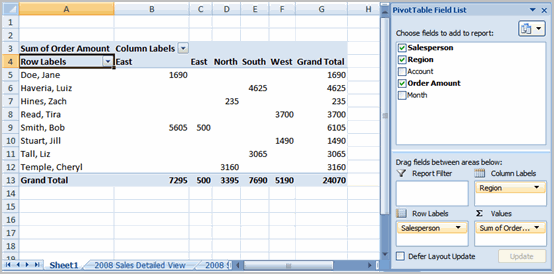
- Release the mouse button to drop the field in the new area. In this example, we move Region from Report Filter to Column Label. The PivotTable report will change.

OR
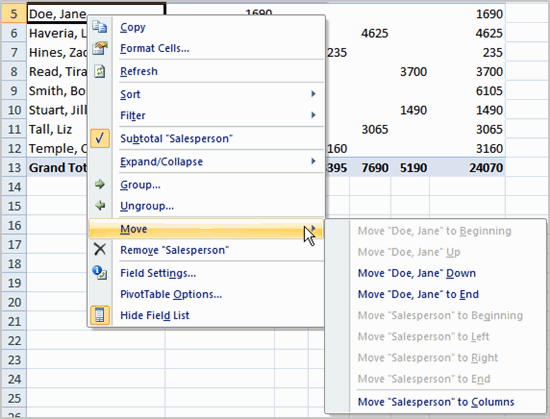
- Right-click one of the rows. A menu will appear.
- Select Move, then select a move option.

To create a PivotChart
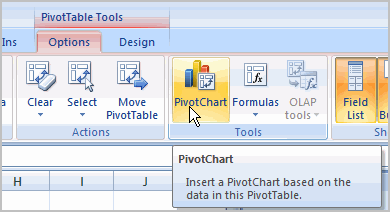
- Select the PivotChart command from the Options tab. The Insert Chart dialog box appears.

- Select the chart you’d like to insert.
- Click OK. The chart will now appear on the same sheet as the PivotTable.
The information in the chart includes the information in the PivotTable rather than all of the original source data.


