Excel 2007
Working with Charts
Chart tools
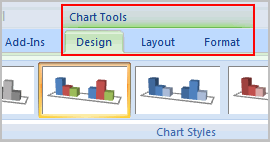
Once you insert a chart, a new set of Chart Tools, arranged into three tabs, will appear above the Ribbon. These are only visible when the chart is selected.

To change the chart type:
- Select the Design tab.
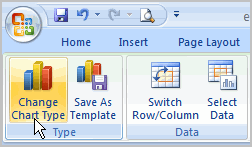
- Click the Change Chart Type command. A dialog box appears.

- Select another chart type.
- Click OK.
The chart in the example compares each salesperson's monthly sales to his or her other months' sales; however, you can change what is being compared. Just click the Switch Row/Column Data command, which will rotate the data displayed on the x and y axes. To return to the original view, click the Switch Row/Column command again.
To change chart layout:
- Select the Design tab.
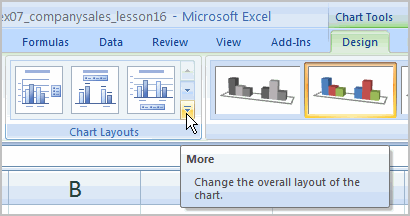
- Locate the Chart Layouts group.
- Click the More arrow to view all of your layout options.

- Left-click a layout to select it.
If your new layout includes chart titles, axes, or legend labels, just insert your cursor into the text and begin typing to add your own text.


