Excel 2007
Working with Charts
Charts
Watch the video! (9:25 min)
Download the example to work along with the video.
Creating a chart
Charts can be a useful way to communicate data. When you insert a chart in Excel, it appears in the selected worksheet with the source data by default.
To create a chart:
- Select the worksheet you want to work with. In this example, we use the Summary worksheet.
- Select the cells you want to chart, including the column titles and row labels.
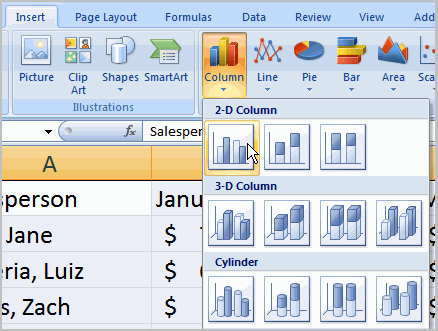
- Click the Insert tab.
- Hover over each Chart option in the Charts group to learn more about it.
- Select one of the Chart options. In this example, we'll use the Columns command.
- Select a type of chart from the list that appears. For this example, we'll use a 2-D Clustered Column. The chart appears in the worksheet.


