Excel 2003
Creating a Chart
Challenge!
- Open your Monthly Budget file.
- Type your income for the month of March in D17.
- Type your expenses for the month of March in the appropriate cells of column D.
- The Total Expenses and Savings will be calculated for you because of the formula in each cell.
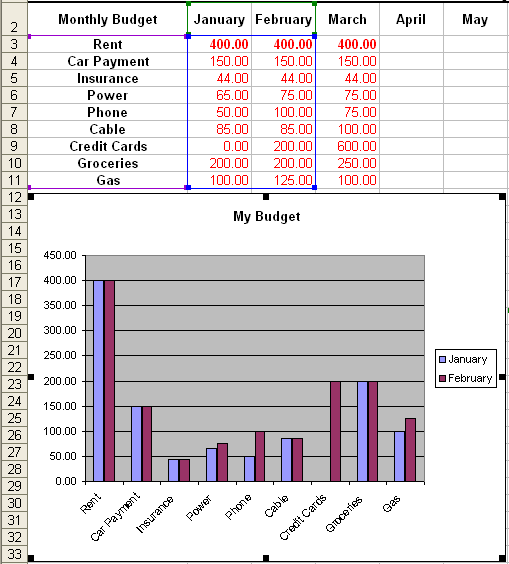
- Create an embedded column chart using the expense data for the months of January and February.
- Important: Do not include the data for rows 16 through 18, and do not include the data for the month of March.
- Create a title for your chart and name it My Budget.
An example:

- Save and close the document.


