Excel 2003
Creating a Chart
Creating a chart using the Chart Toolbar
Charts can be created in a number of ways in Excel 2003. The quickest way to create and edit your charts is to use the Chart Toolbar.
To show the Chart Toolbar:
- Choose View
 Toolbars
  Chart on the menu bar.

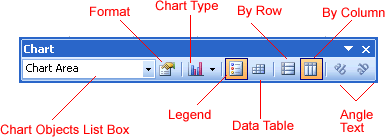
Parts of the Chart Toolbar:

Chart objects list box
This list box lets you select different parts of a chart for editing.
Format chart area
This is used to format the part of the chart that is currently selected.
Chart type
This is a drop-down menu that lets you select different types of charts. The chart type can be changed at any time.
Legend
This is used to show or hide the chart legend.
Data table
This is used to show or hide the actual source data that is used to create the chart.
By row
This plots the data series using the row labels (Y-axis).
By column
This plots the data series using the column labels (X-axis).
Angle text
This is used to rotate the angle of the X-axis and Y-axis labels.


