Diagram Remix
Mini Challenge Summary
Summary: Construct a diagram with reusable scalable vector graphics (SVG) images Time: 1.5 to 2 hours. The static image is the first modality of this learning pathway on creating media.
Stimulus Resources
- Types of diagrams: see General Diagram Types
- Scalable Vector Graphics (SVG) article
- 10 Tips for Creating Good Looking Diagrams Using Inkscape.
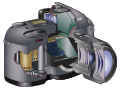
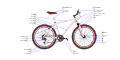
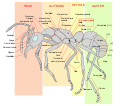
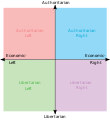
Examples of SVG images from the Wikimedia Commons. Click on the image for metadata and download the link.


.svg/120px-Flag_of_New_Zealand_(3-2_aspect_ratio).svg.png)


Purpose
This challenge will help you generate a graphic, diagram, or chart for reuse in a presentation using the scalable vector graphics (SVG) file format.
This exercise will help you:
- Create editable images using an open file format, which will allow you to reuse the material, such as to translate diagram labels;
- Remix and reuse existing OER image assets;
- Use the SVG file format, which allows you to resize images without losing image quality.
Tasks
- Visit the Inkscape homepage, and download and install the official release package for your operating system.
- We recommend using an official release package.
- Make sure you download the version for the operating system on your computer, i.e. Windows, Mac, or Linux.
- If you are not sure how to install software, search “How to Install Inkscape.”
- If you prefer to use slideshow software, try using LibreOffice Impress, which is part of the LibreOffice suite. You can download and install the latest stable version according to the operating system on your computer. LibreOffice supports the import and export of SVG files (see here).
- Other software options:
- Gravit Designer is a free, proprietary, vector-based authoring solution where you can work online or download local versions of the software.
- Feel free to use any software package that allows you to import and export of open SVG file formats.
- Launch Inkscape, Gravit Designer or your preferred tool and explore the software.
- If you are new to using graphics software, search YouTube for Inkscape tutorials. You will find extensive resources, such as the Derek Banas introduction to Inkscape tools, or the playlist for Inkscape tutorials for beginners from Davina and Caroline.
- While we do not expect you to become an intermediate or advanced user of graphics software, basic skills include the ability to add text, squares, and rectangles; change colors; and import/export SVG graphics.
- Conceptualize a chart, diagram, or graphic to include in the diagram you are creating.
- Revisit the stimulus resources above to generate ideas.
- Draft a freehand version of your concept for your diagram on paper.
- Search for SVG graphics you want to copy, reuse, and remix to include in your diagram. You can:
- Search Wikimedia Commons, and include the string “SVG” in your search. The category SVG icons is a good starting point.
- Search openclipart.org, a large collection of clipart you can download in SVG format.
- Search the internet for openly licensed SVG images.
- Record the URLs of the pages for the SVG graphics you wish to download, the names of the authors. and the type of license types for the images. You will need this information to give attribution for your derivative work.
- See the attribution of the SVG icons for this graphic which illustrates the structure of an OERu course. Note that this is a SVG graphic you can download, modify, and reuse.
- Download and save the SVG graphics you want to reuse and incorporate in your diagram.
- Remember to record the URL and relevant metadata for attribution in your derivative work.
- Please share your process with our community by posting on the course forums.
Outputs
- Create a graphic, diagram or chart for use in a presentation using Inkscape (or alternative software) which supports SVG graphics. Your graphic must:
- Incorporate at least two openly-licensed SVG files, which you have downloaded and imported into your graphic for remix. You are free to change colors and remove elements from the source graphic(s). For attribution purposes remember to keep information on the metadata and source URLs of the images you reused.
- Prepare a blog post (150–200 words) where you:
- Upload the image to your blog with proper attribution of the source SVG files you used.
- Share a brief reflection of your experiences designing and publishing the graphic.
Last modified: Thursday, February 7, 2019, 11:06 AM