 Print book
 Print this chapter
Process-Oriented Design
The goal of design is to map the requirements of the application to a hardware and software environment. The result of process-oriented analysis – data flow diagrams, data dictionary entities, and so on – is translated into detailed specifications for hardware and software. The main output of process-oriented design includes structure charts, physical databases, and program specifications.
In this chapter, you will learn about the concepts and terminologies for process-oriented design and the steps of process-oriented design, including transaction analysis, transform analysis, and structure charts, as well as physical database design, program packages, and program design. You will also learn about the strengths
and weaknesses of process-oriented design.
4. Process Design Activities
4.3. Complete the Structure Chart
Rules for Completing the Structure Chart
Completion of the structure chart includes adding data and control couples and evaluating the diagram.
|
Get Valid Rental. For all customer Get customer # Read Customer File If not present, Cancel else Create customer Display Customer info. Read Open-Rentals For all Open Rentals, Compute late fees Add price to total price Display open rentals Display total price. For all video Read Video file If not present Cancel this video else |
Create Video Display Video Add price to total price Display total price. Process Fees and Money. Get amount paid.
Subtract total from about paid giving change. Display change. If change = zero and total = zero, mark all items paid
else
go to process fees and money.
Create and Print Rental. For all open rentals
if item paid
rewrite open rental.
For all new rentals write new open rental.
Print screen as rental confirmation. |
|---|
FIGURE 8-24 ABC Rental Pseudo-code
|
Get Valid Rental. Get Valid Customer.
For all customer
Get customer #
Read Customer File
If not present,
Cancel
else
Create customer
Display Customer info.
Get Open Rentals. Read Open-Rentals
For all Open Rentals,
Compute late fees
Add price to total price
Display open rentals
Display total price.
Get Valid Video. For all video
Read Video file
If not present
Cancel this video
else Call Create Video
|
Display Video Add price to total price Display total price. Process Fees and Money. Get amount paid.
Subtract total from about paid giving change.
Display change.
If change = zero and total = zero,
mark all items paid
else
go to process fees and money.
Create and Print Rental. Update open rentals.
For all open rentals
if item paid
rewrite open rental.
Create New Rentals. For all new rentals
write new open rental.
Print screen as rental confirmation.
|
|---|
FIGURE 8-25 ABC Rental Pseudo-code Refined
| Get Valid Rental. | |
|---|---|
|
Get entry. If entry is Video Call Return
else
Call Rental.
Rental. Get Valid Customer.
For all customer
Get customer #
Read Customer File
If not present,
Cancel
else
Create customer
Display Customer info.
Get Open Rentals.
Read Open-Rentals
For all Open Rentals,
Compute late fees
Add late fees to total price Display open rentals
Display total price. Get Valid Video. For all video
Read Video file
If not present
Cancel this video
|
else Call Create Video Display Video Add price to total price Display total price, change. Process Fees and Payment.
Create and Print Receipt Return.
Get Open Rental.
Read Open-Rentals
Read Customer
Display Customer
Display Open Rental
Add return date.
Using customer ID, Read Open Rentals.
For all Open Rentals
Display open rentals. For all return request
Add return date to rental
Compute late fees
Add late fees to total price
Display total price
If rental
Call Get Valid Video.
Call Process Fees and Payment. Call Create and Print Receipt. |
FIGURE 8-26 Get Valid Rental Pseudo-code with Control Structure for Returns
Structure chart completion rules are:
1. For each data flow on the DFD add exactly one data couple. Use exactly the same data flow name for the data couple.
2. For each control module, decide how it will control its subs. If you need to refine the pseudo-code to decide control, do this. Add control couples to the diagram when they are required between modules.
3. For modules that select one of several paths for processing, show the selection logic with a diamond in the module with the logic attached to the task transfer line.
Rules of thumb for developing the structure chart are:
1. Evaluate the diagram for cohesion. Does each module do one thing and do it completely?
2. Evaluate the diagram for fan-out, fan-in, skew, and redesign as required, adding new levels of control. Note skewed processing for attention during program design.
3. Evaluate the diagram for minimal coupling. Is the same data used by many modules? Do control modules pass only data needed for processing? Do control modules minimize their scope of effect?
These are all discussed in this section.
First, the structure chart is drawn based on the decomposition exercises. Then data couples are added to the diagram for each data flow on the DFD. If the structure chart is at a lower level of detail, use the data flow as a starting point and define the specific data passed to and from each module. Show all data requirements for each module completely. Make sure that all names are exactly as they are in the dictionary.
| Get Valid Rental. | Get Valid Video. |
|---|---|
|
Get entry.
If entry is Video Call Return
else
Call Rental.
Call Get Valid Customer. Return. Call Get Open Rentals. Call Get Valid Video Call Get First Return.
Call Get Open Rentals. If rental Call Get Valid Video.
Process Fees and Money. Create and Print Rental. Update Open Rentals. Create New Rentals. Print receipt. Get Valid Customer. Get customer #
Read Customer File If not present, Create Customer.
If CCredit not zero, display CCredit Display Customer info Get Open Rentals. Read Open-Rentals
For all Open Rentals, Compute late fees
Add late fees to total price
Display open rentals
Display total price, change.
For all return request
Call Update Returns. |
For all video
Read Video file
If not present
Cancel this video
else
Call Create Video
Display Video
Add price to total price
Display total price, change.
Get First Return. Read Open-Rentals Read Customer Display Customer Display Open Rental Call Update Returns. Update Returns. Move return date to rental.
Update video history. Compute late fees. Add late fees to total price. Display total price. Process Fees and Money. Get amount paid.
Subtract total price from about paid giving change. Display total price, change. If change = zero and total = zero, mark all items paid
else
go to process fees and money.
Update Open Rentals. For all open rentals
rewrite open rental.
Create New Rentals. For all new rentals
write new open rental.
|
FIGURE 8-27 Complete Pseudo-code for Rentals and Returns
Next, for each control module, decide how it will control its subprocesses and add the control couples to the diagram. Decide whether the logic will be in the control module or in the subprocess. If the logic is in the control module, the goal is for
the controller to simply call the subordinate module, pass data to transform, and receive the transform's data back. If any other processing takes place, rethink the control process because it is not minimally coupled.
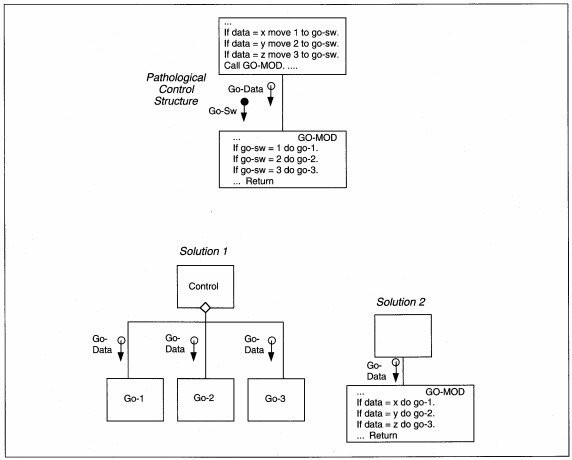
FIGURE 8-28 Pathological Control Structure and Two Solutions
A control couple might be sent to the subprocess for it to determine what to do. This mayor may not be okay. Where is the control couple 'set' and 'reset'? If in the control module, this is acceptable. If somewhere else, rethink the control process and
simplify it. Any time you must send a control couple for a module to decide which action to take, you identify a potential problem. The lower-level module may be doing too many things; otherwise it would not need to decide what to do, or the control
may be in the wrong module.
An example of this problem and two solutions are illustrated in Figure 8-28. If the lower level is doing too many things, then decompose them to create several single-purpose modules. If the lower level is not doing multiple functions, then move control for the module into the module itself. In both cases, the goal of minimal coupling is attained.
Next, the diagram is evaluated for cohesion, coupling, hierarchy width, hierarchy depth, fan-out, fan-in, span of control, and skew. Evaluate the diagram for cohesion (see Table 8-2 for definition of cohesion types). Check that each module does one thing and does it completely. If several modules must be taken together to perform a whole function, the structure is excessively decomposed. Regroup the processes and restructure the diagram.
Evaluate the diagram for width, depth, fan-out, fan-in, and skew. These are visual checks to see if some portion of the structure is inconsistent with the rest of the structure. The inconsistency does not necessarily mean that the diagram is wrong, only
that there may be production bottlenecks relating to the out-of-balance processes. For a wide structure, double check that the subprocesses really all relate to one and only one process. If not, add a new control module, else leave as is.
For deep structures, check to see if each level of depth is performing some function beyond control. Ask yourself why all the levels are needed. If there is no good reason, get rid of the level and move its functions either up or down in the hierarchy, preferably up. Ask yourself if fewer levels can accomplish the same process. If the answer suggests reducing the levels of hierarchy, restructure the diagram and keep only essential levels.
For fan-in modules, check that each using module has the same type of data being passed and expects the same type of results from the fan-in module. If there are any differences, then either make the using modules consistent, or add a new module to replace
the fan-in module for the inconsistent user module.
Skewed diagrams identify a fundamental imbalance of the application that may have been hidden before: that it is input-bound, output-bound, 1/0- bound, or process-bound. Skew is not necessarily a problem that results in restructuring a diagram. When skewed processing is identified, you should verify that it is not an artifact of your factoring. If it is, remove the skew from the diagram by restructuring the modules.
Skew is not always a problem. When a skewed application is being designed, the designers normally spend more time designing the code for the bound portion of the problem to ensure that it does not cause process inefficiencies. For instance, Fortran is notoriously inefficient at physical input/output (i.e., reading and writing files). For anything but a process-bound application, Fortran is not the best language used. For a process-bound Fortran application, with many I/Os, another language, such as assembler or Cobol, might be used to make read/ write processing efficient. The opposite is true of Cobol. Cobol is not good at high precision, scientific, mathematical processing. In a Cobol application, process-bound modules and their data would be designed either for another language, or to minimize the language effects.
Finally, evaluate the diagram for minimal coupling. First look at data couples. If you see the same data all over the diagram, there may be a problem. Either you are not specifying the data at the element level, or data coupling is the least coupling you will be able to attain. Make sure that only needed data is identified for passing to modules. Data coupling is not the best coupling, but it is tolerable.
Next look at control couples one last time. Make sure that they are set and reset in the same or directly-related modules, and make sure that, if passed, they are passed for a reason. If either of these conditions are violated, change the coupling.
To summarize so far, decide the system concept; partition the DFD; develop a first-cut structure chart; decompose the structure chart using pseudo-code of the functions as needed to guide the process; add data couples; add control couples; evaluate and
revise as needed.
ABC Video Example Structure Chart
ABC's structure chart will begin with the Levell DFD factoring and progress to provide the detail for modules as expressed in the pseudo-code. There are three first level modules: Get Valid Rental, Process Fees & Money, and Create and Print Rental (see Figure 8-~9). To get the next level of detail, we use the pseudo-code or decomposed structure charts. In our case, we use the pseudo-code. In Figure 8-27, the high level pseudo-code has only module names. We simply transfer those names to modules on the structure chart, attending to the control logic present in the diagram.
For each if statement, we need to decide whether that statement will result in a direct call (our choice, here) or whether it will result in a control couple being passed. Direct calls are preferred to minimize coupling. When a direct call is used, the
module is executed in its entirety every time it is called.
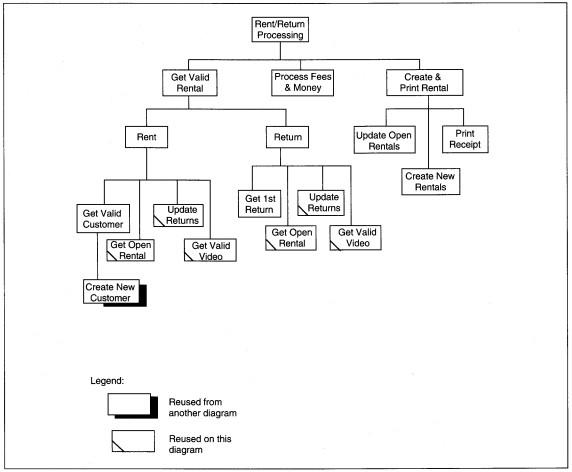
FIGURE 8-29 Rent/Return First-Cut Structure Chart
We identify reused modules by a slash in the lower left corner of the rectangles to show the complete morphology of the diagram. The first-cut structure chart shows that the processing is skewed toward input. Because there are three data stores affected by every process, there is no way to get rid of the skew without getting rid of the control level. Is the control level essential? If we omit the control level is the processing the same? Do we violate fanout if we remove the control level ? The answers are no, mostly, and no, respectively. If we remove the control level, its logic must go somewhere. The logic can move up a module and not violate fan-out. The change may have a language impact, so we will not change it until we decide program packages.
We note it for attention during packaging and programming. There are no other obvious problems with the first-cut structure chart. Since we have developed it bottom-up, using the pseudo-code as the basis, it is as good as our pseudo-code.
Next, we add the data and control couples needed to manage processing. The final diagram is shown in Figure 8-30, which we evaluate next.
Each module appears to do only one thing. The diagram is input -skewed as already discussed. The span of control and fan-out seem reasonable.
The reused modules each have the same input data. The hierarchy is not unnecessarily deep, although the control code for Get Valid Rental, Rent, and Return might be able to be combined depending on the language. Coupling is at the data level and is acceptable.
Next, we turn to designing the physical database.
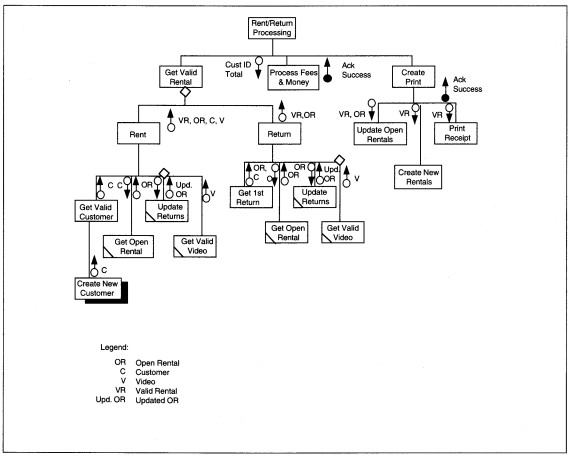
FIGURE 8-30 Completed Rent/Return Structure Chart