 Print book
Process-Oriented Design
| Site: | Saylor Academy |
| Course: | CS302: Software Engineering |
| Book: | Process-Oriented Design |
| Printed by: | Guest user |
| Date: | Friday, February 4, 2022, 6:13 PM |
Description
The goal of design is to map the requirements of the application to a hardware and software environment. The result of process-oriented analysis – data flow diagrams, data dictionary entities, and so on – is translated into detailed specifications for hardware and software. The main output of process-oriented design includes structure charts, physical databases, and program specifications.
In this chapter, you will learn about the concepts and terminologies for process-oriented design and the steps of process-oriented design, including transaction analysis, transform analysis, and structure charts, as well as physical database design, program packages, and program design. You will also learn about the strengths
and weaknesses of process-oriented design.
1. Introduction
Structured design is the art of designing system components and the interrelationships between those components in the best possible way to solve some well specified problem. The main goal of design is to map the functional requirements of the application to a hardware and software environment. The results of structured design are programming specifications and plans for testing, conversion, training, and installation. In addition, the design may result in proto typing part or all of the application. This section discusses the mapping process and the development of program specifications. The other topics are discussed in Chapter 14.
The goals of structured design, as first documented by Yourdon and Constantine [1979], have not changed much over the years. They are to minimize cost of development and maintenance. We can minimize the cost of development by keeping parts manageably small and separately solvable. We can minimize the cost of maintenance by keeping parts manageably small and separately correctable. In design we determine the smallest solvable parts as a way of managing application complexity.
Source: Sue Conger, https://learn.saylor.org/pluginfile.php/236045/mod_resource/content/2/The%20New%20Software%20Engineering.pdf
 This work is licensed under a Creative Commons Attribution 3.0 License.
2. Conceptual Foundations
The concept 'form follows function' that informed analysis is again the basis for structured design. The application processes determine the form of the application. The divide and conquer principle guides the definition of the smallest solvable parts while keeping the general goals of maintainability and low cost in mind. Partitioning and functional decomposition are the basic activities used in dividing processes into modules. The basic input-process-output (IPO) model from the DFD results in a structure chart that adds a control component to the IPO model (see Figure 8-1).
Principles of good structured design are information hiding, modularity, coupling, and cohesion. Information hiding means that only data needed to perform a function is made available to that function. The idea is a sound one: You cannot mess up what you don't have access to. Modularity is the design principle that calls for design of small, self-contained units that should lead to maintainability. Following systems theory, each module should be a small, self-contained system itself. Coupling is a measure of intermodule connection with minimal coupling the goal (i.e., less is best). Cohesion is a measure of internal strength of a module with the notion that maximal, or functional, cohesion is the goal. These principles are related to the process of design in the next section.
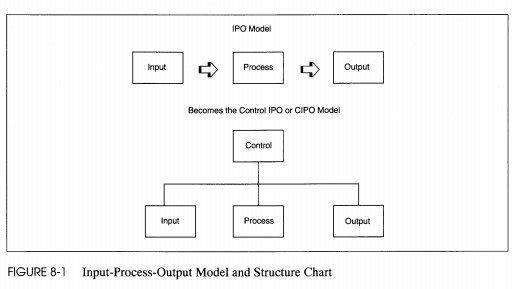
FIGURE 8-1 Input-Process-Output Model and Structure Chart
3. Definition of Structured Design Terms
TABLE 8 - 1 Structured Design Concept Definitions
| Term | Definition |
|---|---|
| Stepwise refinement | The process of defining functions that will accomplish a process; includes definition of modules, programs, and data |
| Program morphology | The shape of a program, including the extent of fan-out, fan-in, scope of control, and scope of effect |
| Data structure | The definition of data in an application includes logical data definition and physical data structure |
| Modularity | A property of programs meaning they are divided into several separate addressable elements |
| Abstraction | Attention to some level of g~neralization without regard to irrelevant lowlevel details |
| Information hiding | Design decisions in one module are hidden from other modules |
| Cohesion | A measure of the internal strength of a module |
| Coupling | A measure of the intermodule strength ofa module |
The streams are partitioned off from the rest of the diagram by drawing arcs showing where they end.
Examples of transform-centered applications include accounting, personnel, payroll, or order entry-inventory control. For these applications, getting data into and out of the system is secondary to the file handling and manipulation of numbers that keep track of the information. In accounting, for instance, balancing of debits and credits takes place at end-of-day, end-of-month, and end-of-year processing. These periodic process transformations summarize and move data, erase some information, archive other information, and write data to the general ledger to summarize the details in the receivables and payables subledgers. All of these transforms process data that is already in the files.
These processes are the heart of accounting processing. Without these processes, the application would be doing something else.
Not all applications are transform-centered. Some applications do simple processing but have many different transaction types on which the simple processes are performed. These systems are called transaction-centered. Transaction analysis replaces transform analysis for transaction-centered applications with partitioning by transaction type, which may not be obvious from DFDs. Figure 8-3 shows an example of a partitioned DFD for a transaction-centered application. This detailed DFD looks like it contains redundancy because many of the same processes appear more than once. Look closely and you see that each set of processes relates to a different type of transaction.
When the high-level partitioning is done, the information is transferred to a first-cut structure chart. We will develop the structure chart from Figure 8-2. A structure chart is a hierarchic, input process-output view of the application that reflects the DFD partitioning. The structure chart contains one rectangle for each lowest level process on the DFD. The rectangles are arranged in a hierarchy to show superior control and coordination modules. Individual process modules are the lowest in their hierarchy. The rectangles in the hierarchy are connected via undirected lines that are always read topdown and left to right. The lines imply transfer of processing from the top to the bottom of the hierarchy. Diamonds overlay the connection when a conditional execution of a module is possible using if-then-else logic. Reused modules are shown in one of two ways. Either they are repeated several times on the diagram and have a slash in the lower left corner to signify reuse, or they are connected to more than one superior module via the linking lines.
The identification of afferent flows, efferent flows, and transforms results in chains of processes, each its own 'net output.' If we look at Figure 8-2 again, we see the net afferent output is data flow Good Input. For the central transform, the net output is Solution. For the efferent flows, the net output is Printed Solution. These net outputs are used to determine the initial structure of the structure chart, using a process called factoring.
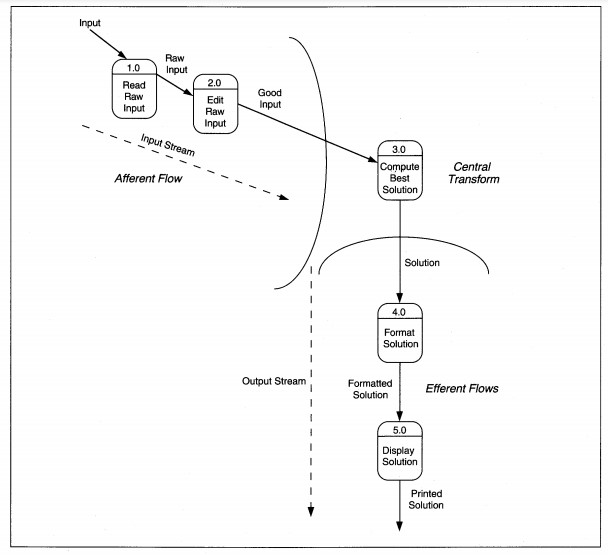
FIGURE 8-2 Transform-Centered DFD Partitioned
Factoring is the process of decomposing a DFD into a hierarchy of program components that will eventually be programmed modules, functions, or control structures. Each stream of processing is analyzed to determine its IPO structure. When the structure is identified, the processes are placed on the structure chart and named until all low-level DFD processes are on the structure chart (see Figure 8-4).
Next, data and control information are added to the structure chart. Data couples identify the flow of data into and out of modules and match the data flows on the DFD. Data couples are identified by a directed arrow with an open circle at the source end (see Figure 8-5). The arrowhead points in the direction the data moves. Control couples identify the flow of control in the structure. Control couples are placed to show where the control data originates and which module(s) each couple affects. A control couple is usually a program switch whose value identifies how a module is activated.
Control couples are drawn as directed arrows with a closed circle at the source end (see Figure 8-6). The arrowhead points in the direction the control travels. If a control couple is in, set and reset in the same module, it is not shown on the diagram. A control couple that is set and reset in one place, but used in another, is shown. If a control couple is set in one module and reset in another, it is shown as both input and output. Control is 'designed into' the application by you, the SE, based on the need for one module to control the processing of another module. The goal is to keep control to a minimum. Figure 8-4 shows the completed structure chart for the DFD in Figure 8-2.
Next, we evaluate and revise the structure chart to balance its morphology. Morphology means form or shape. The shape of the structure chart should be balanced to avoid processing bottlenecks. Balance is determined by analyzing the depth and width of
the hierarchy, the skew of modules, the span of control, the scope of effect, and the levels of coupling and cohesion. When one portion of the structure chart is unbalanced in relation to the rest of the diagram, you modify the structure to restore
the balance, or pay closer attention to the unbalanced portion to ensure an efficient production environment.
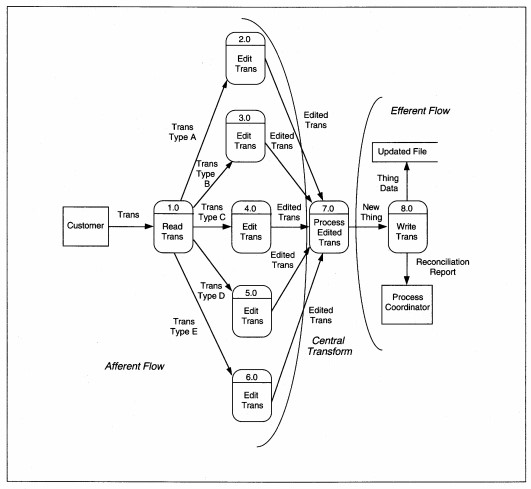
FIGURE 8-3 Transaction-Centered DFD Partitioned
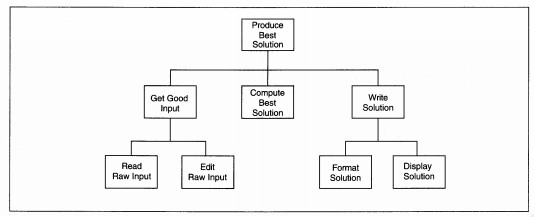
FIGURE 8-4 First-Cut Structure Chart
The depth of a hierarchy is the number of levels in the diagram. Depth by itself is not a measure of good design nor is it a goal in itself. Rather, it can indicate the problem of too much communication overhead and not enough real work taking place (see
Figure 8-7). Conversely, adding a level of depth can be a cure for too wide a hierarchy.
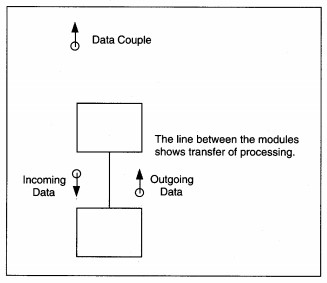
FIGURE 8-5 Data Couple Notation
The width of the hierarchy is a count of the modules directly reporting to each superior, higher level module (see Figure 8-8). Span of control is another term for the number of immediate subordinates and is a synonym for the width of the hierarchy. Width
relates to two other terms: fanout and fan-in. Fan-out is the number of immediate subordinate modules. Too much fan-out can identify a processing bottleneck because a superior module is controlling too much processing.
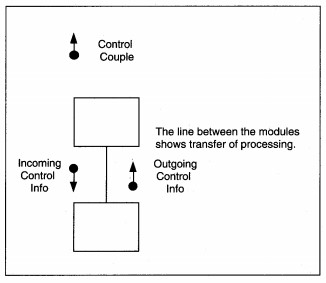
FIGURE 8-6 Control Couple Notation
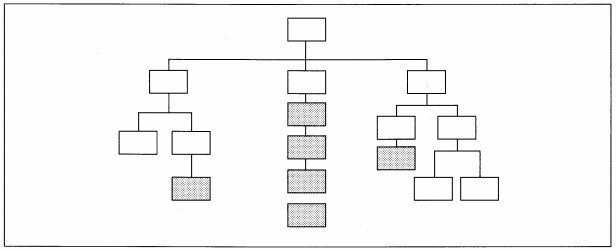
FIGURE 8-7 Excessive Depth of Hierarchy
While there is no one number that says 'how wide is too wide,' seven ±2 is the generally accepted guideline for number of fan-out modules. One solution to fan-out processes that are functionally related is to factor another level of processing that provides
middle-level management of the low-level modules. Another solution to fan-out problems that are factored properly, but not functionally related, is to introduce a new control module at the IPO level.
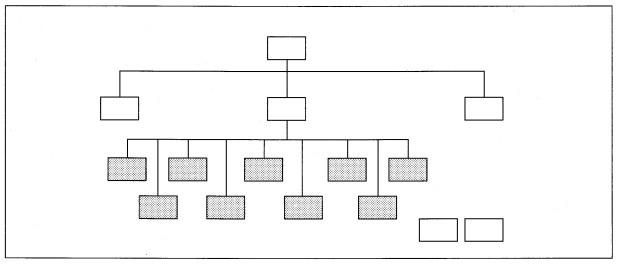
FIGURE 8-8 Excessive Width of Hierarchy
Fan-in, on the other hand, is the number of superior modules (i.e., immediate bosses) which refer to some subordinate module (see Figure 8-9). Fan-in can be desirable when it identifies reusable components and reduces the total amount of code produced. The major tasks with fan-in modules are to ensure that they perform a whole task, are highly cohesive, and are minimally coupled.
Skew is a measure of balance or lopsidedness of the structure chart (see Figure 8-10). Skew occurs when one high-level module has many subordinate levels and some or most of the other high-level modules have few subordinate levels. Skew can indicate
incorrect factoring. If factoring is correct, then skew identifies a driver for the application that might require special consideration. If the skew is on the input side, we say the application is input driven or input-bound. Similarly, if the skew
is on the output side, the application is output-bound. If the input and output are skewed with little transform processing, the application is I/O-bound (for input/output). Finally, if the application has little input or output, but lots of processing,
the application is processbound. The special considerations of each of these occurrences deal with ensuring correct language selection and meeting I/O and process time constraints.
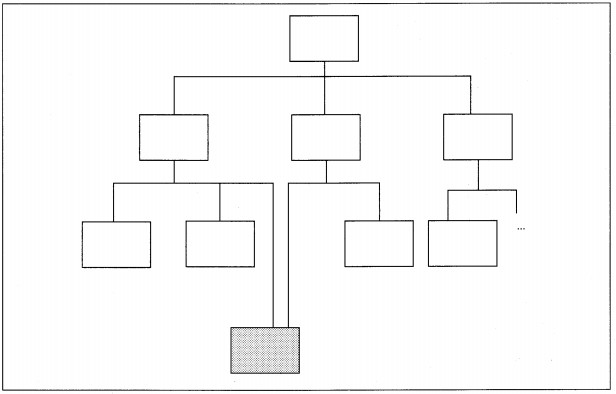
FIGURE 8-9 Example of Fan-In
The scope of effect of a module identifies the collection of modules that are conditionally processed based on decisions by that module (see Figure 8-11). The scope of effect can be identified by counting the number of modules that are directly affected by the process results of another module. High scope of effect relates to fan-out, fan-in, and coupling in that it may identify potential problems with debugging and change management. Ideally, the scope of effect of anyone module should be zero or one. That is, no more than one other module should be affected by any processing that takes place in any other module.
The last measures of structure morphology which are analyzed throughout the remainder of structure design are coupling and cohesion. Cohesion is a measure of the intramodule strength. Coupling is a measure of the intermodule linkage. Maximal, functional
cohesion and minimal coupling are the ideal relationships. Coupling and cohesion are related inversely (see Figure 8-12). If cohesion is high, coupling is low, and vice versa; but, the relationship is not perfect. That means that if you have strong
cohesion, you may still have strong coupling due to poor design. So, attention to both coupling and cohesion are required.
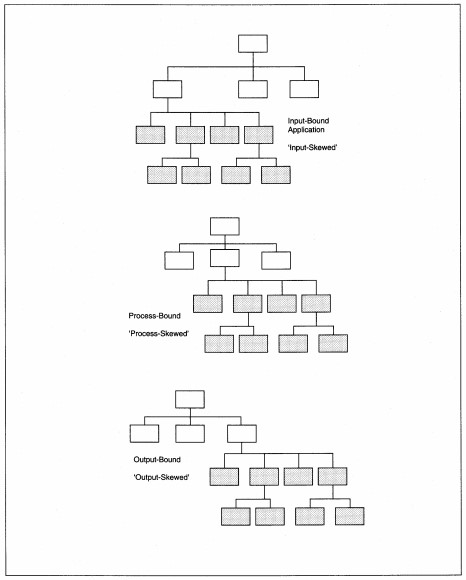
FIGURE 8-10 Examples of Skewed Structure Charts
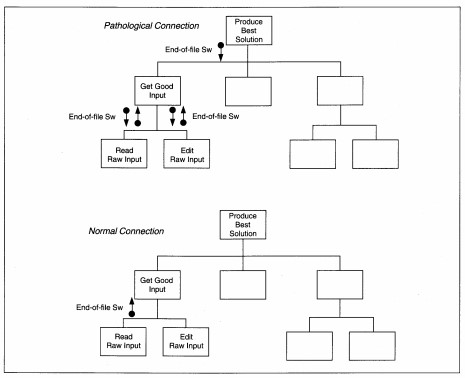
FIGURE 8-11 Example of Scope of Effect
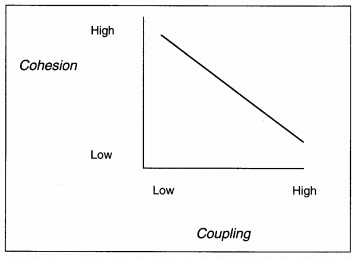
FIGURE 8- 12 Relationship between Coupling and Cohesion
Factoring and evaluation are followed by functional decomposition, which is the further division of processes into self-contained IPO subprocesses. Balanced structure chart subprocesses might be further decomposed to specify all of the functions required to accomplish each subprocess. Fan-out, span of control, and excessive depth are to be avoided during this process. 1 The decision whether to decompose further or not relates to the details needed for the implementation language and how well the SEs understand the details.
Structure charts are only one of many methods and techniques for documenting structured design results. Most of the alternatives would replace, rather than supplement, structure charts. Each technique has its own slightly different way of thinking about the processes to finalize a design, even though the goals are the same. Several alternatives are IBM Hierarchic input-process-output diagrams (HIPO) (see Figure 8-13), Warnier diagrams (see Figure 8-14), Nassi-Schneiderl11an diagrams (see Figure 8-15), and flow charts (see Figure 8-16).
To complete design, program specifications (specifications is abbreviated to 'specs') must be developed, but before specs can be developed, several other major activities are required. First, the physical database must be designed. Then, program package
units are decided. Several activities not discussed here (these are covered in Chapter 14) are performed, including verification of adequate design for inputs, outputs, screens, reports, conversion, controls, and recoverability.
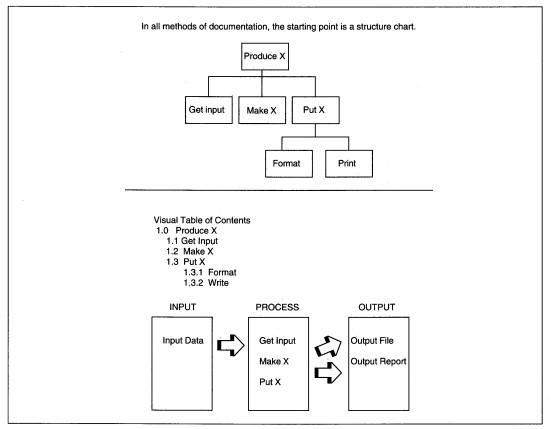
FIGURE 8- 13 Other Structured Program Documentation Methods: IBM's Hierarchic InputProcess-Output (HIPO) Diagram Example
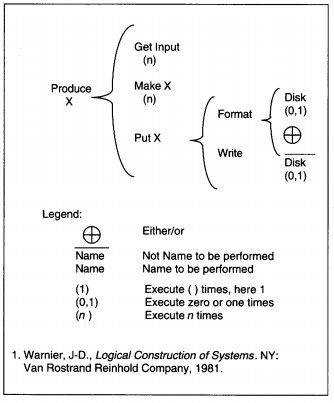
FIGURE 8-14 Warnier Diagram1
Physical database design is concurrent with factoring and decomposition. Several common physical database design activities are:
- design user views (if this is not already done)
- select the access method
- map user views to the access method and storage media
- walk-through the database design
- prototype the database
- document and distribute access information to all team members
- train team members in access requirements
- develop a test database
- develop the production database
Keep in mind that many other activities may be involved in designing a physical database for a specific implementation environment.
While the details of physical database design and decomposition are being finalized, project team members are also thinking about how to package the modules into program units. A program unit or a program package is one or more called modules, functions,
and in-line code that will be an execute unit to perform some atomic process. In nonrealtime languages, an execute unit is a link-edited load module. In real-time languages, an execute unit identifies modules that can reside in memory at the same
time and are closely related, usually by mutual communication. The guiding principles during these design activities are to minimize coupling and maximize cohesion (see Tables 8-2 and 8-3 for definition of the seven levels of coupling and cohesion).
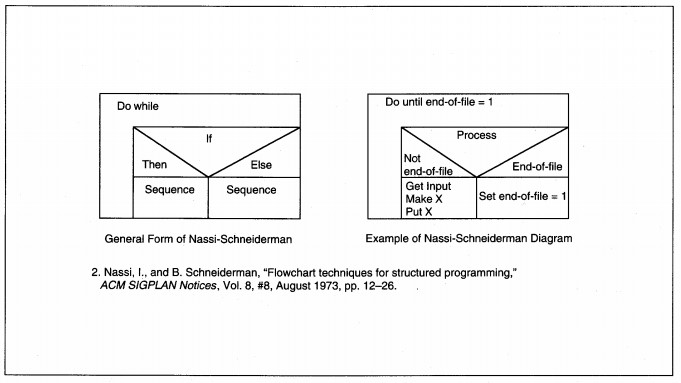
FIGURE 8-15 Nassi-Schneiderman2 Diagram Example
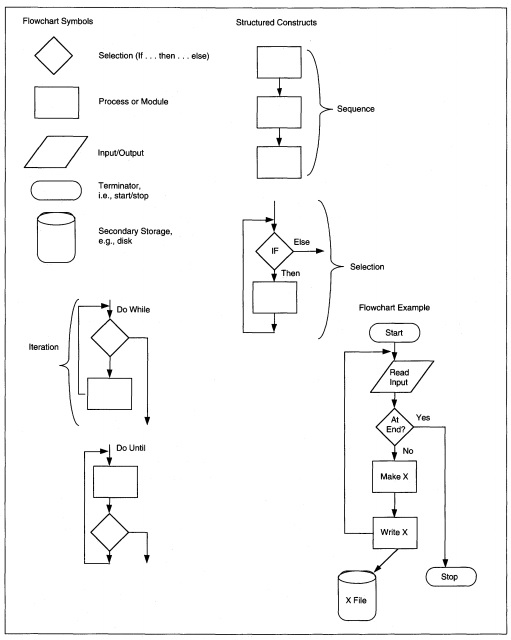
FIGURE 8-16 Flowchart Symbols, Structured Constructs, and Example
An atomic process is a system process that cannot be further decomposed without losing its systemlike qualities. An execute unit is a computer's unit of work (i.e., a task). A module is a 'small program' that is self-contained and may call other modules. Modules may be in-line, that is, in the actual program, or may be externally called modules. In-line code is the structured program code that controls and sequences execution of modules and functions. For instance, a 'read' module might do all file access; a screen interaction module might do all screen processing and have submodules that perform screen input and screen output.
A function is an external 'small program' that is self-contained and performs a well-defined, limited procedure. For example, a function might compute a square root of a number. Functions usually do not call other modules but there is no rule against it. Even though the definitions of modules and functions are similar, they are different entities. Functions sometimes come with a language, for instance, the mathematical and statistical functions that are part of Fortran. Modules are usually user-defined and have a broader range of applicability, such as a screen interaction module. Functions are usually reusable across applications without alteration; modules are not.
| Type of Cohesion | Definition |
|---|---|
| Functional | Elements of a procedure are combined because they are all required to complete one specific function. This is the strongest type of cohesion and is the goal. |
| Sequential | Elements of a common procedure are combined because they are in the same procedure and data flows from one step to the next. That is, the output of one module, for example, is passed in sequence as input to the next module. This is a strong form of cohesion and is acceptable. |
| Communicational | Elements of a procedure are combined because they all use the same data type. Modules that all relate to customer maintenance-add, delete, update, query-are related through communication because they all use the Customer File. |
| Procedural | Elements of a common procedure are combined because they are in the same procedure and control flows from one step to the next. This is weak cohesion because passing of control does not mean functions in the procedure are related. |
| Temporal | Statements are together because they occur at the same time. This usually refers to program modules, for example, 'housekeeping' in COBOL programs to initialize variables, open files, and prepare for processing. Temporal cohesion is weak and should be avoided wherever practical. |
| Logical | The elements of a module are grouped by their type of function. For instance, all edits, all reads from files, or all input operations are grouped. This is undesirable cohesion and should be avoided. |
| Coincidental | This is the random or accidental placement of functions. This lowest level of cohesion occurs when there is no real relationship between elements of a module. This is undesirable cohesion and should be avoided. |
TABLE 8-3 Definition of Coupling Levels
| Level of Coupling | Definition |
|---|---|
| Indirect relationship | No coupling is possible when modules are independent of each other and have neither a need nor a way to communicate. This is desirable when modules are independent. An example of no direct relationship is a date translate routine and a net present value routine. There is no reason for them to be related, so they should not be related. |
| Data | Only necessary data are passed between two modules. There are no redundant parameters or data items. This is the desirable form of coupling for related modules. |
| Stamp | The module is given access to a complete data structure such as a physical data record when it only needs one or two items. The module becomes unnecessarily dependent on the format and arrangement of data items in the structure. Usually, stamp coupling implies external coupling. The presence of unneeded data violates the principal of 'information hiding' which says that only data needed to perform a task should be available to the task. |
| Control | Control 'flags' are shared across modules. Control coupling is normal if the setting and resetting of the flag are done by the same module. It is a pathological connection to be avoided if practical when one module sets the flag and the other module resets the flag. |
| External | Two modules reference the same data item or group of items such as a physical data record. In traditional batch applications, external coupling is unavoidable since data are passive and not directly relating to modules. External coupling is to be minimized as much as possible and avoided whenever practical. External coupling violates the principal of information hiding. |
| Common | Modules have access to data through global or common data areas. This is frequently a language construct problem but it can be avoided by passing parameters with only a small amount of additional work. Common coupling violates the principal of information hiding. |
| Content | One module directly references and/or changes the insides of another module or when normal linkage mechanisms are bypassed. This is the highest level of coupling and is to be avoided. |
When program packages are decided, program interprogram relationships is interface. specifications are developed. Program specifications document the program's purpose, process requirements, the logical and physical data definitions, input and output formats, screen layouts, constraints, and special processing considerations that might complicate the program. Keep in mind that the term program might also mean a module within a program or an externally called function. There are two parts to a program specification: one identifies interprogram (including programs in other applications) relationships and communication; the other documents intraprogram processing that takes place within the individual program. Another term for interprogram relationships is interface.
4. Process Design Activities
The steps in process design are transform (or transaction) analysis, develop a structure chart, design the physical database, package program units, and write program specifications. Each of these steps is discussed in this section.
Since both transform and transaction analysis might be appropriate in a given system, the first activity is to identify all transactions and determine if they have any common processing. This activity can be done independently from the DFD and functional analysis, or it can be done as a side activity while you are doing functional analysis as the primary activity. If you cannot tell which is more appropriate, do a rough-cut structure chart using both methods and use the one which gives the best overall results in terms of coherence, understandability, and simplicity of design.
4.1. Transaction Analysis
Rules for Transaction Analysis
The basic steps in transaction analysis are to define transaction types and processing, develop a structure chart, and further define structure chart elements. A detailed list of transaction analysis activities follows.
1. Identify the transactions and their defining actions.
2. Note potential situations in which modules can be combined. For instance, the action is the same but the transaction is different-this identifies a reusable module.
3. Begin to draw the structure chart with a high-level coordination module as the top of the transaction hierarchy. The coordination module determines transaction type and dispatches processing to a lower level.
4. For each transaction, or cohesive collection of transactions, specify a transaction module to complete processing it.
5. For each transaction, decompose and create subordinate function module(s) to accomplish the function( s) of the transaction. If a transaction has only one unique function, then keep the unique action as part of the transaction module identified in
the previous step.
6. For functions that are not unique, decompose them into common reusable modules. Make sure that the usage of the module is identical for all using transactions. Specifically identify which transactions use the module.
7. For each function module, specify subordinate detail module(s) to process whole detail steps as appropriate. If there is only one functional detail step, keep it as part of the function module defined in step 5.
A typical transaction application is money transfer for banks. Transactions for money transfer all have the same information: sending bank, receiving bank, sender, receiver, receiver account number, and amount. There might be other information, but this
is required. What makes money transfer a transaction system is that transactions can come from phone, mail, TWX!felex, fax, BankWire, FedWire, and private network sources. Each source of transaction has a different format. Phone, mail, and fax are
all essentially manual so the application can require a person to parse the messages and enter them in one format. The other three are electronic messaging systems to be understood electronically. TWX/telex, which are electronic free-form messages,
may have field identifiers but have no required order to the information. A summary DFD for a money transfer system might look like Figure 8-17, which shows a deceptively simple process. What makes the process difficult is that the data entry-parse-edit
processes are different for each message type, having different edit criteria, formats, and acceptance parameters. The partitioning for the transaction DFD can be either a high-level summary or detailed. The summary partition (see Figure 8-17) shows
afferent flows on the summary DFD, which is annotated that structuring is by transaction type. The detailed DFD (see Figure 8-18) shows each type of transaction with its own set of afferent and efferent flows.
To create a first-cut structure chart, one control module is defined for each transaction's afferent stream and efferent stream; there may be only one transform center. For each transaction, the afferent data flows are used to define data couples. The
control couples relate to data passed between modules. When control is within a superior module, it is shown via a diamond to indicate selection from among the transaction subprocesses (see Figure 8-19).
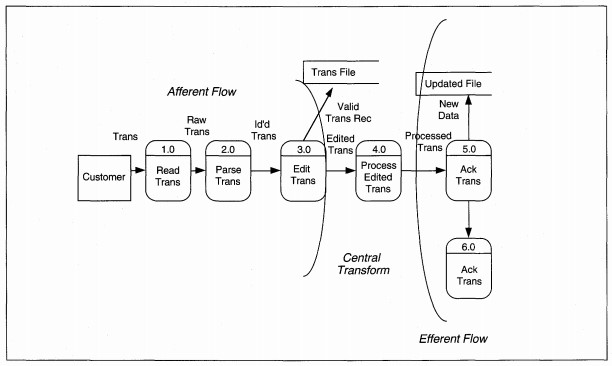
FIGURE 8-17 Summary Money Transfer DFD Partitioned
ABC Video Example Transaction Analysis The first step to determining whether you have a transaction application or a transform centered application is to identify all sources of transactions and their types. Table 8-4 contains a list of transactions for
ABC Video. As you can see from the list, there are maintenance transactions for customer and video information, there are rental and return transactions, and there are periodic transactions. The only common thread among the transactions is that they
share some of the same data. The processing in which they are involved is different and there are no commonalities except reading and writing of files. Therefore, we conclude that ABC Video Rental processing is not a transaction-centered application
and move to transform analysis to complete the structure chart.
4.2. Transform Analysis
Rules for Transform Analysis
In transform analysis we identify the central transform and afferent and efferent flows, create a first-cut structure chart, refine the chart as needed at this high level, decompose the processes into functions, and refine again as needed. These rules are summarized as follows:
1. Identify the central transform
2. Produce a first-cut structure chart
3. Based on the design strategy, decompose the processes into their component activities
4. Complete the structure chart
5. Evaluate the structure chart and redesign as required.
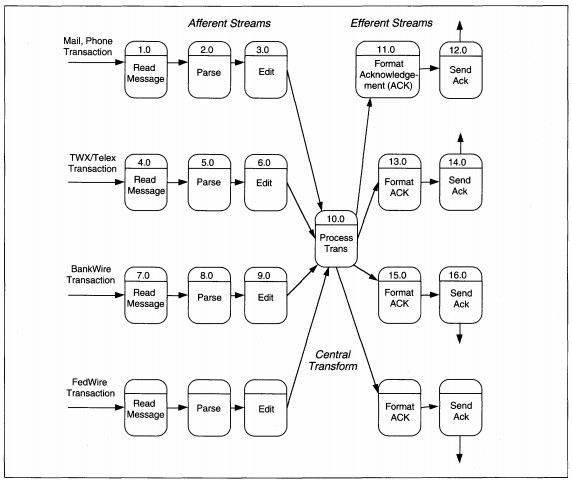
FIGURE 8-18 Detailed Money Transfer DFD Partitioned
To properly structure modules, their interrelationships and the nature of the application must be well understood. If a system concept has not yet been decided, design cannot be finalized until it is. The concept includes the timing of the application
as batch, on-line or real-time for each process, and a definition of how the modules will work together in production. This activity may be concurrent with transform analysis, but should have been decided to structure and package processes for an
efficient production environment. This activity is specific to the application and will be discussed again for ABC rental processing.
First, we identify the central transform and afferent and efferent flows. Look at the DFD and locate each stream of processing for each input. Trace each stream until you find the data flow that identifies valid, processable input that is the end of an
afferent stream. The afferent and efferent arcs refer only to the processes in the diagram. During this part of the transform analysis, files and data flows are ignored except in determining afferent and efferent flows. After identifying the afferent
flows, trace backward from specific outputs (files or flows to entities) to identify the efferent flows. The net afferent and efferent outputs are used to determine the initial structure of the structure chart, using a process called factoring.
Factoring is the act of placing each unbroken, single strand of processes into its own control structure, and of creating new control processes for split strands at the point of the split. The new control structure is placed under the input, process,
or output controls as appropriate.
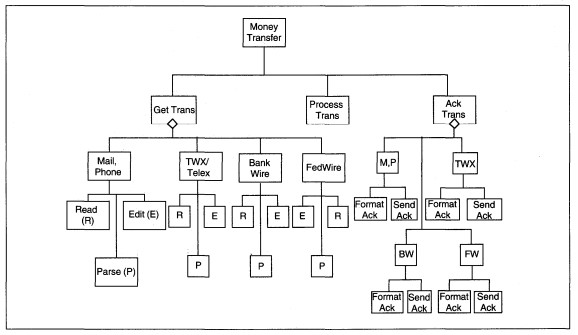
Figure 8-19 Sample Transaction Control Structure
| Transaction | General Process | Data |
|---|---|---|
| Add Customer | Maintenance | Customer |
| Change Customer | Maintenance | Customer |
| Delete Customer | Maintenance | Customer |
| Query Customer | Periodic | Customer |
| Add Video | Maintenance | Video |
| Change Video | Maintenance | Video |
| Delete Video | Maintenance | Video |
| Query Video |
Periodic | Video |
| Rent Video | Rent/Return | Video, Customer, History |
| Return Video | Rent/Return | Video, Customer, History |
| Assess special charges | Rent/Return | Customer |
| Query | Periodic | Video, Customer, History |
| Create History | Periodic | Video, Customer, History |
| Generate Reports | Periodic | Video, Customer, History |
TABLE 8-4 ABC Transaction List
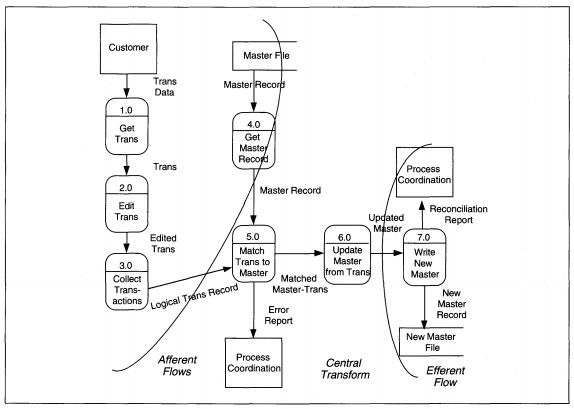
FIGURE 8-20 Master File Update DFD Partitioned
A master file update is shown as Figure 8-20 to trace the streams. In this diagram, we have two afferent data streams which come together at Match Trans to Master. The first input, Trans Data flows through process Get Trans and through Edit Trans to become
Edited Trans. Successfully edited transaction parts flow through Collect Transactions to become Logical Trans Record.
The second input stream deals with the master file. The Master Record is input to Get Master Record; successfully read master records flow through the process. Once the Logical Trans Record and Master Record are both present, the input transformations are complete. These two afferent streams completely describe inputs, and the arc is drawn over the Logical Trans Record and Master Record data flows (see Figure 8-20).
The two streams of data are first processed together in Match Trans to Master. Information to be updated flows through Update Master from Trans to become Updated Master. The error report coming from the match process is considered a trivial output and
does not change the essential transform nature of the process. The argument that Match Trans to Master is part of the afferent stream might be made. While it could be treated as such, the input data is ready to be processed; that is, transactions
by themselves, master records by themselves, and transactions with master records might all be processed. Here, we interpret the first transformation as matching.
The data flow out of Update Master from Trans is a net outflow, and Write New Master is an efferent process. The efferent arc is drawn over the data flow Updated Master.
Next, we factor three basic structures that relate to input-process-output processing (see Figure 8-21). If there is more than one process in a stream, getting the net output data may require some interprocess coordination. The coordination activities
are grouped and identified by a name that identifies the net output data. So, in the example, the input stream is Get Input; the transform stream is Process; the output stream is Write New Master. Each stream represents the major elements of
processing. Because the process and input streams both are compound, each has at least two streams beneath them-one for each sequential process stream to reach the net output data.
Notice that the DFD process names identify both data and transformation processes. Make sure that the lowest-level names on the structure chart are identical to the name on the data flow diagram to simplify completeness checking.
Notice also that there is transformation processing within the afferent and efferent streams. Modules frequently mix input/output and transform processing, and there is no absolute way to distinguish into which stream the module belongs. The rule
of thumb is to place a module in the stream which best describes the majority of its processing.
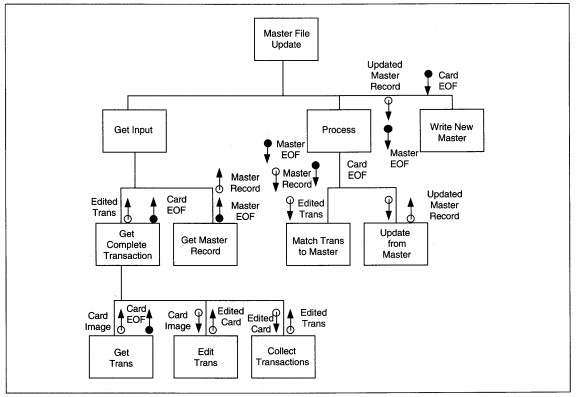
FIGURE 8-21 Master File Update Structure Diagram
Once the module is on the structure chart, we specifically evaluate it to ensure that it meets the principles of fan-out, span of control, maximal cohesion, and minimal coupling. If it violates even one principle, experiment with moving the module to the alternative streams and test if it better balances processing, without changing the processing. If so, leave it in the new location; otherwise note that the unbalanced part of the structure chart may need special design attention to avoid production bottlenecks.
Decompose the structure chart entries for each process. The three heuristics to guide the decomposition are:
- Is the decomposition also an IPO structure? If yes, continue; if no, do not decompose it.
- Does the control of the decomposed processing change? If yes, do not decompose it. If no, continue.
- Does the nature of the process change? That is, if the process is a date-validation, for instance, once it is decomposed is it still a date-validation? If no, continue. If yes, do not decompose it. In this example, I might try to decompose a date-validation into month-validate, day-validate, and year-validate. I would need to add a date-validate to check all three pieces together. Instead of a plain date-validate, I have ( a) changed the nature of the process, and (b) added control logic that was not necessary.
The thought process in analyzing depth is similar to that used in analyzing the number of organizational levels in reengineering. We want only those levels that are required to control hierarchic complexity. Any extra levels of hierarchy should be omitted.
Now let us turn to ABC rental processing to do transform analysis and develop the structure chart.
ABC Video Example Transform Analysis
The decisions about factoring are based on the principles of coupling and cohesion, but they also require a detailed understanding of the problem and a design approach that solves the whole problem. In ABC Video's case, we have to decide what the
relationships of rent, return, history, and maintenance processing are to each other. If you have not done this yet, now is the time to do it. Before we continue with design of transform analysis, then, we first discuss the design approach and rationale.
DESIGN APPROACH AND RATIONALE. In Chapter 7, Table 7-5 identified the Structured English pseudo-code for ABC's rental processing and we did not discuss it in detail. Now, we want to examine it carefully to determine an efficient, cohesive, and minimally
coupled decomposition of the process. When we partition the ABC Level 0 DFD from Figure 7-26, customer and video maintenance are afferent streams, reports are efferent, and rental and return are the central transform& (see Figure 8-22). We will
attend only to create and return rentals since they are the essence and hardest portion of the application.
There is a design decision to have return processing as a subprocess of rental processing that needs some discussion. Then we will continue with the design. The overall design could be to separate rentals and returns as two different processes, but are they? Think in the context of the video store about how the interactions with customers takes place. Customers return tapes previously taken out. Then they select tapes for rental and pay all outstanding fees, including current and past returns that generate late fees. To have late fees, a tape must have been returned. 2 Rentals and returns are separated in time; they have separate actions taken on files. ABC has any combination of rentals with returns (with or without late fees) and open rentals. All open rentals are viewed during rental processing, but need not be during return processing. Adding a return date and late fees is a trivial addition. Returns could be independent of rentals, so there are three design alternatives:
- Returns are separated from rentals.
- Rentals are a subset of returns.
- Returns are a subset of rentals.
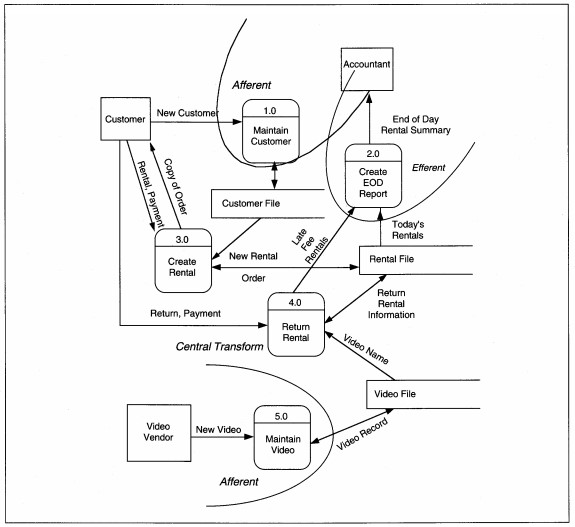
FIGURE 8-22 ABC Video Level 0 DFD Partitioned (same as Figure 7-26)
If returns are separated from rentals, there would be two payment processes-one for the return and one for the rental. If a rental includes a return, this is not 'minimal bureaucracy' and is not desirable. However, since returns can be done independently from rentals, the system should not require rental processing to do a return. This alternative is an acceptable partial solution, but the rest of the solution must be included.
The second alternative is to treat rentals as part of the return process. This reasoning recognizes that a rental precedes a return. All returns would need a rental/no rental indicator entry and assume that more than 50% of the time, rentals accompany
returns.
Which happens more frequently-returns with rentals, or rentals without returns? Let's say Vic does not know and reason through the process. Since returns can be any of three ways, only one of which is with rentals, coupling them as rental-within-return should be less efficient than either of the other two choices.
Last, we can treat returns as part of the rental process. If returns are within rentals, we have some different issues. What information identifies the beginning of a rental? What identifies the beginning of a return? A customer number could be used to
signify rental processing and a video number could signify a return. If we do this, we need to make sure the numbering schemes are distinct and nonoverlapping. We could have menu selection for both rental and return that determines the start of processing;
then return processing also could be called a subprocess of rentals. Either of these choices would work if we choose this option. For both alternatives, the software needs to be reevaluated to maximize reusable modules because many actions on rentals
are also taken on returns, including reading and display of open rentals and customer information.
Having identified the alternatives and issues, we conduct observations and collect data to justify a selection. The results show that 90% of returns, or about 180 tapes per day, are on time. Of those, 50% are returned through the drop box, and 50% (90 tapes) are returned in person with new rentals. The remaining 10% of returns also have about 50% (10 tapes) accompanying new rentals. So, about 100 tapes a day, or 50% of rentals are the return-then-rent type. These numbers justify having returns as a subprocess of rentals. They also justify having returns as a stand-alone process. We will allow both.
Deciding to support both separate and return-within-rental processing means that we must consciously decide on reusable modules for the activities the two functions both perform: reading and display of open rentals and customer information, payment processing,
and writing of processing results to the open rental files. We will try to design with at least these functions as reusable modules.
DEVELOP AND DECOMPOSE THE STRUCTURE CHART. To begin transform analysis, we start with the last DFD created in the analysis phase, and the data dictionary entries that define the DFD details. Figure 7-28 is reproduced here as Figure 8-23, with a first-cut partitioning to identify the central transform. First, we evaluate each process. We will use the pseudo-code that is in the data dictionary (see Figure 8-24). The DFD shows three rental subprocesses: Get Valid Rental, Process Fees and Money, and Create and Print Rental. Each of the subprocesses might be further divided into logical components. Try to split a routine into a subroutine for each function or data change.
First, evaluate the potential split to make sure the subroutines are all still needed to do the routine. This double-checks that the original thinking was correct. Then, evaluate each potential split asking if adding the subroutine changes the control,
nature, or processing of the routine. If yes, do not separate the routine from the rest of the logic; if no, abstract out the subroutine.
For ABC, Get Valid Rental is the most complex of the routines and is evaluated in detail. Get Valid Rental has three subroutines that we evaluate: Get Valid Customer, Get Open Rentals, and Get Valid Video. These splits are based on the different files that are read to obtain data for processing a rental. Without all three of these actions, we do not have a valid rental, so the original designation of Get Valid Rental appears correct. Figure 8-25 shows refined pseudo-code for ABC rental processing with clearer structure and only structured constructs. Subroutines are shown with their own headings.
If we are to accommodate returns during rental processing, we have to decide where and how rentals fit into the pseudo-code. We want to allow return dates to be added to open rentals. We also want to allow returns before rentals and returns within rentals.
This implies that there are two places in the process where a rental Video ID might be entered: before or after the Customer ID. If the Video ID is entered first, the application would initiate in the Return process; from there, we need to allow additional
rentals. If the Customer ID is entered first, the application would initiate rental; from there, we need to allow returns. To allow both of these actions to lead to rental and/or return processing, we need to add some control structure to the pseudo-code
(see Figure 8-26). The control structure also changes the resulting structure chart somewhat even though the DFDs are not changed.
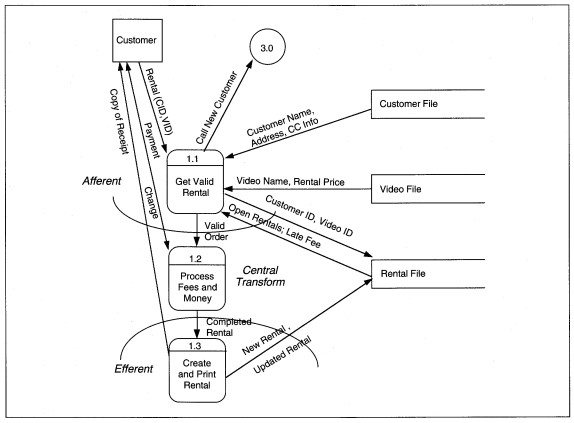
FIGURE 8-23 ABC Video Level l DFD Partitioned (same as Figure 7-28)
Next, we evaluate the refined pseudo-code and inspect each subroutine individually to determine if further decomposition is feasible (see Figure 8-27). For Get Valid Customer, does the processing stay the same? That is, are the detail lines of procedure information the same? By adding the subroutine we want to add a level of abstraction but not new logic. In this case, the answer is yes. Now look at the details of Get Valid Customer. The subprocesses are Get Customer Number-a screen input process, Read and Test Customer File-a disk input process with logic to test read success and determine credit worthiness, and Display Customer Info-a screen output process. Again, we have decomposed Get Valid Customer without changing the logic or adding any new functions.
The results of the other evaluations are presented. Walk-through the same procedure and see if you develop the same subroutines. Here we used the pseudo-code to decompose, but we could have used text or only our knowledge of processing to describe this
thinking. When the decomposition is complete for a particular process stream, it is translated to a structure chart.
4.3. Complete the Structure Chart
Rules for Completing the Structure Chart
Completion of the structure chart includes adding data and control couples and evaluating the diagram.
|
Get Valid Rental. For all customer Get customer # Read Customer File If not present, Cancel else Create customer Display Customer info. Read Open-Rentals For all Open Rentals, Compute late fees Add price to total price Display open rentals Display total price. For all video Read Video file If not present Cancel this video else |
Create Video Display Video Add price to total price Display total price. Process Fees and Money. Get amount paid.
Subtract total from about paid giving change. Display change. If change = zero and total = zero, mark all items paid
else
go to process fees and money.
Create and Print Rental. For all open rentals
if item paid
rewrite open rental.
For all new rentals write new open rental.
Print screen as rental confirmation. |
|---|
FIGURE 8-24 ABC Rental Pseudo-code
|
Get Valid Rental. Get Valid Customer.
For all customer
Get customer #
Read Customer File
If not present,
Cancel
else
Create customer
Display Customer info.
Get Open Rentals. Read Open-Rentals
For all Open Rentals,
Compute late fees
Add price to total price
Display open rentals
Display total price.
Get Valid Video. For all video
Read Video file
If not present
Cancel this video
else Call Create Video
|
Display Video Add price to total price Display total price. Process Fees and Money. Get amount paid.
Subtract total from about paid giving change.
Display change.
If change = zero and total = zero,
mark all items paid
else
go to process fees and money.
Create and Print Rental. Update open rentals.
For all open rentals
if item paid
rewrite open rental.
Create New Rentals. For all new rentals
write new open rental.
Print screen as rental confirmation.
|
|---|
FIGURE 8-25 ABC Rental Pseudo-code Refined
| Get Valid Rental. | |
|---|---|
|
Get entry. If entry is Video Call Return
else
Call Rental.
Rental. Get Valid Customer.
For all customer
Get customer #
Read Customer File
If not present,
Cancel
else
Create customer
Display Customer info.
Get Open Rentals.
Read Open-Rentals
For all Open Rentals,
Compute late fees
Add late fees to total price Display open rentals
Display total price. Get Valid Video. For all video
Read Video file
If not present
Cancel this video
|
else Call Create Video Display Video Add price to total price Display total price, change. Process Fees and Payment.
Create and Print Receipt Return.
Get Open Rental.
Read Open-Rentals
Read Customer
Display Customer
Display Open Rental
Add return date.
Using customer ID, Read Open Rentals.
For all Open Rentals
Display open rentals. For all return request
Add return date to rental
Compute late fees
Add late fees to total price
Display total price
If rental
Call Get Valid Video.
Call Process Fees and Payment. Call Create and Print Receipt. |
FIGURE 8-26 Get Valid Rental Pseudo-code with Control Structure for Returns
Structure chart completion rules are:
1. For each data flow on the DFD add exactly one data couple. Use exactly the same data flow name for the data couple.
2. For each control module, decide how it will control its subs. If you need to refine the pseudo-code to decide control, do this. Add control couples to the diagram when they are required between modules.
3. For modules that select one of several paths for processing, show the selection logic with a diamond in the module with the logic attached to the task transfer line.
Rules of thumb for developing the structure chart are:
1. Evaluate the diagram for cohesion. Does each module do one thing and do it completely?
2. Evaluate the diagram for fan-out, fan-in, skew, and redesign as required, adding new levels of control. Note skewed processing for attention during program design.
3. Evaluate the diagram for minimal coupling. Is the same data used by many modules? Do control modules pass only data needed for processing? Do control modules minimize their scope of effect?
These are all discussed in this section.
First, the structure chart is drawn based on the decomposition exercises. Then data couples are added to the diagram for each data flow on the DFD. If the structure chart is at a lower level of detail, use the data flow as a starting point and define the specific data passed to and from each module. Show all data requirements for each module completely. Make sure that all names are exactly as they are in the dictionary.
| Get Valid Rental. | Get Valid Video. |
|---|---|
|
Get entry.
If entry is Video Call Return
else
Call Rental.
Call Get Valid Customer. Return. Call Get Open Rentals. Call Get Valid Video Call Get First Return.
Call Get Open Rentals. If rental Call Get Valid Video.
Process Fees and Money. Create and Print Rental. Update Open Rentals. Create New Rentals. Print receipt. Get Valid Customer. Get customer #
Read Customer File If not present, Create Customer.
If CCredit not zero, display CCredit Display Customer info Get Open Rentals. Read Open-Rentals
For all Open Rentals, Compute late fees
Add late fees to total price
Display open rentals
Display total price, change.
For all return request
Call Update Returns. |
For all video
Read Video file
If not present
Cancel this video
else
Call Create Video
Display Video
Add price to total price
Display total price, change.
Get First Return. Read Open-Rentals Read Customer Display Customer Display Open Rental Call Update Returns. Update Returns. Move return date to rental.
Update video history. Compute late fees. Add late fees to total price. Display total price. Process Fees and Money. Get amount paid.
Subtract total price from about paid giving change. Display total price, change. If change = zero and total = zero, mark all items paid
else
go to process fees and money.
Update Open Rentals. For all open rentals
rewrite open rental.
Create New Rentals. For all new rentals
write new open rental.
|
FIGURE 8-27 Complete Pseudo-code for Rentals and Returns
Next, for each control module, decide how it will control its subprocesses and add the control couples to the diagram. Decide whether the logic will be in the control module or in the subprocess. If the logic is in the control module, the goal is for
the controller to simply call the subordinate module, pass data to transform, and receive the transform's data back. If any other processing takes place, rethink the control process because it is not minimally coupled.
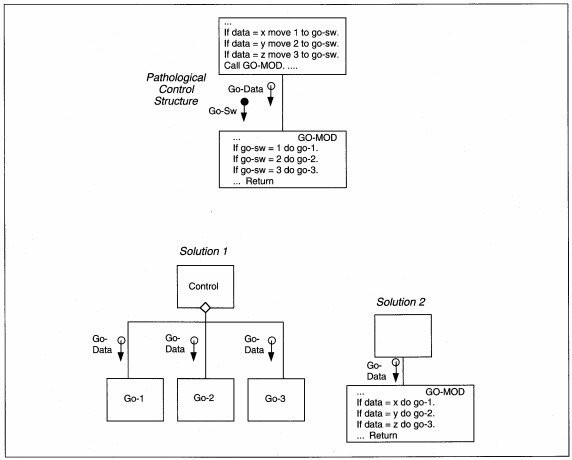
FIGURE 8-28 Pathological Control Structure and Two Solutions
A control couple might be sent to the subprocess for it to determine what to do. This mayor may not be okay. Where is the control couple 'set' and 'reset'? If in the control module, this is acceptable. If somewhere else, rethink the control process and
simplify it. Any time you must send a control couple for a module to decide which action to take, you identify a potential problem. The lower-level module may be doing too many things; otherwise it would not need to decide what to do, or the control
may be in the wrong module.
An example of this problem and two solutions are illustrated in Figure 8-28. If the lower level is doing too many things, then decompose them to create several single-purpose modules. If the lower level is not doing multiple functions, then move control for the module into the module itself. In both cases, the goal of minimal coupling is attained.
Next, the diagram is evaluated for cohesion, coupling, hierarchy width, hierarchy depth, fan-out, fan-in, span of control, and skew. Evaluate the diagram for cohesion (see Table 8-2 for definition of cohesion types). Check that each module does one thing and does it completely. If several modules must be taken together to perform a whole function, the structure is excessively decomposed. Regroup the processes and restructure the diagram.
Evaluate the diagram for width, depth, fan-out, fan-in, and skew. These are visual checks to see if some portion of the structure is inconsistent with the rest of the structure. The inconsistency does not necessarily mean that the diagram is wrong, only
that there may be production bottlenecks relating to the out-of-balance processes. For a wide structure, double check that the subprocesses really all relate to one and only one process. If not, add a new control module, else leave as is.
For deep structures, check to see if each level of depth is performing some function beyond control. Ask yourself why all the levels are needed. If there is no good reason, get rid of the level and move its functions either up or down in the hierarchy, preferably up. Ask yourself if fewer levels can accomplish the same process. If the answer suggests reducing the levels of hierarchy, restructure the diagram and keep only essential levels.
For fan-in modules, check that each using module has the same type of data being passed and expects the same type of results from the fan-in module. If there are any differences, then either make the using modules consistent, or add a new module to replace
the fan-in module for the inconsistent user module.
Skewed diagrams identify a fundamental imbalance of the application that may have been hidden before: that it is input-bound, output-bound, 1/0- bound, or process-bound. Skew is not necessarily a problem that results in restructuring a diagram. When skewed processing is identified, you should verify that it is not an artifact of your factoring. If it is, remove the skew from the diagram by restructuring the modules.
Skew is not always a problem. When a skewed application is being designed, the designers normally spend more time designing the code for the bound portion of the problem to ensure that it does not cause process inefficiencies. For instance, Fortran is notoriously inefficient at physical input/output (i.e., reading and writing files). For anything but a process-bound application, Fortran is not the best language used. For a process-bound Fortran application, with many I/Os, another language, such as assembler or Cobol, might be used to make read/ write processing efficient. The opposite is true of Cobol. Cobol is not good at high precision, scientific, mathematical processing. In a Cobol application, process-bound modules and their data would be designed either for another language, or to minimize the language effects.
Finally, evaluate the diagram for minimal coupling. First look at data couples. If you see the same data all over the diagram, there may be a problem. Either you are not specifying the data at the element level, or data coupling is the least coupling you will be able to attain. Make sure that only needed data is identified for passing to modules. Data coupling is not the best coupling, but it is tolerable.
Next look at control couples one last time. Make sure that they are set and reset in the same or directly-related modules, and make sure that, if passed, they are passed for a reason. If either of these conditions are violated, change the coupling.
To summarize so far, decide the system concept; partition the DFD; develop a first-cut structure chart; decompose the structure chart using pseudo-code of the functions as needed to guide the process; add data couples; add control couples; evaluate and
revise as needed.
ABC Video Example Structure Chart
ABC's structure chart will begin with the Levell DFD factoring and progress to provide the detail for modules as expressed in the pseudo-code. There are three first level modules: Get Valid Rental, Process Fees & Money, and Create and Print Rental (see Figure 8-~9). To get the next level of detail, we use the pseudo-code or decomposed structure charts. In our case, we use the pseudo-code. In Figure 8-27, the high level pseudo-code has only module names. We simply transfer those names to modules on the structure chart, attending to the control logic present in the diagram.
For each if statement, we need to decide whether that statement will result in a direct call (our choice, here) or whether it will result in a control couple being passed. Direct calls are preferred to minimize coupling. When a direct call is used, the
module is executed in its entirety every time it is called.
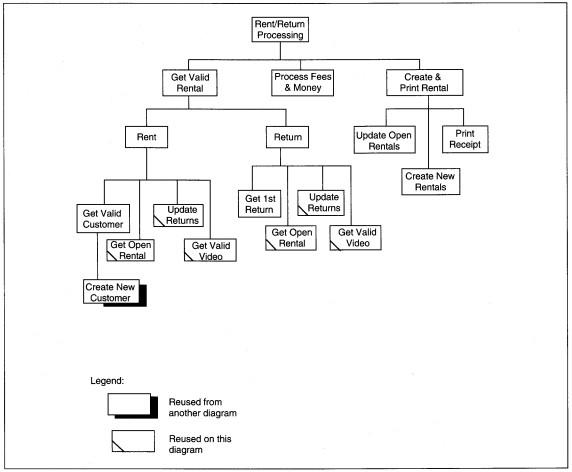
FIGURE 8-29 Rent/Return First-Cut Structure Chart
We identify reused modules by a slash in the lower left corner of the rectangles to show the complete morphology of the diagram. The first-cut structure chart shows that the processing is skewed toward input. Because there are three data stores affected by every process, there is no way to get rid of the skew without getting rid of the control level. Is the control level essential? If we omit the control level is the processing the same? Do we violate fanout if we remove the control level ? The answers are no, mostly, and no, respectively. If we remove the control level, its logic must go somewhere. The logic can move up a module and not violate fan-out. The change may have a language impact, so we will not change it until we decide program packages.
We note it for attention during packaging and programming. There are no other obvious problems with the first-cut structure chart. Since we have developed it bottom-up, using the pseudo-code as the basis, it is as good as our pseudo-code.
Next, we add the data and control couples needed to manage processing. The final diagram is shown in Figure 8-30, which we evaluate next.
Each module appears to do only one thing. The diagram is input -skewed as already discussed. The span of control and fan-out seem reasonable.
The reused modules each have the same input data. The hierarchy is not unnecessarily deep, although the control code for Get Valid Rental, Rent, and Return might be able to be combined depending on the language. Coupling is at the data level and is acceptable.
Next, we turn to designing the physical database.
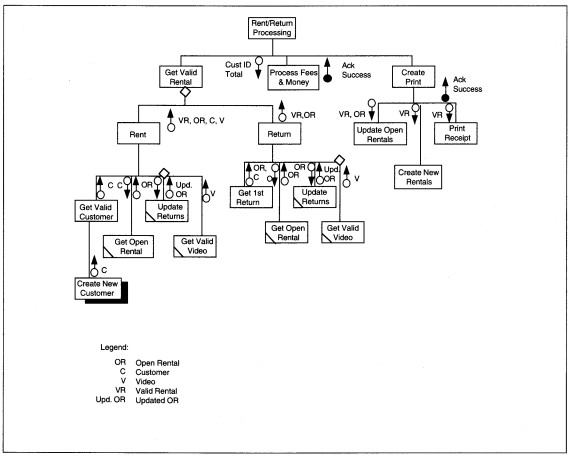
FIGURE 8-30 Completed Rent/Return Structure Chart
4.4. Design the Physical Database
Physical database design takes place concurrently with factoring and decomposition. A person with special skills, usually a database administrator (DBA), actually does physical database design. In companies without job specialization, a project team member acts as the DBA to design the physical database. Physical database design is a nontrivial task that may take several weeks or even months.
Rules for Designing the Physical Database
The general physical database design activities are summarized below. Keep in mind that many other activities may be involved in designing a physical database that relate to a specific implementation environment.
1. Define user views based on transaction types and data accessed for each transaction.
2. Identify access method if choices exist.
3. Map user views to access method and storage technology to optimize disk space and to minimize access time.
4. Build prototype and test, revising as indicated.
5. Develop database for application testing.
6. Document physical database design and distribute user view information to all project team members.
7. Work with conversion team to build production databases.
Designing user views means to analyze the transactions or inputs of each process to define which database items are required. In general, the data items processed together should be stored together. These logical design activities constrain the physical
design and help the person mapping to hardware and software.
In selecting the access method, the physical data designer seeks to optimize matching available access methods to access requirements. Access method choices usually are data sequenced (i.e., indexed), entry sequenced (i.e., direct), inverted lists, or some type b-tree processing. Each DBMS and operating system has its own access method(s) from which selection is made. The details of these access methods are beyond the scope of this text.
User views are mapped to the access method and a specific media. Media mapping seeks to optimize access time for individual items and sets of items. It also seeks to minimize wasted space while providing for growth of the database. Since media have become
one of the major expenses in the computing environment, there may be political issues involved with physical database design. At this point, a database walk-through reviews all database design before a prototype is built.
The DBA documents and trains team members in data access requirements. The DBA, working from the application specification, maps data requirements to user views to processes. Each process, then, has specific data items assigned. Every team member must know exactly what data items to access and how to access them. If a module or program accesses the wrong data item, an inconsistent database might result. Also, minimal data coupling requires that each process access only data that it requires. Incorrect use of access methods can lead to process bottlenecks or an inconsistent database. To assure that programs are using the data correctly, the DBA may participate in walk-throughs to monitor data access.
The DBA works with the test team to load the data needed for testing. The DBA also works with the conversion team to load the initial production database. These activities may be trivial or may require hiring of temporary clerks to input information to the database. The DBA and the two teams work together to verify the correctness of the data, to provide program test database access to the rest of the development team, and to provide easily accessed backup when the test database is compromised. After the test database is loaded, the backup and recovery procedures, transaction logic procedures, and other database integrity procedures are all finalized and tested.
To summarize, a person who intimately knows the technical production data environment acts as a DBA, mapping the database to a physical environment and building both test and production databases. The DBA provides training and guidance to the other team
members for data access, and participates in data related walk-throughs.
ABC Video Example Physical Database Design
In order to do the physical database design, a DBMS must be selected. We will design as if some SOL engine were being used. SOL's physical design is closely tied to the logical design so the design activity becomes less DBMS software sensitive. In addition,
SOL data definition is the same in both mainframe and micro environments so the design activity does not need to be hardware platform sensitive. The amount of storage space (i.e., number of tracks or cylinders) will vary, of course, since disks on
PCs do not yet hold as much information as mainframe disks.
Beginning with the logical design from Table 7 -7, we define the relations and data items that are required to develop user views. Remember from database class, that the logical database design can map directly to the physical database. The relations defining the actual database mayor may not be accessed by users. For security reasons, user views may be used to control access to data and only the DBA would even know the real relation names.
To define user views, we examine each process and identify the data requirements. List the requirements by process (see Table 8-5). Match similar data requirements across processes to identify shared user views. The problem is to balance the number of
views against the number of processes. Ideally a handful of user views are defined; a heuristic for large applications is about 20 user views. Beyond that, more DBAs are required and database maintenance becomes difficult. In a large application,
keeping the number of user views manageable may be difficult and require several design and walk-through iterations.
For ABC rental processing, we need a user view for each major data store: Customer, Video Inventory, and Open Rentals. We also need user views for the minor files: Video History, Customer History, and End Of Day Totals. If data coupling and memory usage
are not an issue, using a SQL database, we can create one user view for each of Customer, Video, and Open Rental, and create one joined user view using the common fields to link them together. The individual views are used for processes that do not
need all of the data together; the joined view can be used for query processing and for processes that need all of the data. The resulting data definitions for customer, video, open rentals, and the related user views are shown in Table 8-6. We also
need separate user views for the history files and EOD totals. They are included in the table.
At this point, with SQL software, we are ready to prototype the database. If either access method selection or storage mapping is an issue, a prototype should be built. Otherwise, the next step is to map user views to access methods and storage media.
This activity depends on the implementation environment and is beyond this text. The database may be walked through again at this point to verify processing requirements for the database. The database is then prototyped and documented. The information
needed for each program is included in program specifications. Team members are usually given an overview of the database environment either as part of the last walk-through or as a separate training session. When the prototype appears complete and
workable, test and production databases are developed.
4.5. Design Program Packages
Rules for Designing Program Packages
The activities for grouping modules into program packages are listed below; as you can see, they are general guidelines, not rules. There are no rules for packaging because it is an environment-dependent activity. Packages for firmware or an 8K micro computer are entirely different than packages for a mainframe. Also, the implementation language determines how and when some types of coupling are done. With these ideas in mind, the guidelines apply common sense to identifying program execute units.
1. Identify modules that perform functionally related activities, are part of iteration units, or which access the same data. The related modules identified should be considered for packaging together for execution.
2. Develop pseudo-code for the logic functions being performed. Use only structured programming constructs: iteration, selection, and sequence. Document complex logic using decision tables or decision trees.
3. Logically test the user views developed with the DBA to reevaluate their usefulness for each program package.
4. Design each module to have one entry and one exit.
5. Design each module such that its contents are unchanged from one execution to the next.
6. Design and document messages for called modules. Reevaluate the messages to minimize coupling.
7. Draw a diagram of the module and all other modules with which it interacts.
TABLE 8-5 ABC Data Requirements by Process
| Process | Customer | Video Inventory | Open Rental | Other |
|---|---|---|---|---|
| Get Valid Customer | Customer Phone, Name, Address, Credit Rating |
|||
| Get Open Rentals | Customer Phone, Video ID, Copy ID, Video Name, Rent Date, Return Date, Late Days, Fees Owed | |||
| Get Valid Video | Video ID, Copy ID, Video Name, Rental Price | |||
| Get First Return | Customer Phone, Video ID, Copy ID, Video Name, Rent Date, Return Date, Late Days, Fees Owed | |||
| Get Valid Video | Video ID, Copy ID, Video Name, Rental Price | |||
| Update Rentals | Customer Phone, Video ID, Copy ID, Video Name, Rent Date, Return Date, Late Days, Fees Owed | |||
| Process Fees and Money | End of Day Totals Total Price + Rental Information | |||
| Create Video history | Video History File: Year, month, Video ID, Copy ID | |||
| Create Customer history | Customer History File: Customer Phone, Video IP | |||
| Update Open Rentals | Customer Phone, Video ID, Copy ID, Video Name, Rent Date, Return Date Late Days, Fees Owed | |||
| Create New Rentals | Customer Phone, Video ID, Copy ID, Video Name Rent Date, Return Date, Late Days, Fees Owed | |||
| Print receipt | Customer Phone, Name, Address, For each Video: Video ID, Copy ID, Video Name, Rent Date, Return Date, Late Days, Fees. Owed, Total Price |
| Create Table Customer | Create Table Rental | ||||
|---|---|---|---|---|---|
| (Cphone | Char(lO) | Not null, | Cphone | Char(lO) | Not null, |
| Clast | VarChar(50) | Not null, | RentDate | Date | Not null, |
| Cfirst | VarChar(25} | Not null, | VideoID | Char(7) | Not null, |
| Cline1 | VarChar(50) | Not null, | CopyID | (Char(2 | Not null, |
| Cline2 | VarChar(50) | Not null, | RentPaid | Decimal(2,2) | Not null, |
| City | VarChar(530) | Not null, | FeesOwed | Decimal(2,2) | |
| State | Char(2) | Not null, | Primary Key | (CPhone, VideoID, CopyID), | |
| Zip | Char(lO) | Not null, | Foreign Key | ((VideoID) References Video) | |
| CCtype | Char(1) | Not null, | Foreign Key | ((VideoID, Copyld) References Copy), | |
| Ccno | Char(17) | Not null, | |||
| Ccexp | Date | Not null, | Foreign Key | (CPhone) References Customer); | |
| CCredit | Char(l), | Create view VidCrsRef | |||
| Primary key | (Cphone)); |
as select VideoID, CopyID, VideoName, RentPric
|
|||
| Create Table Video |
from Customer, Video, Copy
|
||||
| (VideoID | Char(7) | Not null, |
where Video.VideoID = Copy.VideoID;
|
||
| VideoNam | Varchar(50) | Not null, | Create view RentRef | ||
| VendorNo | Char(4) |
as select Cphone, Clast, Cfirst, VideoID, CopyID, VideoNam
|
|||
| TotCopies | Smallint |
VideoNam,
|
|||
| RentPrice | Decimal(I,2) |
RentPaid, RentPric, FeesOwed
|
|||
| Primary key | (videoID); |
from Customer, VidCrsRef, Rental
|
|||
| Create Table Copy |
where VidCrsRef.VideoID = Rental.VideoID
|
||||
| (Vide olD | Char(7) | Not null, |
and VidCrsRef.CopyID = Rental.CopyID
|
||
| CopyID | (Char(2) | Not null, |
and Customer.Cphone = Rental.Cphone;
|
||
| DateRecd | Date | ||||
| Primary key | (VideoID, CopyID), | ||||
| Foreign Key | ((VideoID) References Video); |
A program package is a collection of called modules, called functions, and in-line code that does some atomic process, and that will become an execute unit. The hierarchy of criteria for designing packages is to package by function, by iteration clusters, or by need to access the same data. At all times, you must keep in mind any production environment constraints that must also be part of the design. For instance, if the application will be on a LAN, you may want to design packages to minimize the possibility of multiple users for a process. Functional grouping is, by far, the most important.
Functional grouping ensures high cohesion for the program. Any modules that are required to perform some whole function should be grouped together. The other two considerations frequently apply to functional groups as well.
If a group of activities repeat as part of an iterative sequence, all activities in the group should be together in the program package. Individual modules can be coded and unit tested alone, but they should be packaged for integration testing and implementation.
Grouping modules that access the same data minimizes physical reading and writing of files. The major goal is to read the same data record in anyone pass of the processes no more than once. We want to minimize physical I/O because it is the slowest process
the computer performs. Grouping modules by data accessed minimizes the frequency of reading. Real-time applications, especially, are vulnerable to multiple reads and writes of the same data, slowing down response time.
Grouping modules by data access is a form of data coupling that minimizes the chance of unexpected changes to data. If we do not package modules together, but only read and write data once, the major alternative to common packaging is to use global data areas in memory. Global data is not protected and is vulnerable to corruption.
When the packages are complete, develop Structured English pseudo-code for the logic functions being performed. Use only structured programming constructs-iteration, selection, sequence. Document complex logic using decision tables or decision trees.
Include control structures and names for all modules. Pseudo-code may have been done as part of analysis, or earlier in design, as we did for ABC rental and return. Incidental activities, or less crucial activities, may have been overlooked or not
refined. Pseudo-code is completed now and structured for use in program specifications.
Decision tables and trees might be used to document complex decisions. While a discussion of them is beyond this text, an example of each is shown in Figure 8-3l.
As we design the program packages, we logically test the user views developed with the DBA to reevaluate their usefulness. The questions to ask are: Is all the needed data available? Is security adequate? Is extra data present? If any of these answers indicate a problem, discuss it with the DBA and determine his or her reasons for the design. If the design should change, the DBA is the person to do it.
Design each module to have one entry and one exit. Multiple entrances and exits to program modules imply problems because of selection and go to logic required to implement multiple exits and entrances. If each module is kept simple with one of each,
there are fewer testing, debugging, and maintenance problems.
Ideally, each module should have its internal data contents the same before and after a given execution. That is, the state and contents of the module should be unchanged from one execution to the next. This does not mean that no changes take place during an execution, only that all traces of changes are removed when the execution is complete. When a module must maintain a 'memory' of its last actions, coupling is not minimized.
Design and document messages for called modules. Messages should contain, at most, calling/ called module names, data needed for execution, control couples, and variable names for results of execution.
You might draw a diagram of the module and all other modules with which it interacts to facilitate visual understanding of the module and its role in the application.
ABC Video Example Program Package Design
Working with the final structure chart in Figure 8-30, our biggest decision is whether or not to package all of rental/return processing together, and how. Do we write one program with performed modules, one with called modules, or a combination of the two?
ABC is going to be in a SQL-compatible database environment, on a LAN, and requires access by PCs. The choice of language is not limited with these requirements, but packaging without knowing the language is not recommended. For this exercise, we will
assume that Focus,4 the 4GL, will be used.
Focus' application generator, called the "Dialogue Manager," allows both in-line and called modules to be used. Calling modules of nonFocus languages are allowed but can be tricky. The language has its own DBMS that is SQL-compatible, but it is not fully relational. It falls in the category of DBMSs called 'born again relational,' that is, the DBMS is hierarchic, networked, or relational at the DBA's discretion. Relationality is allowed but not required in Focus. Focus does not support the integrity rules. We will not redesign the database here since the SQL code above could be recoded without design changes in the Focus DBMS language.
At this point, we need to step back and decide how to package the entire application. What kind of 'glue' will hold customer maintenance, video maintenance, end-of-day, and rental/return processing together. We do not discuss screen design here because
it is not in the methodology (it is in Chapter 14), but we would finalize screens while these decisions are being made. We need all of the above functions to do this application, so all of the functions must be available in a unified environment.
This means that all functions must be available for execution within the same run environment. Screens are the 'glue' that users see that unify application processing. The code behind the screens mayor may not be unified depending on the design techniques
and language. With Focus, unification is done through the Dialogue Manager.
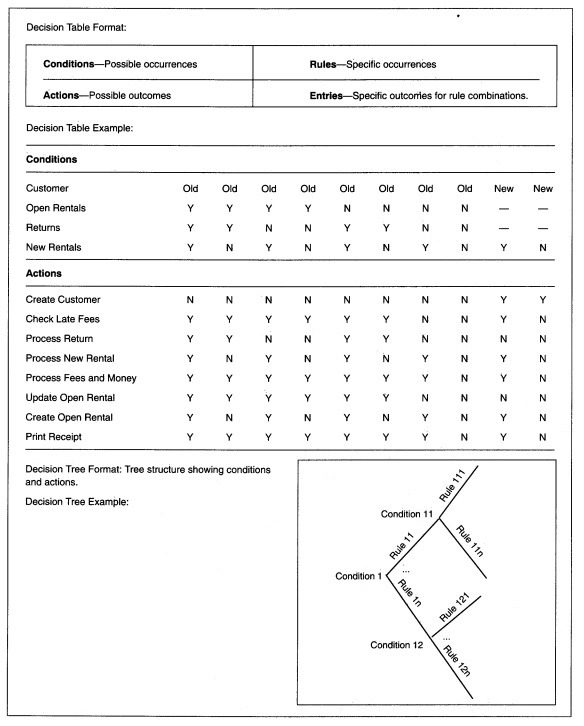
FIGURE 8-31 Decision Table and Decision Tree
4GL and PC-DBMS languages are deceptively simple. To perform trivial tasks is easy, but to build application requires expertise. Focus is no different. The complexities with Focus relate to when, where, and how often the databases are opened and processed, how the databases are related, and how many concurrent users are allowed. The concurrent environment increases DBA complexity but changes the answers to the questions about databases; it does not change the application code. So, we will assume one user at a time for processing.
Skeleton Focus code for the application is shown in Figure 8-32. Each DFD Level 0 process is accounted for at this level; we even have a query function that is new. Most applications require interactive file query and we have not talked about it at all
as part of the rental return application. The trend in business today is for users to develop their own reports and queries using some 4GL. When the language has a built-in query facility, you can add it to the processing without any analysis or design
work, as shown here with Focus. User developed queries allow users to 'stay in touch' with their data and remove a major design burden from IS personnel.
Now that the application is accommodated within one execute environment, we return to the problem of how to package rent/return processing. The ideal is to code and unit test each lowest level box on a structure chart as an independent module. Then, using the 'call' feature of the language, build a control structure, based on the design of the control and coordination boxes on the structure chart that calls modules as needed for execution. We will use this approach here as Figure 8-32 shows for the application, and Figure 8-33 shows for rental and return processing.
The alternative to called modules is in-line code that is 'performed' or executed as a pseudo-called module. This choice is selected with 3GL languages such as Cobol, Fortran, or PL/1 because it can be easier to code, test, and maintain.
4.6. Specify Programs
Rules for Specifying Programs
The specification documents all known information about programs. Program specifications document the program's purpose, process requirements, the logical and physical data definitions, input and output formats, screen layouts, constraints, and special processing considerations that might complicate the program. Keep in mind that the term program might also mean a module within a program or an externally called function, or even a code fragment (e.g., DB call). A program specification should include the items shown in Table 8-7. As with program packaging, there are no 'rules.' Rather there are items that should be included if they relate to the item being specified.
There are two parts to a program specification: one identifies interprogram relationships and communication, the other documents intraprogram processing that takes place within the individual program. Interfaces to other programs generally document who, what, when, where, and how communication takes place. Who identifies who initiates the communication and who, in the real world, is responsible for the interface. What identifies the message( s) content that is used for communication. When identifies the frequency and timing of the interface. Where locates the application and system in a hardware environment; where becomes complicated and is crucial to processing of distributed applications. How describes the nature of the interface-internal message, external diskette, and so forth.
Internal program processing information includes the data, processes, formats, controls, security, and constraints that define a particular program. Frequently, program specifications also include a flowchart of the program logic, a system flowchart showing the system names of the files, and a detailed specification of timing and other constraints.
| Focus Code | Explanation |
|---|---|
|
-Set &&Globalvariables -Include Security -Run -* -Mainline -Include Mainmenu -Run -If &&Choice eq 'R' goto RentRet else -If &&Choice eq 'V' goto Vidmain else -If &&Choice eq '0' goto EndOfDay else -If &&Choice eq 'Q' goto Query else -If &&Choice eq 'S' goto StopSystem else -Goto Mainmenu; -* -RentRet -Include RentRet -Run -Goto Mainline -* -Vidmain -Include Vidmain -Run -Goto Mainline -* -Custmain -Include Custmain -Run -Goto Mainline -* Query -Include Tabltalk -Run -Goto Mainline -* -EndOfDay -Include Endofday -Run -Goto Mainline -*-StopSystem -End |
Set variables needed for intermodule communication. Check password in a security module. Check password before any other processing. Comment indicator A label identifying the main routine. The call statement in Focus is 'INCLUDE.' Mainmenu is a module name. Perform Mainmenu before any other processing. Interrogate the choices from Mainmenu to decide what to do next. If in error, go back to the Mainmenu screen. RentReturn Label Call Rent/Return processing. When Rent/Ret is complete, return to the Mainmenu. Video Maintenance Label and Processing
Customer Maintenance Label and Processing Query Label and Processing End-of-Day Label and Processing Stop System Label End Processing |
FIGURE 8-32 ABC Video Processing Focus Mainline
| RentRet Focus Mainline Code |
|---|
|
-Set &&Globalvariables -*Rental and Return Processing -Crtform Line 1 -" ABC Video Rental Processing System <d.&date" -" Rentals and Returns" -"" -" Scan or enter a card or video: <&&Entry" -If &&entry like 't&' goto Return else -If &&entry like 'c&' goto Rental else -Include Entryerr; -Run -Return -Include ValidCus -Include Open Rent -Include ValidVid -Goto exit -Run -Rental -Include FirstRet -Include Open Rent -Crtform Line 15 - Do you want to do rentals? <&&Rentresp/1" -If &&Rentresp ne 'y' goto exit else -Include ValidVid -Goto exit -Run -Exit -End |
FIGURE 8-32 ABC Video Processing Focus Mainline
ABC Video Example Program Specification
The program specification for one program to perform Get Valid Customer is shown as an example (see Table 8-8). Since this is a compilation of already known information there is no discussion.
| TABLE 8-7 Program Specification Contents |
|---|
|
Identification Purpose Characteristics Reference to Applicable Documents DFD and Structure Chart (possibly also System Flowchart and Program Flowchart) Narrative of procedures in Structured English, Decision Tables, Decision Trees Automated Interface Definition Screen Interface Screen Design, Dialog Design, Error Messages Application Interface Communications Messages, Error Procedures Frequency, Format, Type, Responsible person Input, Output, and System Files Logical data design User views, internal name, graphic of physical data structure List of physical data structures Tables and Internal Data Internal name, graphic of physical data structure List of physical data structures Reports Frequency, Format, Recipients, Special processing |
5. Automated Support Tools for Process-Oriented Design
Automated support in the form of CASE tools is also available, although fewer products support structured design than support structured analysis. Several entries provide Lower CASE support that begins with program specification or code generation (see Table 8-9).
| TABLE 8-8 ABC Example Get Valid Customer Program Specification |
|---|
|
Identification: Get Valid Customer, (ValidCus) Purpose: Retrieve Customer Record and verify credit worthiness Characteristics: Focus Included module References: See System Specification, Pseudo-code for CustMain DFD: Attached as Appendix 1 Structure Chart: Attached as Appendix 2 Narrative: Accept CPhone Read Customer Using CPhone If read is successful If CCredit Ie '1' continue else Display "Customer has a credit problem; rating = <CCredit" Display "Override or cancel? : <&Custcredit" If &Custcredit eq 'C' include Cancell Return else If &Custcredit eq '0' continue else include crediterr return else Include CreatCus. Set &&ValidCus to 'Yes'. Set global customer data to values for all fields. Return. Screen Interface Screen Design: None Dialog Design: None Error Messages: "Customer has a credit problem; rating = <CusCredit" "Override or cancel? : <&Custcredit" Application Interface None Input: Customer File User views Customer Internal data names: Customer Contents in Data Dictionary Tables and Internal Data Global fields correspond to all Customer File fields. Set all fields to customer record values upon successful processing. Reports: None |
TABLE 8-8 ABC Example Get Valid Customer Program Specification (Continued)
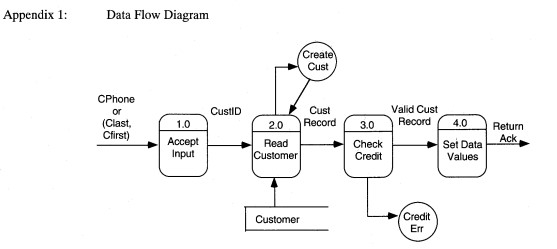
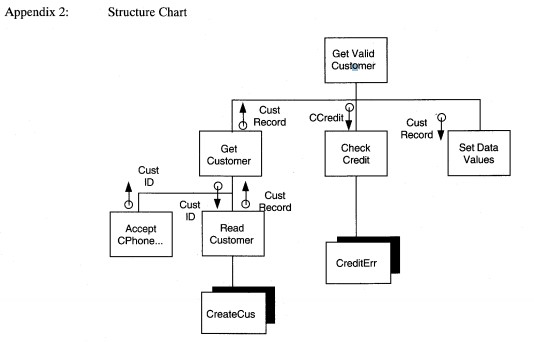
Appendix 3: User View with Data Names
| Table Customer | State | Char(2) | Not null, | ||
|---|---|---|---|---|---|
| (Cphone | Char(lO) | Not null, | Zip | Char(lO) | Not null, |
| Clast | VarChar(50) | Not null, | CCtype | Char(l) | Not null, |
| Cfirst | VarChar(25) | Not null, | Ccno | Char(l7) | Not null, |
| Clinel | VarChar(50) | Not null, | Ccexp | Date | Not null, |
| Cline2 | VarChar(50) | Not null, | CCredit | Char(l), | |
| City | VarChar(530) | Not null, | Primary key | (Cphone)); |
| Product | Company | Technique |
|---|---|---|
|
Analyst/Designer Toolkit Anatoool, Blue/60, MacDesigner The Developer Excelerator IEW,ADW (PS/2 Version) Maestro MacAnalyst, MacDesigner Multi-Cam |
Yourdon, Inc. New York, NY Advanced Logical SW Beverly Hills, CA ASYST Technology, Inc Napierville, IL Index Tech. Cambridge, MA Knowledgeware Atlanta, GA SoftLab San Francisco, CA Excel Software Marshalltown, LA AGS Mgmt Systems King of Prussia, PA |
Structure Chart Structure Charts Structured English Structure Chart Operations Process Diagram Systems Flowchart Structure Chart Flowchart Structure Chart Nassi-Schneiderman Hierarchic input-process-output charts (HIPO) User Defined Functions Decision Table Structured English Structure Chart Structure Chart |
6. Strengths and Weaknesses of Process Analysis and Design Methodologies
The objectives of structured analysis and design are reasonably clear; the manner of obtaining the objectives is much less clear. Structured methods rely on the individual SE's expertise to design the technical details of the application. For implementation specific details, that makes sense, but the heuristics for evaluation cannot be applied in every situation. Consequently, the SE must know what situations apply and don't apply. More than the other methods discussed in this book, you must know when to adhere to, bend, and break the rules of structured methods.
The methodology's ability to result in minimal coupling and maximal cohesion is low because of its reliance on the SE's ability. If coupling and cohesion are not optimal, maintenance will cost more than it should, and the application will be difficult to test. In 1972, D. Parnas wrote about maximal cohesion and minimal coupling as desirable characteristics of programs. In 1968, Dijkstra wrote about the problems with 'go to' statements in programs and proposed goto-Iess programming. In 1966, Bohm and Jacopini proposed structured programming's minimalist contents as sequence, iteration (e.g., if ... then ... else) and selection (e.g., do while and do until). By the time structured analysis and design were documented in books, the notions of coupling and cohesion were understood fairly well; but how to obtain them was not.
| Product | Company | Technique |
|---|---|---|
| PacBase ProKitVVorkbench ProMod SVV Thru Pictures System Architect Teamwork Visible Analyst Telon, and other products vs Designer |
CGI Systems, Inc. Pearl River, NY McDonnell Douglas St. Louis, MO Promod, Inc. Lake Forest, CA Interactive Dev. Env. San Francisco, CA Popkin Software and Systems, Inc. NY, NY Cadre Technologies, Inc. Providence, RI Visible Systems Corp. Newton, MA Intersolv, Cambridge, MA Visual Software, Inc. Santa Clara, CA |
Process Decomposition Structure Chart Flowchart Structure Chart Module Networks Function Networks Structure Chart Flowchart Structure Chart Control Flow Decision Table Structure Chart Structure Chart Code Generation for Cobol-SQL, C, and others Structure Chart Warnier-Orr |
General statements about keeping the pieces small and related to one part of the problem domain rely on the analyst to know what to do and when to start and stop doing it. Unfortunately, only experience can guide such vague suggestions. While novices can learn to rely on the methodology to guide their actions, they have no basis for evaluating the correctness or incorrectness of their work. Thus, the apprenticeship approach, with a junior person working with a more senior one to learn how to evaluate designs, is required. The more complex the application, the more important having experienced senior analysts becomes.
Another problem is that structured design does not encompass enough of the activities to make it a complete methodology. We must have screen designs in order to develop a program specification. We must know the details of interfaces to other applications
and messages to/from them to be able to develop program specifications. Structured methods do not pay any attention to either of these issues. To develop an application, the SE needs to analyze requirements and design for control, input, output, security,
and recoverability. None of these are encompassed in the process-oriented methods. To summarize, process methods are useful in analyzing and designing applications that are procedural in nature; but the methods omit a great many required analysis
and design activities.
7. Summary
In this chapter, structured design which follows structured analysis in development, was discussed. The results of structured analysis-a set of leveled data flow diagrams, data dictionary, and procedural requirements-are the inputs to the design process. The major results of structured design are program specifications which detail the mapping of functional requirements into the production hardware and software environment.
First, using either transaction or transform analysis, the DFD is partitioned into afferent, efferent, and central transform processes. The streams of processing are factored to develop a structure chart. The processes are further decomposed into system-like subprocesses until further decomposition would change the nature of the process. Data requirements are documented in data couples; control is documented in control couples. The chart is evaluated for fan-out, fan-in, skew, cohesion, coupling, scope of effect, and scope of control. The structure chart is revised and reevaluated as required.
The physical database is designed. Data needs for each data flow in the application are listed by process. Data similarities are matched and used to define user views. The access method and physical mapping are then decided. Physical database design walk-throughs may be held to validate the design. Test and production databases are created.
Program packages are decided based on the application concept and timing. The packages define which modules will communicate and how. Pseudo-code for processes is finalized and uses only structured programming constructs-iteration, sequence, and selection. Decision tables and trees are used, as necessary, to document complex decisions.
Finally, program specifications are written to document all known information about each module, function, or program. Specifications include data, process, interface, constraint, and production information needed for a programmer to code and unit test
the work.