In this section we elaborate on the following:
At any point in time, insurance markets (mostly in the property/casualty lines of insurance) may be in hard market or soft market conditions because of the underwriting cycle. Soft marketCondition that occurs when insurance losses are low and prices are very competitive. conditions occur when insurance losses are low and prices are very competitive. Hard marketCondition that occurs when insurance losses are above expectations and reserves no longer are able to cover all losses. conditions occur when insurance losses are above expectations (see loss development in Chapter 7 "Insurance Operations") and reserves are no longer able to cover all losses. Consequently, insurers or reinsurers have to tap into their capital. Under these conditions, capacity (measured by capital level relative to premiums) is lowered and prices escalate. A presentation of the underwriting cycle of the property/casualty insurance industry from 1956 to 2008 is featured in Figure 8.2 "Underwriting Cycles of the U.S. Property/Casualty Insurance Industry, 1970–2008*". The cycle is shown in terms of the industry’s combined ratio, which is a measure of the relationship between premiums taken in and expenditures for claims and expenses. In other words, the combined ratioThe loss ratio (losses divided by premiums) plus the expense ratio (expenses divided by premiums). is the loss ratio (losses divided by premiums) plus the expense ratio (expenses divided by premiums). A combined ratio above one hundred means that, for every premium dollar taken in, more than a dollar was spent on losses and expenses. The ratio does not include income from investments, so a high number does not necessarily mean that a company is unprofitable. Because of investment income, an insurer may be profitable even if the combined ratio is over 100 percent. Each line of business has its own break-even point because each line has a different loss payment time horizon and length of time for the investment of the premiums. The break-even point is determined on the basis of how much investment income is available in each line of insurance. If a line has a longer tail of losses, there is a longer period of time for investment to accumulate.
Figure 8.2 Underwriting Cycles of the U.S. Property/Casualty Insurance Industry, 1970–2008*
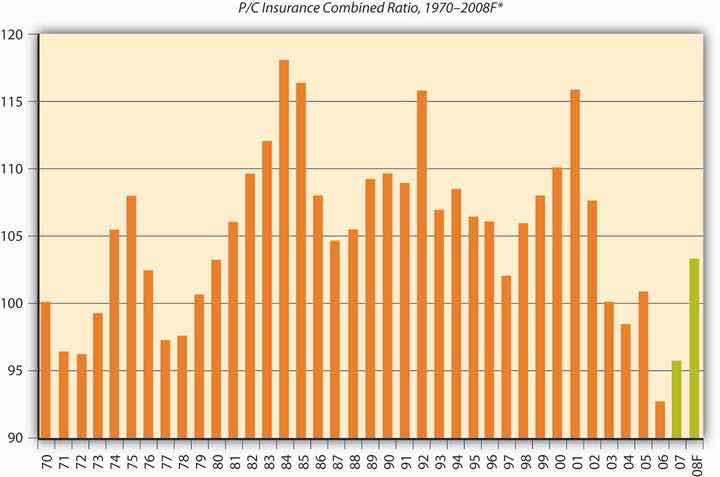
* Peaks are hard markets; valleys are soft markets.
† A.M. Best year-end estimate of 103.2; actual nine-month result was 105.6.
Source: Insurance Information Institute, 2009; A.M. Best; ISO, III
As you can see in Figure 8.2 "Underwriting Cycles of the U.S. Property/Casualty Insurance Industry, 1970–2008*", the ups and downs are clearly visible across the whole industry for all lines of business. When the combined ratio is low, the industry lowers its underwriting standards in order to obtain more cash that can be invested—a strategy known as cash flow underwritingStrategy pursued when the combined ratio is low, in which the industry lowers its underwriting standards in order to obtain more cash that can be invested.. The industry is regarded as competing itself to the ground, and underwriting standards are loose. The last soft market lasted about fifteen years, ending in the late 1990s. From 1986 to 1999, the combined ratio stayed in the range of 101.6 in 1997 to 109.6 in 1990, with only one jump in 1992 to a combined ratio of 115.7. Because the break-even point of the industry combined ratio is 107, the industry was doing rather well during that long period. It caused new decision makers (those without experience in underwriting cycles) to be less careful. In addition, computerized pricing models gave a false sense of security in making risk-selection and pricing decisions. Actual losses ended up causing rate increases, and the soft market changed into a true hard market.
During the 1990s, the soft market conditions lasted longer than usual because the industry had large capacity. There were speculations that the introduction of capital markets as an alternative to reinsurance (see Chapter 3 "Risk Attitudes: Expected Utility Theory and Demand for Hedging") kept rates down. In April 2005, the Insurance Information Institute reported that the 2004 statutory rate of return on average surplus was 10.5 percent, up from 9.5 percent for calendar year 2003, 1.1 percent for 2002, and −2.3 percent for 2001 (one of the worst years ever). The 2004 recovery is the most remarkable underwriting recovery in modern history, with insurers slicing 17.6 points off the combined ratio in just three years. Additional improvement is shown in 2006, a year after Hurricane Katrina.
For each line of insurance, there is a level of combined ratio that determines whether the line is profitable or not. The level of combined ratio that is required for each line of business to avoid losing money is called the break-even combined ratio levelThe level of combined ratio that is required for each line of business to not lose money.. Depending on the investment income contribution of each line of insurance, the longer tail lines (such as general liability and medical malpractice) have a much larger break-even level. Fire and allied lines as well as homeowner’s have the lowest break-even combined ratio levels because the level of investment income is expected to be lower. Thus, if the actual combined ratio for homeowner’s is 106, the industry is experiencing negative results. The break-even for all lines of the industry is 107. If the industry’s combined ratio is 103, the industry is reaping a profit. The largest break-even combined ratio is for the medical malpractice line, which is at 115; for general and product liability lines, it is 113; and for worker’s compensation, it is 112. The lowest break-even combined ratio is 103 for homeowner’s and 105 for personal auto.
The soft market climate of 2005 helped the industry recover from the devastation of hurricanes Katrina, Rita, and Wilma. Some even regard the impact of these major catastrophes as a small blip in the underwriting results for the property/casualty industry, except for the reinsurers’ combined ratio. Table 8.2 "The Ten Most Costly Catastrophes in the United States*" shows the adjusted amounts of loss for these catastrophes. Despite the high magnitude of these losses, market analysts projected a stable outlook for the property/casualty industry in 2006. In fact, the actual combined ratio for that year was the lowest observed in decades, at 92.6, as indicated in Figure 8.2 "Underwriting Cycles of the U.S. Property/Casualty Insurance Industry, 1970–2008*".
Table 8.2 The Ten Most Costly Catastrophes in the United States*
| Insured Loss (Millions of $) | ||||
|---|---|---|---|---|
| Rank | Date | Peril | Dollars when Occurred | In 2008 DollarsAdjusted to 2008 dollars by the Insurance Information Institute. |
| 1 | Aug. 2005 | Hurricane Katrina | $41,100 | $45,309 |
| 2 | Aug. 1992 | Hurricane Andrew | 15,500 | 23,786 |
| 3 | Sept. 2001 | World Trade Center and Pentagon terrorist attacks | 18,779 | 22,830 |
| 4 | Jan. 1994 | Northridge, CA, earthquake | 12,500 | 18,160 |
| 5 | Oct. 2005 | Hurricane Wilma | 10,300 | 11,355 |
| 6 | Sept. 2008 | Hurricane Ike | 10,655Estimated. | 10,655“Weiss: Life Profits Jump 42 Percent,” National Underwriter, Life & Health/Financial Services Edition, March 15, 2005. |
| 7 | Aug. 2004 | Hurricane Charley | 7,475 | 8,520 |
| 8 | Sept. 2004 | Hurricane Ivan | 7,110 | 8,104 |
| 9 | Sept. 1989 | Hurricane Hugo | 4,195 | 7,284 |
| 10 | Sept. 2005 | Hurricane Rita | 5,627 | 6,203 |
| * Property coverage only. Does not include flood damage covered by the federally administered National Flood Insurance Program. | ||||
Source: Insurance Information Institute (III). Accessed March 6, 2009. http://www.iii.org/media/hottopics/insurance/catastrophes/.
In addition to the regular underwriting cycles, external market conditions affect the industry to a great extent. The 2008–2009 financial crisis impact on the property/casualty insurance industry is discussed in the box below.
There’s a fair chance that your bank has changed names—perhaps more than once—within the past twelve months. A year from now, it may do so again. While your liquid assets may be insured through the Federal Deposit Insurance Corporation (FDIC), it is understandable that such unpredictability makes you nervous. Quite possibly, you have suffered personally in the economic recession as well. You may have lost your job, watched investments erode, or even experienced home foreclosure. Investment banks, major retailers, manufacturers, and firms across many industries, large and small, have declared bankruptcy, turned to government subsidy, or collapsed altogether. In light of the bleak realities of the recession, you have no doubt reexamined the things in your life you have come to depend on for security. The question is raised, Should you also worry about the risks you are insured against? Should you worry about your insurance company? The outlook is more optimistic than you may think. Chances are, the home, auto, or commercial property insurer you are with today is the insure you will be with tomorrow (should you so desire).
It is now known that the 2008–2009 economic recession began in December of 2007. It is the longest recession the United States has experienced since 1981; should it extend beyond April 2009, it will be the longest recession in United States history since the Great Depression. At the time of writing, 3.6 million jobs have been lost during the course of the recession, leaving 12.5 million U.S. workers unemployed. The Bureau of Labor Statistics reported an unemployment rate of 8.1 percent in February of 2009, the highest since November of 1982. It is anticipated that unemployment will peak at 9 percent by the end of 2009. The Dow Jones industrial average lost 18 percent of its value and the S&P 500 declined by 20 percent as a result of the October 2008 market crash. In 2007, 1.3 million U.S. properties faced foreclosure, up a staggering 79 percent from 2006. This was just the tip of the iceberg, however, with foreclosures increasing by 81 percent in 2008, amounting to 2.3 million properties. Conditions like these have been damaging to homeowners and organizations alike. Firms that were weak going into the crisis have been decimated, while even resilient companies have seen profits and net worth shrink. With people out of jobs and homes, discretionary spending has contracted considerably. The effects on property and casualty insurers, though, have been less direct.
The property/casualty segment has been hurt by problems in the stock market, real estate, and auto industry primarily. Underwriting alone rarely produces an industry profit; investments account for most of the industry’s positive returns. With stocks hit hard by the recession, even the conservative investments typically made by property/casualty insurers have posted poor returns. New home starts dropped 34 percent from 2005–2007, a net decline of 1.4 million units. To insurers, this represents revenues foregone in the form of premiums that could be collected on new business, potentially amounting to $1.2 billion. Auto and light trucks are projected to have the worst unit sales in 2009 since the late 1960s with a reduction of 6 million units. The effect of poor performance in underlying businesses is less pronounced on auto insurers than on home insurers but still substantial. Workers’ compensation insurers (to be discussed in Chapter 16 "Risks Related to the Job: Workers’ Compensation and Unemployment Compensation") have seen their exposure base reduced by the high unemployment rate.
Nonetheless, the industry attributes recent financial results more to basic market conditions than the economic recession. The combination of a soft market (recall the discussion in Chapter 8 "Insurance Markets and Regulation") and high catastrophe experience meant a reduction in profits and slow growth. Property/casualty industry profits were 5.4 billion in 2008, down considerably from 61.9 billion in 2007. The 2007 performance, however, was down slightly from an all-time record industry profit in 2006. The 2008 drop is less noteworthy in the wider context of historical annual profits, which are highly correlated with the fluctuating market cycles. Despite the dire economic condition, two important points are made clear: the insurance industry, on the whole, is operating normally and continues to perform the basic function of risk transfer. Insurers are able to pay claims, secure new and renewal business, and expand product offerings. The problems at American International Group (AIG) (discussed in Chapter 7 "Insurance Operations") have been the exception to the rule. Low borrowing, conservative investments, and extensive regulatory oversight have also aided insurance companies in avoiding the large-scale problems of the crisis. All of these factors were inverted in the case of the imperiled banks and other financial institutions. Consider the following: between January 2008 and the time of this writing, forty-one bank failures were observed. This is in comparison to zero property/casualty insurer failures.
The $787 billion stimulus package authorized by the American Recovery and Reinvestment Act of 2009 is further expected to help matters. The program aims to save or create 3.5 million jobs. Of the stimulus, 24.1 percent of funding is intended for spending on infrastructure, 37.9 percent on direct aid, and 38 percent on tax cuts. Insurers will see no direct injection of capital and virtually no indirect benefits from the latter two components of the stimulus package. As it relates to infrastructure spending, however, workers’ compensation insurers will be helped by the boost in employment. Considerable outlays on construction projects will also increase demand for commercial property insurance. Renewed investor confidence in the stock market would also enhance investment returns considerably. Just as insurers are indirectly harmed by the crisis, so too will they indirectly benefit from recovery efforts.
Of course, the success of the stimulus plan remains unproven, so the insurance industry must prepare for the uncertain future. In the current economic climate, investments cannot be relied upon as the major driver of industry profitability that they once were. This calls for even greater discipline in underwriting in order for companies to remain solvent. With the federal government taking an unusually active role in correcting deficiencies in the market, a new wave of regulation is inevitable. New compliance initiatives will be introduced, and existing protections may be stripped away. Still, the insurance industry may be uniquely equipped to cope with these challenges, as exemplified by the fundamental nature of their business: risk management. By practicing what they preach, insurers can be rewarded with insulation from the most detrimental effects of the recession and emerge as role models for their fellow financial institutions.
Sources: Dr. Robert P. Hartwig, “Financial Crisis, Economic Stimulus & the Future of the P/C Insurance Industry: Trends, Challenges & Opportunities,” March 5, 2009, accessed March 9, 2009, http://www.iii.org/media/presentations/sanantonio/; United States Department of Labor, Bureau of Labor Statistics, “The Unemployment Situation: February 2009,” USDL 09-0224, March 6, 2009, accessed March 9, 2009, http://www.bls.gov/news.release/archives/empsit_03062009.pdf; “U.S. FORECLOSURE ACTIVITY INCREASES 75 PERCENT IN 2007,” RealtyTrac, January 9, 2008, accessed March 9, 2009, http://www.realtytrac.com/ContentManagement/pressrelease.aspx?ChannelID=9&ItemID= 3988&accnt=64847; Mark Huffman, “2008 Foreclosure Activity Jumps 81 Percent,” ConsumerAffairs.com, January 15, 2009, accessed March 9, 2009, http://www.consumeraffairs.com/news04/2009/01/foreclosure_jumps.html.
The life and health insurance markets do not show similar underwriting cycles. As you saw in Chapter 7 "Insurance Operations", the investment activity of the life/health industry is different from that of the property/casualty segment. In recent years, focus has shifted from traditional life insurance to underwriting of annuities (explained in Chapter 21 "Employment-Based and Individual Longevity Risk Management"). Net premiums for life/health insurers increased by 5.7 percent to $616.7 billion and investment income increased by 4.9 percent to $168.2 billion in 2007.Insurance Information Institute (III), Insurance Fact Book 2009, 19. However, in recent years, many life insurance companies have invested in mortgage-backed securities with impact on their capital structure, as detailed in “Problem Investments and the Credit Crisis” of Chapter 7 "Insurance Operations". These investments and the effects of the recession brought about a host of problems for the life/health industry in 2008 that have continued into 2009. You will read about such issues in “The Life/Health Industry in the Economic Recession of 2008–2009” of Chapter 19 "Mortality Risk Management: Individual Life Insurance and Group Life Insurance". As of writing this chapter, the Wall Street Journal reported (on March 12, 2009) that life insurers “are being dragged down by tumbling markets and hope a government lifeline is imminent.”Scott Patterson and Leslie Scism, “The Next Big Bailout Decision: Insurers,” Wall Street Journal, March 12, 2009, A1.
Health insurance consists of coverage for medical expenses, disability, and long-term care (all covered in Chapter 22 "Employment and Individual Health Risk Management"). Figure 8.3 "National Health Expenditures Share of Gross Domestic Product, 1993–2014" shows how health insurance expenditures increased as a percentage of the gross domestic product in 2006 to 16 percent. Expenditures are projected to increase to 18.7 percent in 2014. In 2007, total health insurance premiums amounted to $493 billion.Insurance Information Institute (III), Insurance Fact Book 2009, 23. As with life insurance, emphasis on product offerings in the health segment has seen a transition over time in response to the changing consumer attitudes and needs. The year 1993 marks the beginning of the shift into managed care plans, the features of which are again discussed in Chapter 22 "Employment and Individual Health Risk Management".
Despite the managed-care revolution of the 1990s, health care costs continued to increase with no relief in sight.Ron Panko, “Healthy Selection: Less Than a Decade After the Managed-Care Revolution Began in Earnest, New Styles of Health Plans Are on the Market. Proponents See Them As the Next Major Trend in Health Insurance,” Best’s Review, June 2002. The role of health insurers in influencing insureds’ decisions regarding medical treatment has been a topic of controversy for many years in the United States. Some Americans avoid seeking medical care due to the high health care costs and their inability to afford insurance. These and other issues have motivated health insurance reform efforts, the most recent of which have originated with new President Barack Obama. For an in-depth discussion, see “What is the Tradeoff between Health Care Costs and Benefits?” in Chapter 22 "Employment and Individual Health Risk Management".
Figure 8.3 National Health Expenditures Share of Gross Domestic Product, 1993–2014
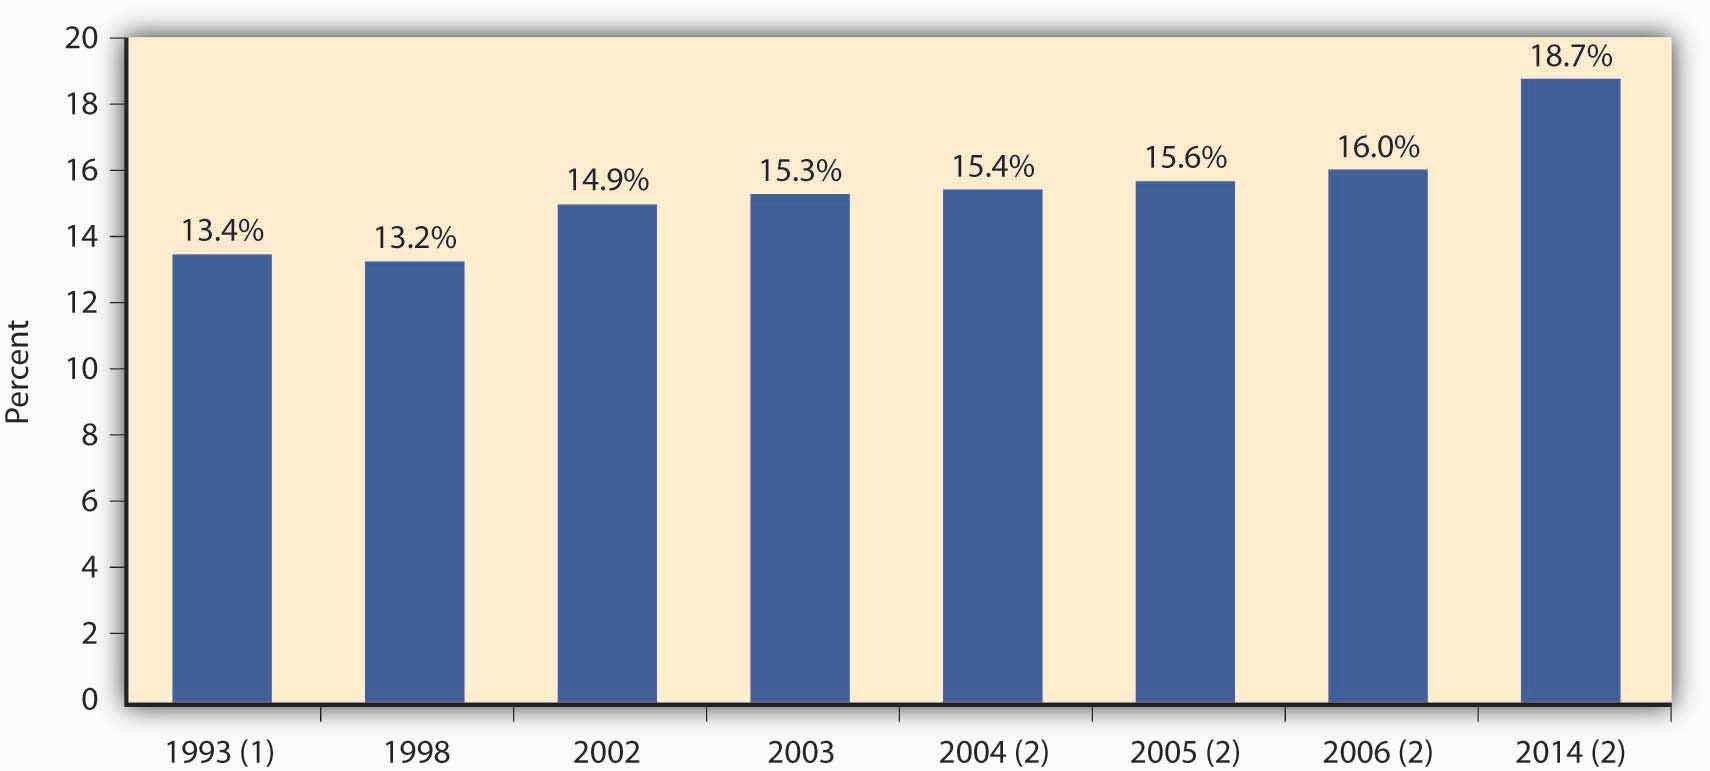
(1) Marks the beginning of the shift to managed care.
(2) Projected.
Source: Insurance Information Institute per the Centers for Medicare and Medicaid Services, Office of the Actuary; U.S. Department of Commerce, Bureau of Economic Analysis and Bureau of the Census.
Reinsurers, by the nature of their business, suffer to a greater extent when catastrophes hit. This fact requires better understanding of not only the reinsurance operations described in Chapter 7 "Insurance Operations" but also the global reinsurance markets and their players.
The top ten reinsurance companies by gross premiums written for 2007 are provided in Table 8.3 "Top Ten Global Reinsurance Companies by Gross Premiums Written, 2007". Reinsurance is an international business out of necessity. The worldwide growth of jumbo exposures, such as fleets of wide-bodied jets, supertankers, and offshore drilling platforms, creates the potential for hundreds of millions of dollars in losses from one event. No single insurer wants this kind of loss to its income statement and balance sheet. One mechanism for spreading these mammoth risks among insurers is the international reinsurance market.
As you can see in Table 8.3 "Top Ten Global Reinsurance Companies by Gross Premiums Written, 2007", most of the largest reinsurers are based in Europe. The last two in the list are in Bermuda, an emerging growth market for reinsurance. The Bermuda insurance industry held $146 billion in total assets in 2000, according to the Bermuda Registrar of Companies. Insurers flock to Bermuda because it is a tax haven with no taxes on income, withholding, capital gains, premiums, or profits. It also has a friendly regulatory environment, industry talent, and many other reinsurers. After September 11, a new wave of reinsurers started in Bermuda as existing reinsurers lost their capacity. These reinsurers have since suffered substantial losses as a result of the catastrophic hurricanes of 2004 and 2005.David Hilgen, “Bermuda Bound—Bermuda: Insurance Oasis in the Atlantic,” and “Bermuda Bound—The New Bermudians,” Best’s Review, March 2002.
Table 8.3 Top Ten Global Reinsurance Companies by Gross Premiums Written, 2007
| Company | Country | Net Reinsurance Premiums Written (Millions of $) |
|---|---|---|
| Munich Re Co. | Germany | $30,292.9 |
| Swiss Re Co. | Switzerland | 27,706.6 |
| Berkshire Hathaway Re | United States | 17,398.0 |
| Hannover Rueckversicherung AG | Germany | 10,630.0 |
| Lloyd’s | United Kingdom | 8,362.9 |
| SCOR SE | France | 7,871.7 |
| Reinsurance Group of America, Inc. | United States | 4,906.5 |
| Transatlantic Holdings, Inc. | United States | 3,952.9 |
| Everest Reinsurance Co. | Bermuda | 3,919.4 |
| PartnerRe Ltd. | Bermuda | 3,757.1 |
Source: Insurance Information Institute (III). The Insurance Fact Book 2009, p 42.
In this section you studied the following:


