Like other markets, the market for foreign exchange can be graphically modeled to help us visualize the action, as in Figure 18.8 "Equilibrium in the market for USD". There are a number of ways to do this, but perhaps the easiest is to plot the quantity of dollars on the horizontal and the exchange rate, stated in terms of foreign divided by domestic (say, yen or ¥/USD) on the vertical. The supply of dollar assets will be perfectly vertical, unchanged at every exchange rate. The demand for dollars, by contrast, will have the usual downward slope because, at higher exchange rates, fewer dollar assets will be demanded than at lower exchange rates. So at ¥120 to 1 USD, relatively few dollar-denominated assets will be demanded compared to only ¥100 or ¥80 per dollar. The intersection of the supply and demand curves will determine E*, which in this case is ¥100/$, and q*, which in this case is $100 billion.
Figure 18.8 Equilibrium in the market for USD
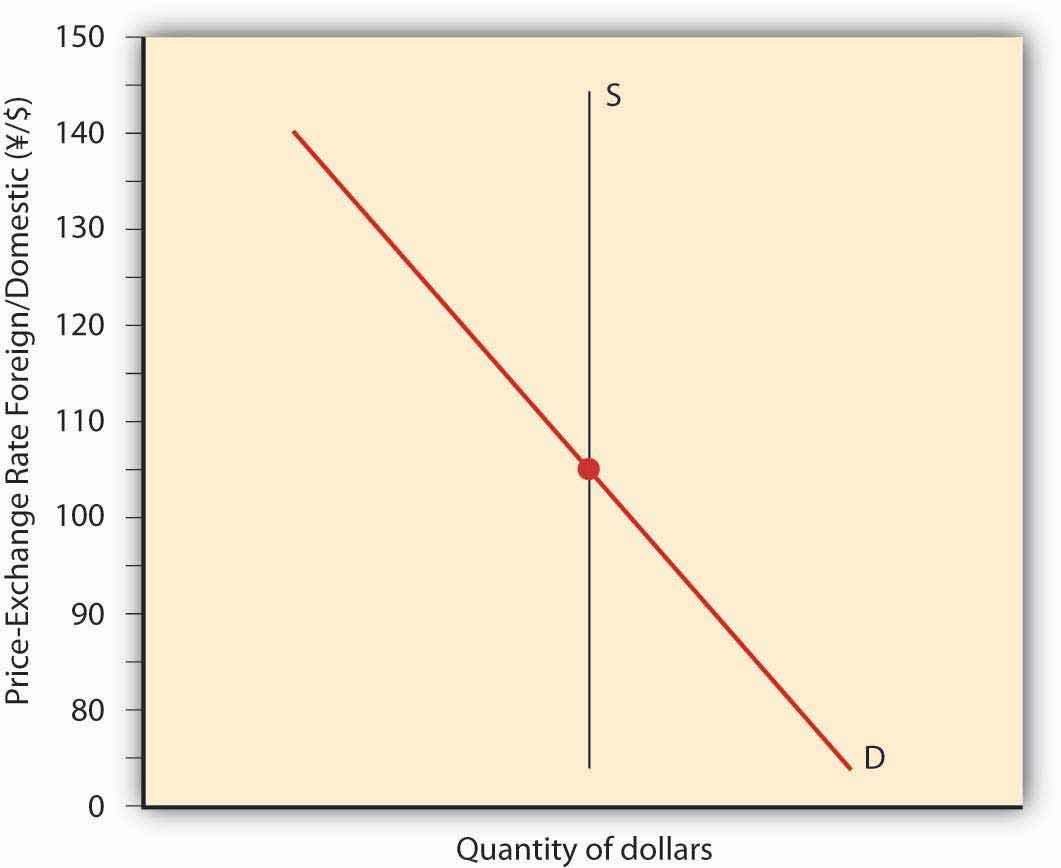
We can immediately see that, holding all else constant, anything that increases demand for dollar-denominated assets (shifts the demand curve to the right), including an increase in the domestic interest rate, a decrease in the foreign interest rate, or an increase in Eef (for any reason, including the variables in Figure 18.5 "Determinants of exchange rates in the long run"), will cause the dollar to appreciate (E* to increase when stated in terms of foreign/domestic or in this case ¥/$). Anything that causes demand for dollar-denominated assets, including a decrease in the domestic interest rate, an increase in the foreign interest rate, or a decrease in Eef, to decrease (shift the demand curve to the left) will cause the dollar to depreciate (E* to decrease when stated in terms of foreign/domestic).
Post-dict Figure 18.9 "Euro-dollar exchange rate, 2000–2007" using Figure 18.10 "Interest rates in Europe and the United States, 2000–2007" and Figure 18.11 "Differential inflation in the United States and the Euro zone, 2000–2007".
Figure 18.9 Euro-dollar exchange rate, 2000–2007
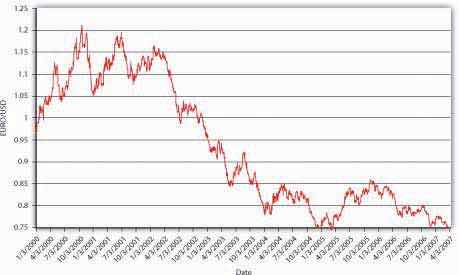
Figure 18.10 Interest rates in Europe and the United States, 2000–2007
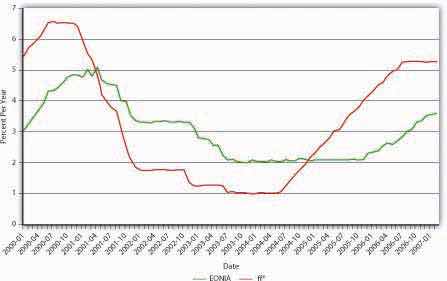
Figure 18.11 Differential inflation in the United States and the Euro zone, 2000–2007
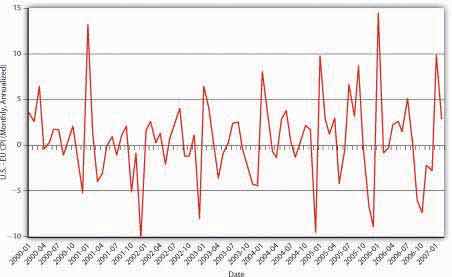
From the beginning of 2000 until early 2002, the dollar appreciated against the euro, moving from rough parity (1 to 1) to €1.10 to €1.20 per USD. This isn’t surprising given that U.S. interest rates (proxied here by the fed funds rate ff*) were higher than euro zone interest rates (proxied here by EONIA, the ECB’s fed funds equivalent). Moreover, except for the spike in early 2001, the price level in the United States did not rise appreciably faster than prices in the euro zone did. Since mid-2002, prices in the United States have risen faster than prices in the euro zone. (There are more periods when the consumer price index [CPI] in the United States was > the CPI in the euro zone, for example, when the red line is above zero.) Since mid-2004, interest rates have risen more quickly in the United States than in the euro zone, but not enough to offset the higher U.S. inflation rate. Fears of a recession in the United States and slowing U.S. productivity also dragged on the dollar.


