 Print this chapter
Production Choices and Costs: The Short Run
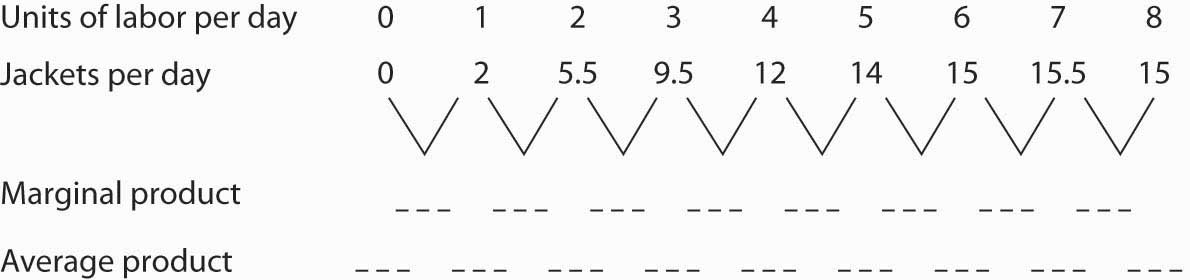
TRY IT!
1. Suppose Acme gets some new equipment for producing jackets. The table below gives its new production function. Compute marginal product and average product and fill in the bottom two rows of the table. Referring to Figure 8.2 "From Total Product to the Average and Marginal Product of Labor", draw a graph showing Acme's new total product curve. On a second graph, below the one showing the total product curve you drew, sketch the marginal and average product curves. Remember to plot marginal product at the midpoint between each input level. On both graphs, shade the regions where Acme experiences increasing marginal returns, diminishing marginal returns, and negative marginal returns.
2. Draw the points showing total variable cost at daily outputs of 0, 1, 3, 7, 9, 10, and 11 jackets per day when Acme faced a wage of $100 per day. (Use Figure 8.5 "The Total Variable Cost Curve" as a model). Sketch the total variable cost curve as shown in Figure 8.4 "Computing Variable Costs". Now suppose that the wage rises to $125 per day. On the same graph, show the new points and sketch the new total variable cost curve. Explain what has happened. What will happen to Acme's marginal cost curve? Its average total, average variable, and average fixed cost curves? Explain.