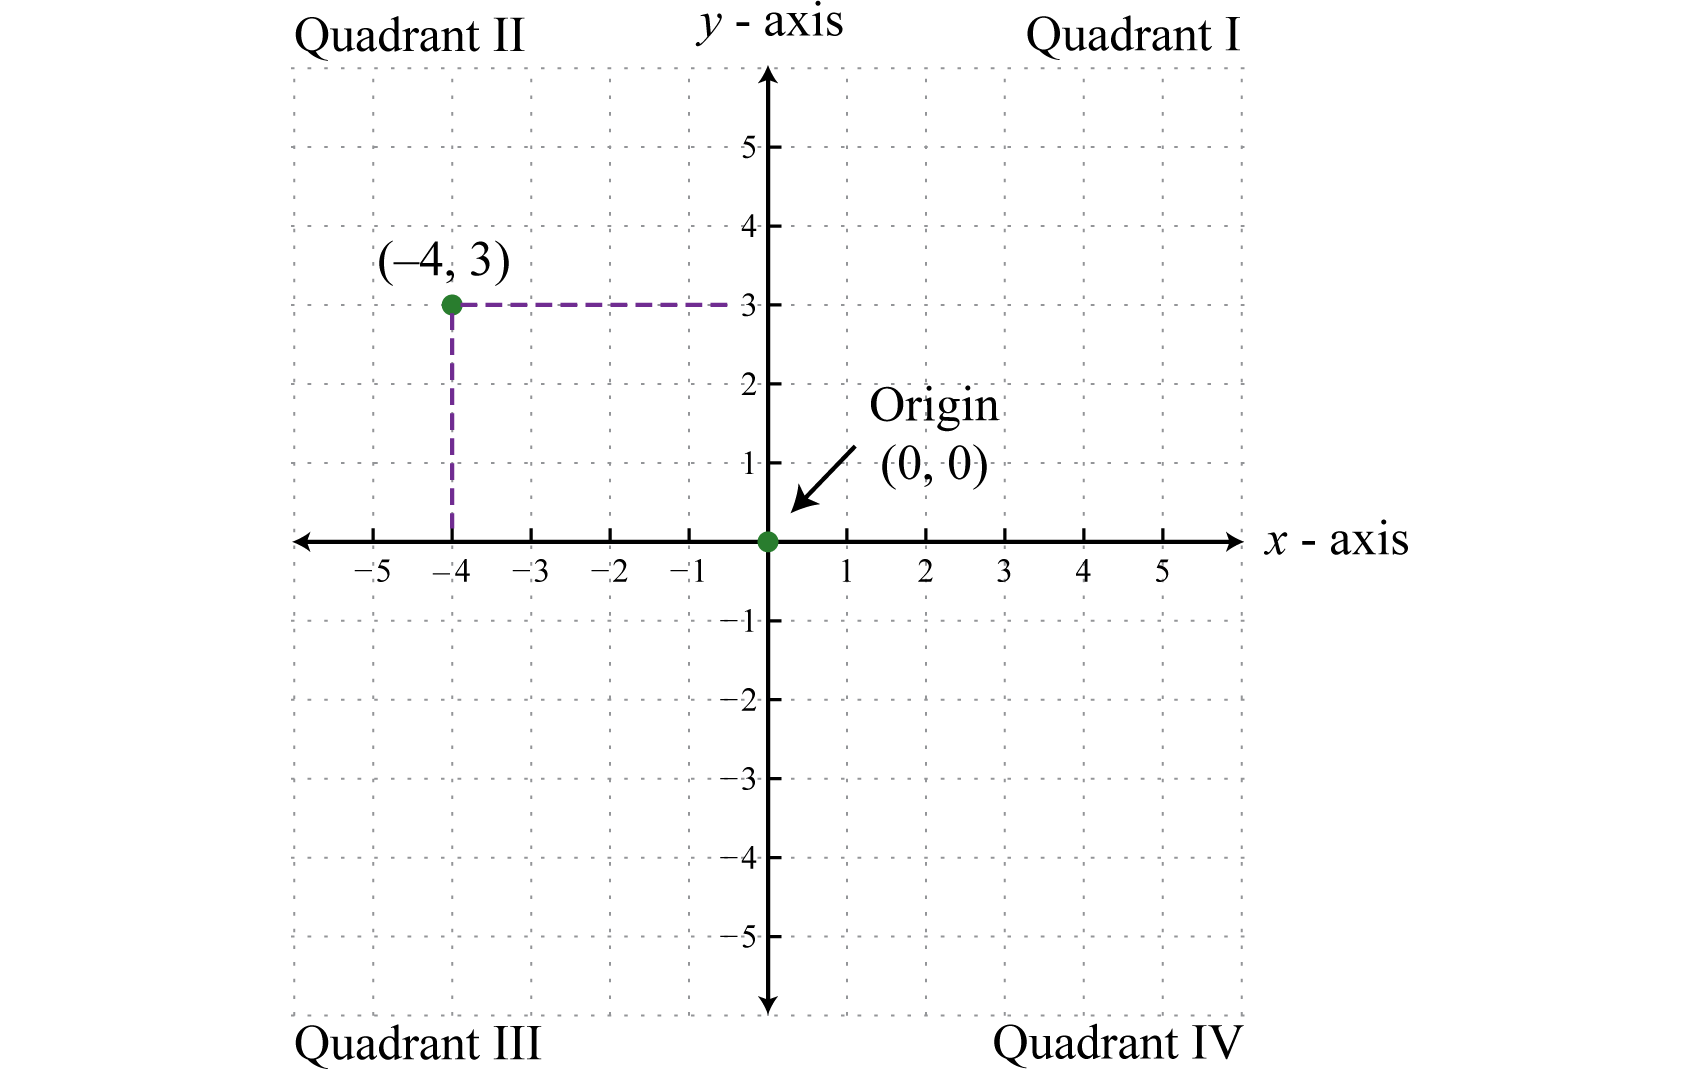
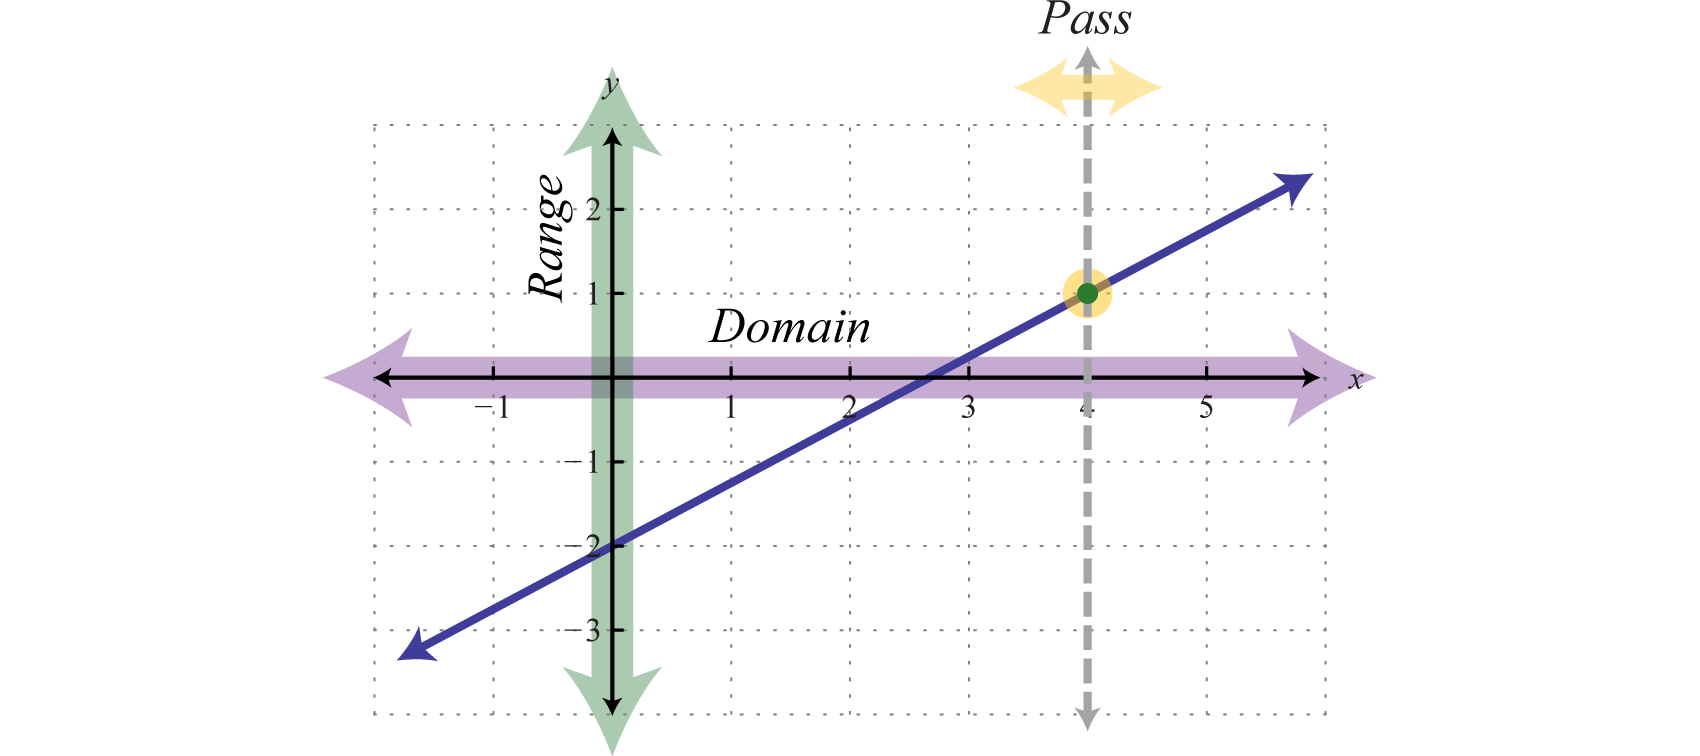
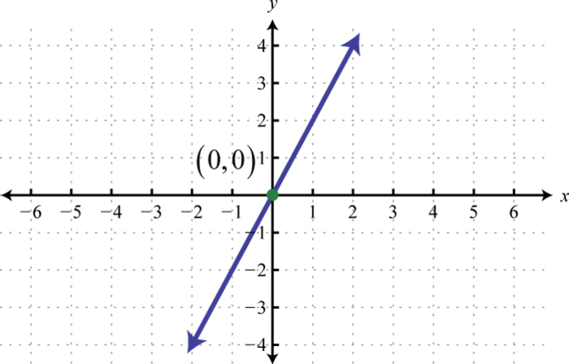
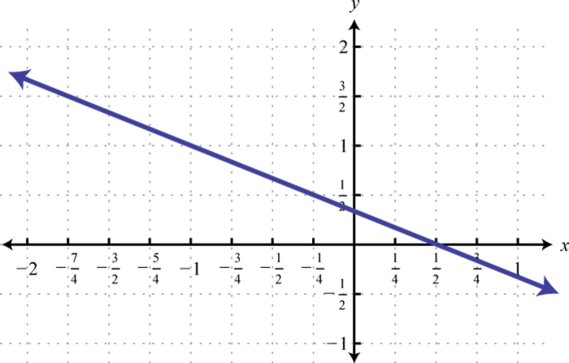
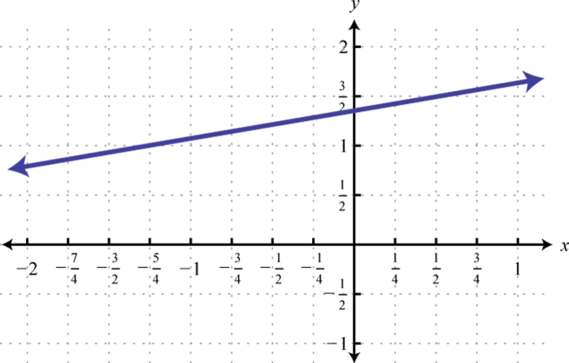
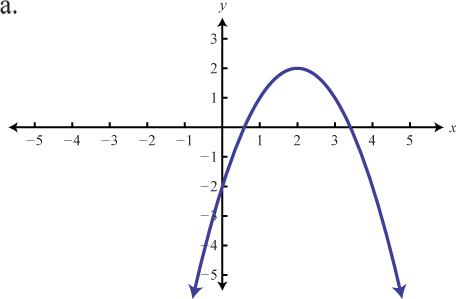
The rectangular coordinate systemA system with two number lines at right angles specifying points in a plane using ordered pairs (x, y). consists of two real number lines that intersect at a right angle. The horizontal number line is called the x-axisThe horizontal number line used as reference in a rectangular coordinate system., and the vertical number line is called the y-axisThe vertical number line used as reference in a rectangular coordinate system.. These two number lines define a flat surface called a planeThe flat surface defined by x- and y-axes., and each point on this plane is associated with an ordered pairPairs (x, y) that identify position relative to the origin on a rectangular coordinate plane. of real numbers (x, y). The first number is called the x-coordinate, and the second number is called the y-coordinate. The intersection of the two axes is known as the originThe point where the x- and y-axes cross, denoted by (0, 0)., which corresponds to the point (0, 0).
The x- and y-axes break the plane into four regions called quadrantsThe four regions of a rectangular coordinate plane partly bounded by the x- and y-axes and numbered using the Roman numerals I, II, III, and IV., named using roman numerals I, II, III, and IV, as pictured. The ordered pair (x, y) represents the position of points relative to the origin. For example, the ordered pair (−4, 3) represents the position 4 units to the left of the origin, and 3 units above in the second quadrant.
This system is often called the Cartesian coordinate systemTerm used in honor of René Descartes when referring to the rectangular coordinate system., named after the French mathematician René Descartes (1596–1650).
Figure 2.1

Rene Descartes Wikipedia
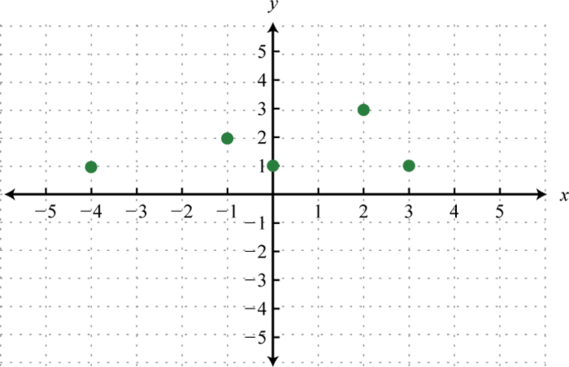
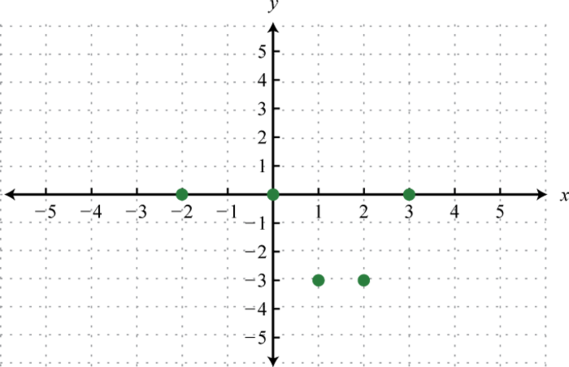
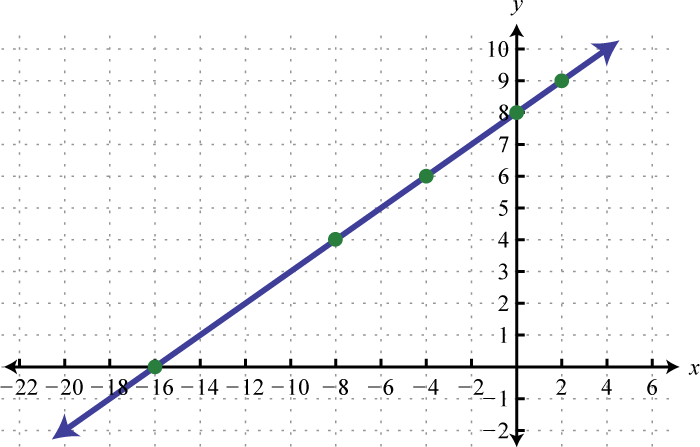
Next, we define a relationAny set of ordered pairs. as any set of ordered pairs. In the context of algebra, the relations of interest are sets of ordered pairs (x, y) in the rectangular coordinate plane. Typically, the coordinates are related by a rule expressed using an algebraic equation. For example, both the algebraic equations and define relationsips between x and y. Following are some integers that satisfy both equations:
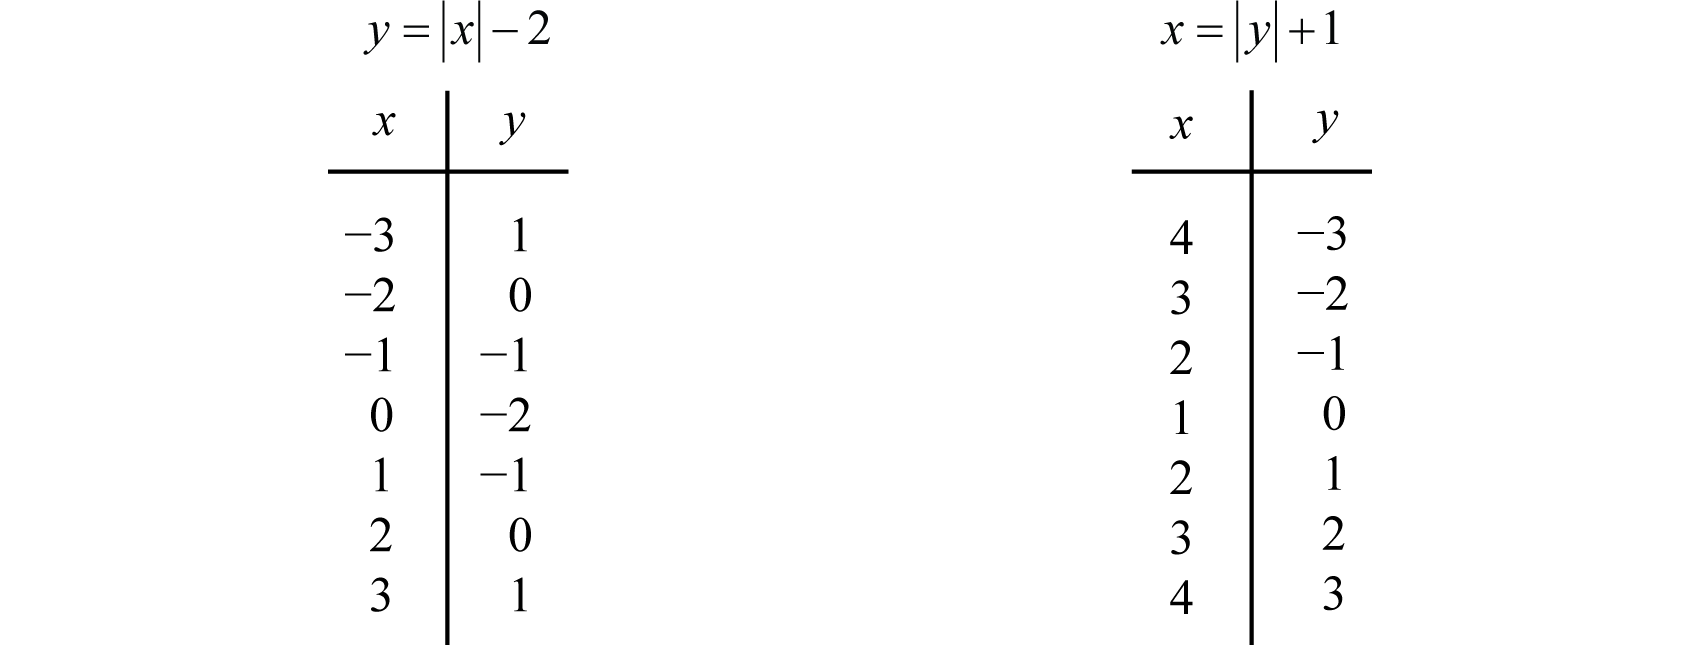
Here two relations consisting of seven ordered pair solutions are obtained:
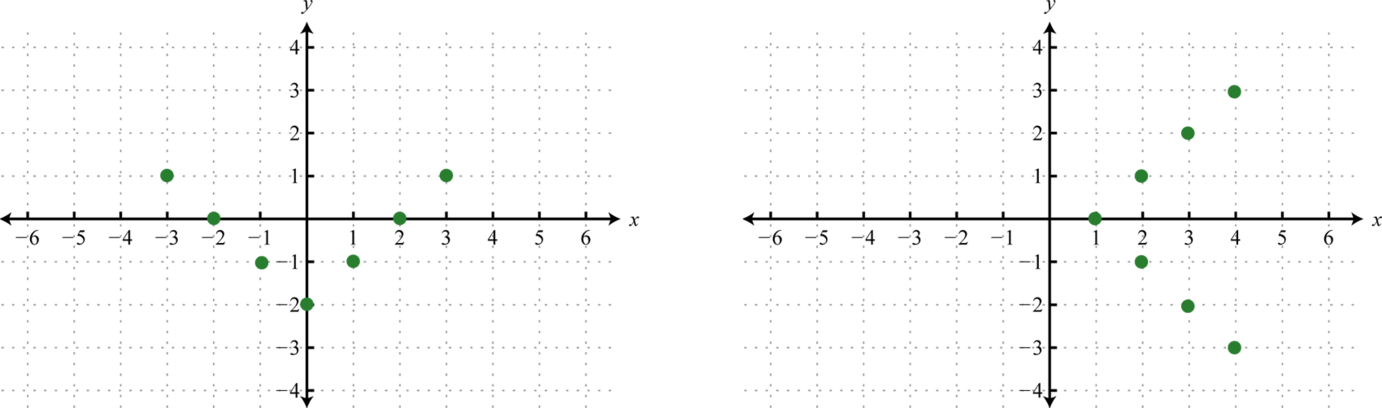
We can visually display any relation of this type on a coordinate plane by plotting the points.
The solution sets of each equation will form a relation consisting of infinitely many ordered pairs. We can use the given ordered pair solutions to estimate all of the other ordered pairs by drawing a line through the given points. Here we put an arrow on the ends of our lines to indicate that this set of ordered pairs continues without bounds.
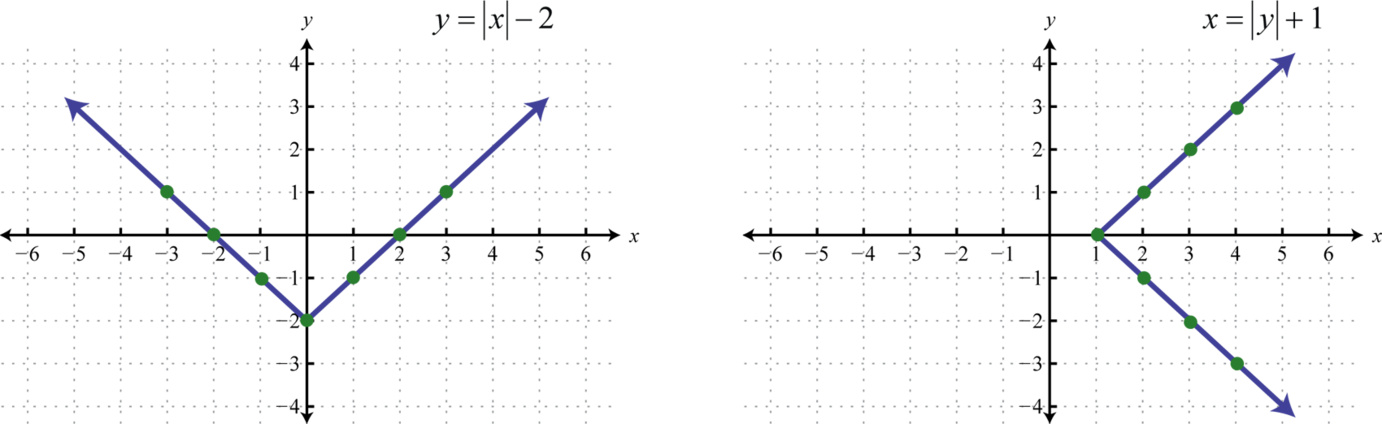
The representation of a relation on a rectangular coordinate plane, as illustrated above, is called a graphA visual representation of a relation on a rectangular coordinate plane.. Any curve graphed on a rectangular coordinate plane represents a set of ordered pairs and thus defines a relation.
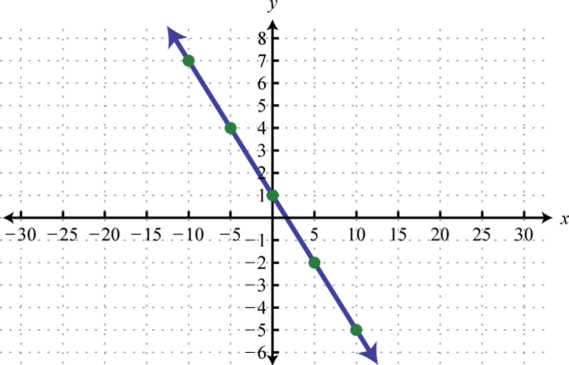
The set consisting of all of the first components of a relation, in this case the x-values, is called the domainThe set consisting of all of the first components of a relation. For relations consisting of points in the plane, the domain is the set of all x-values.. And the set consisting of all second components of a relation, in this case the y-values, is called the rangeThe set consisting of all of the second components of a relation. For relations consisting of points in the plane, the range is the set of all y-values. (or codomainUsed when referencing the range.). Often, we can determine the domain and range of a relation if we are given its graph.

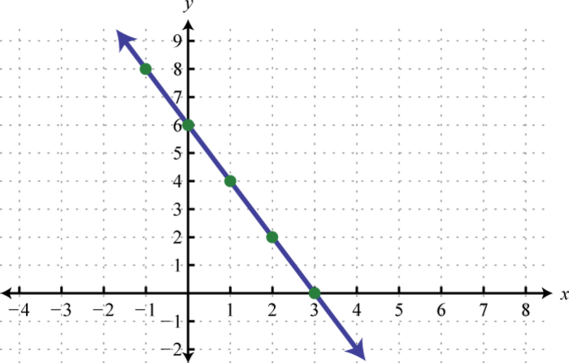
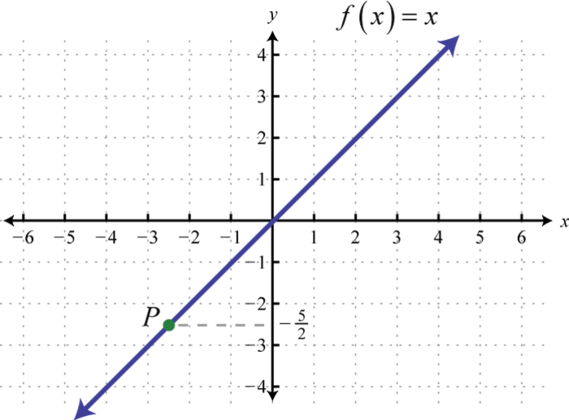
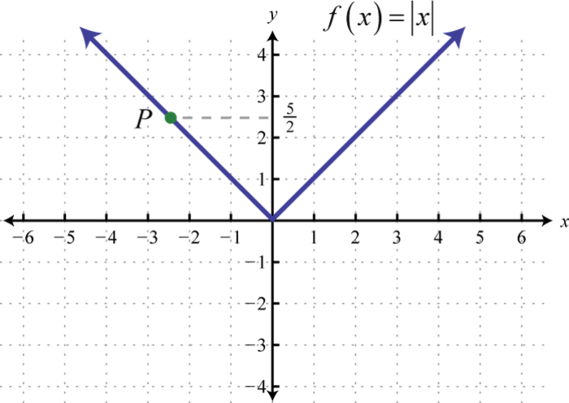
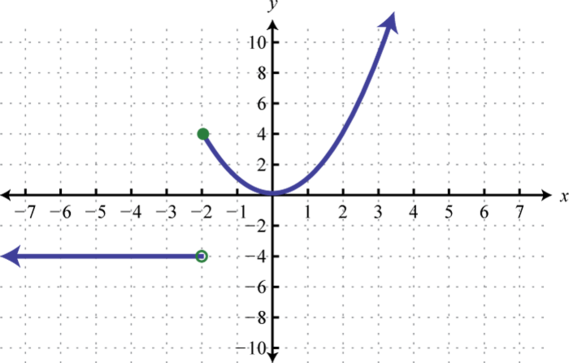
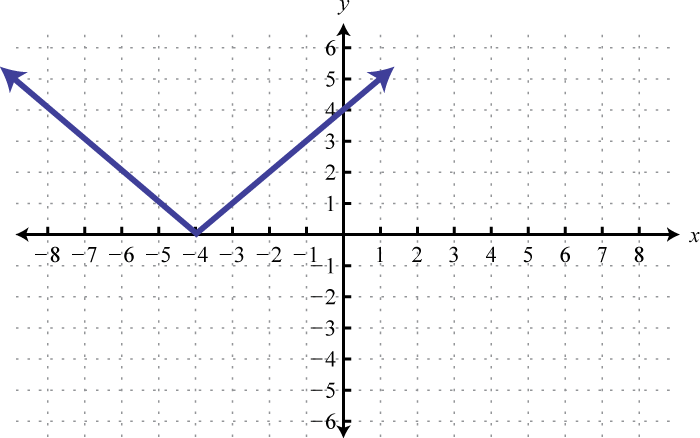
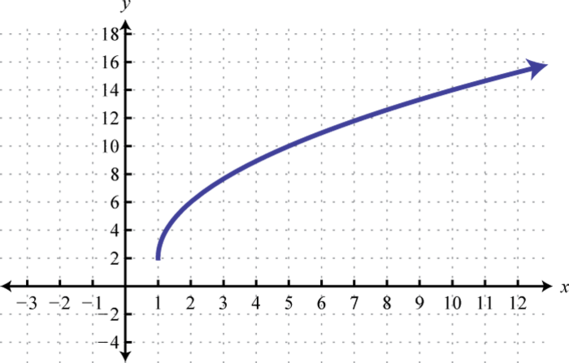
Here we can see that the graph of has a domain consisting of all real numbers, , and a range of all y-values greater than or equal to −2, The domain of the graph of consists of all x-values greater than or equal to 1, , and the range consists of all real numbers,
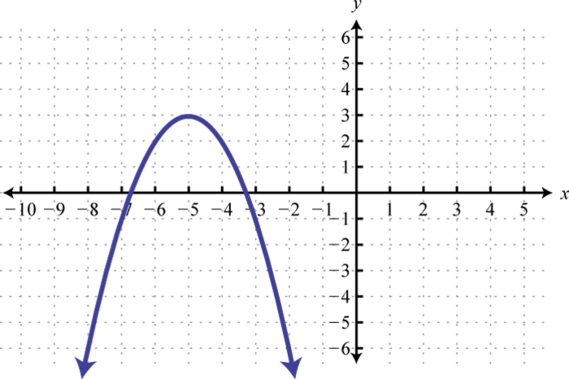
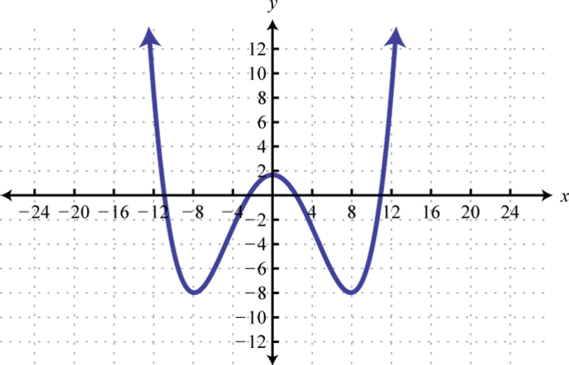
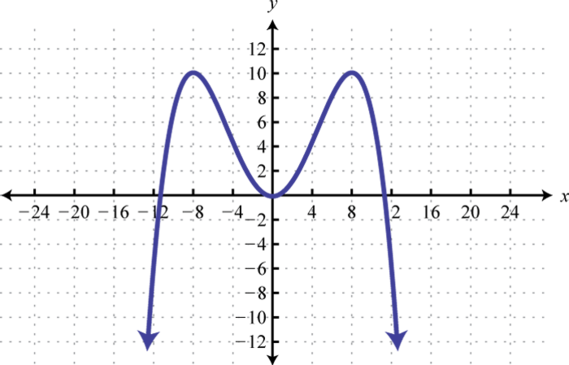
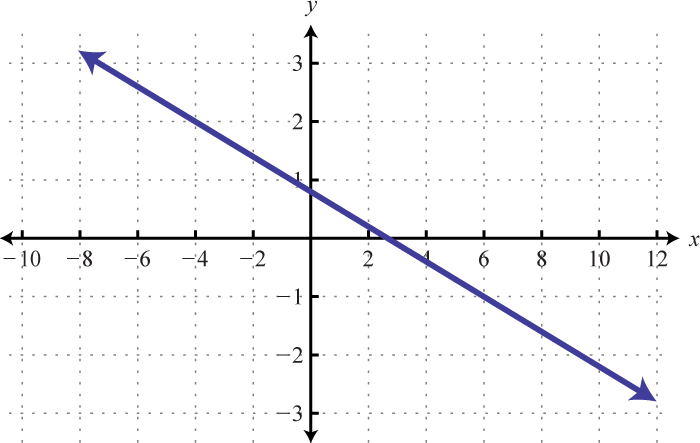
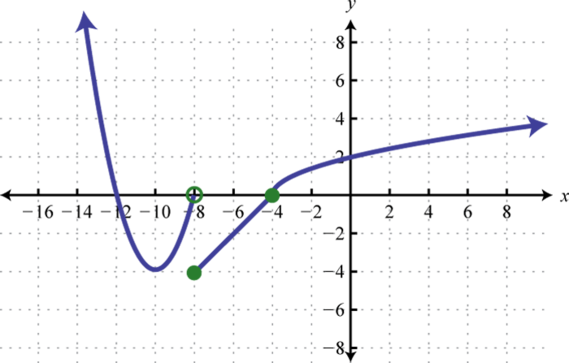
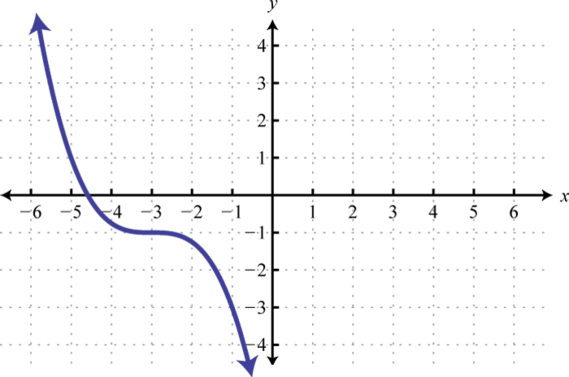
Determine the domain and range of the following relation:
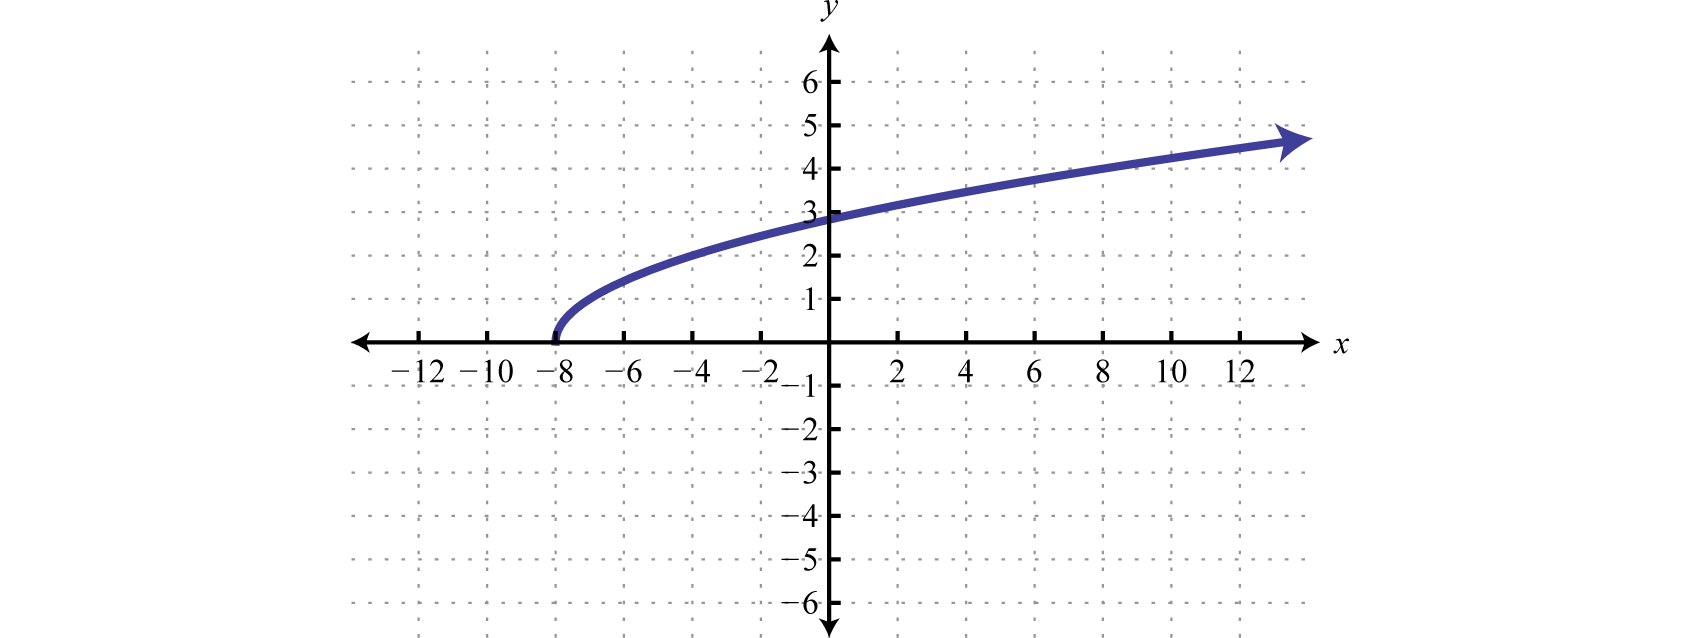
Solution:
The minimum x-value represented on the graph is −8 all others are larger. Therefore, the domain consists of all x-values in the interval The minimum y-value represented on the graph is 0; thus, the range is
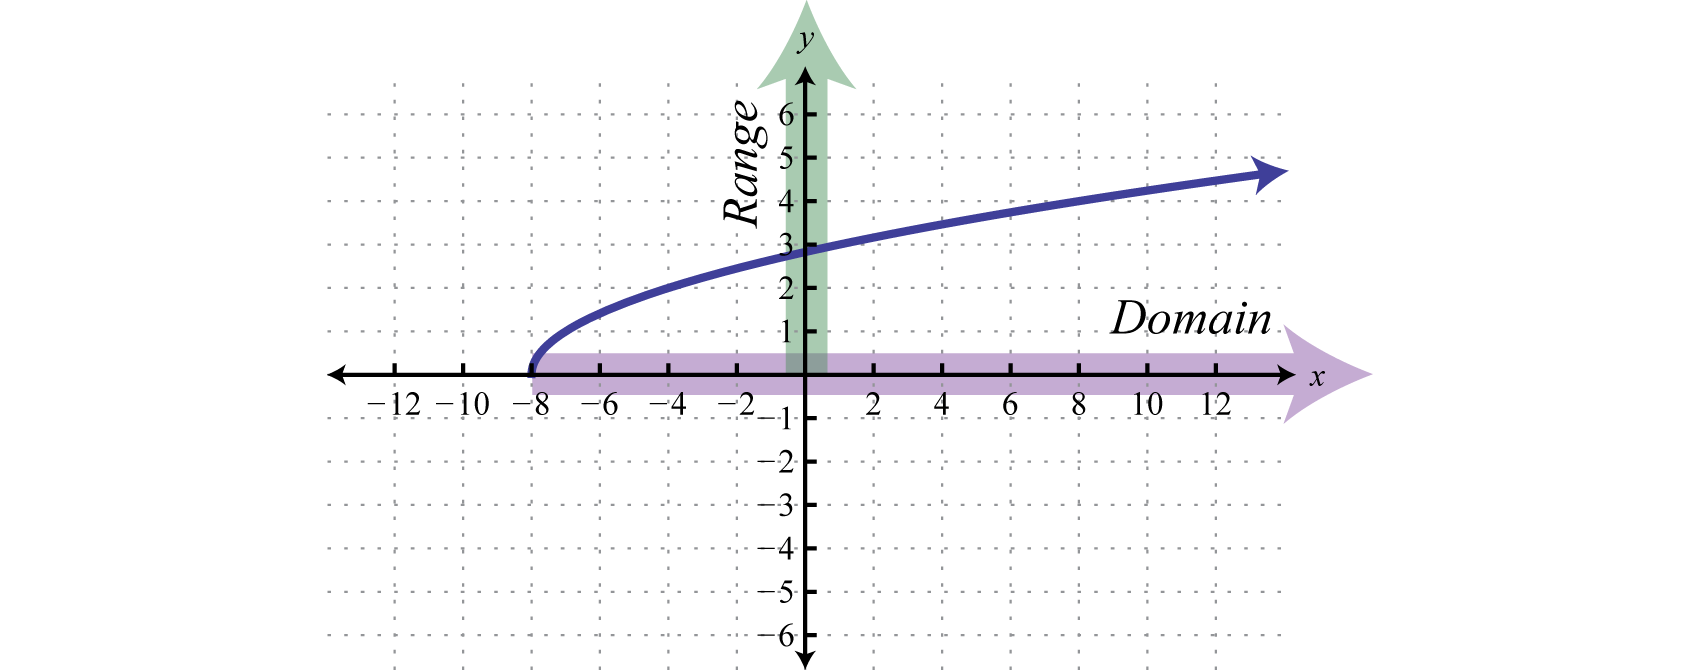
Answer: Domain: ; range:
Of special interest are relations where every x-value corresponds to exactly one y-value. A relation with this property is called a functionA relation where each element in the domain corresponds to exactly one element in the range..
Determine the domain and range of the following relation and state whether it is a function or not: {(−1, 4), (0, 7), (2, 3), (3, 3), (4, −2)}
Solution:
Here we separate the domain (x-values), and the range (y-values), and depict the correspondence between the values with arrows.

The relation is a function because each x-value corresponds to exactly one y-value.
Answer: The domain is {−1, 0, 2, 3, 4} and the range is {−2, 3, 4, 7}. The relation is a function.
Determine the domain and range of the following relation and state whether it is a function or not: {(−4, −3), (−2, 6), (0, 3), (3, 5), (3, 7)}
Solution:

The given relation is not a function because the x-value 3 corresponds to two y-values. We can also recognize functions as relations where no x-values are repeated.
Answer: The domain is {−4, −2, 0, 3} and the range is {−3, 3, 5, 6, 7}. This relation is not a function.
Consider the relations consisting of the seven ordered pair solutions to and The correspondence between the domain and range of each can be pictured as follows:
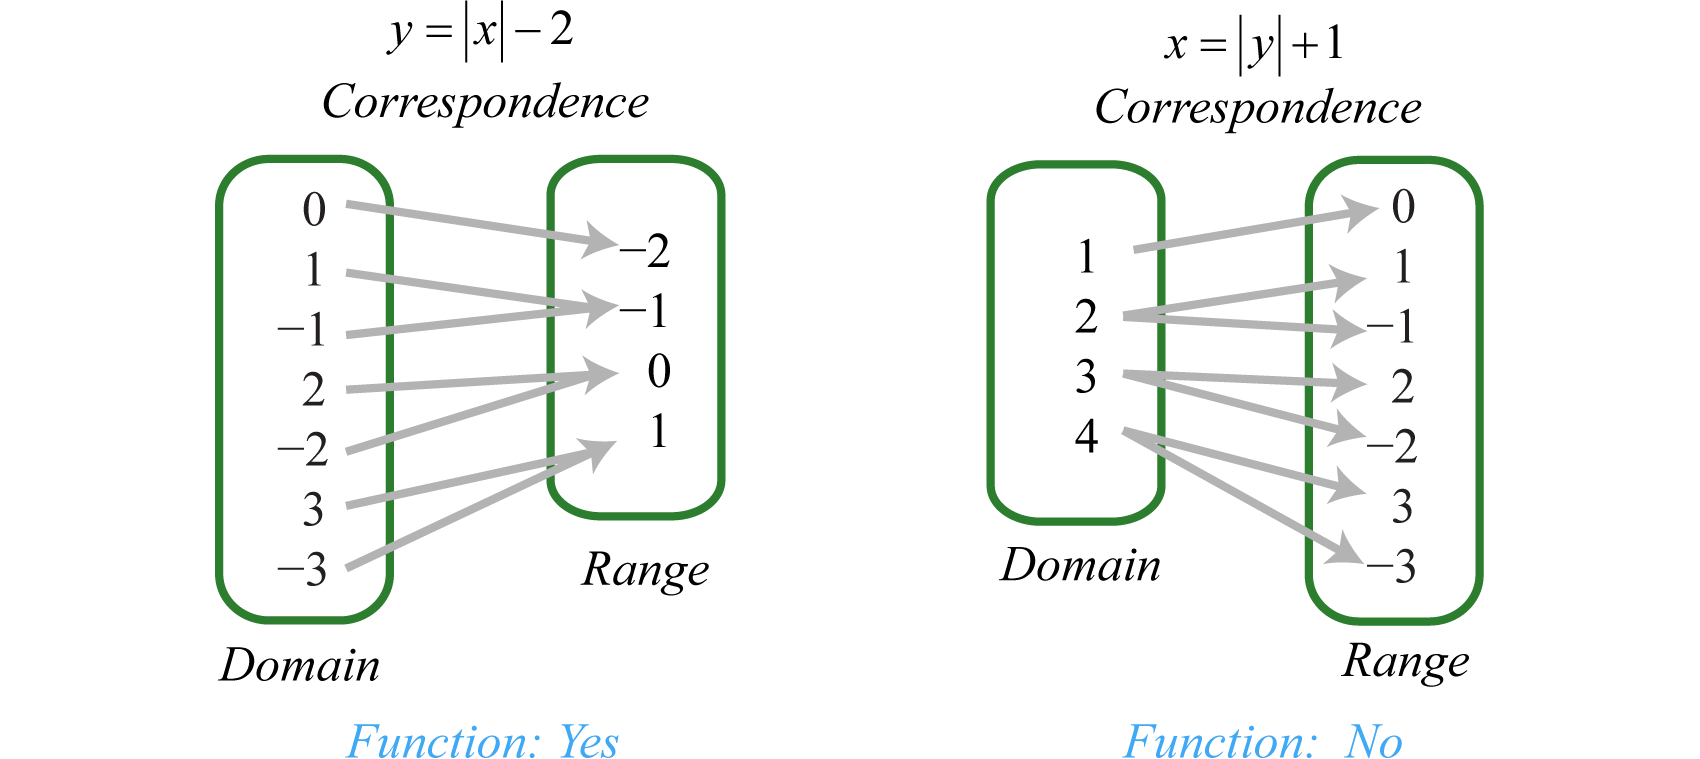
Notice that every element in the domain of the solution set of corresponds to only one element in the range; it is a function. The solutions to , on the other hand, have values in the domain that correspond to two elements in the range. In particular, the x-value 4 corresponds to two y-values −3 and 3. Therefore, does not define a function.
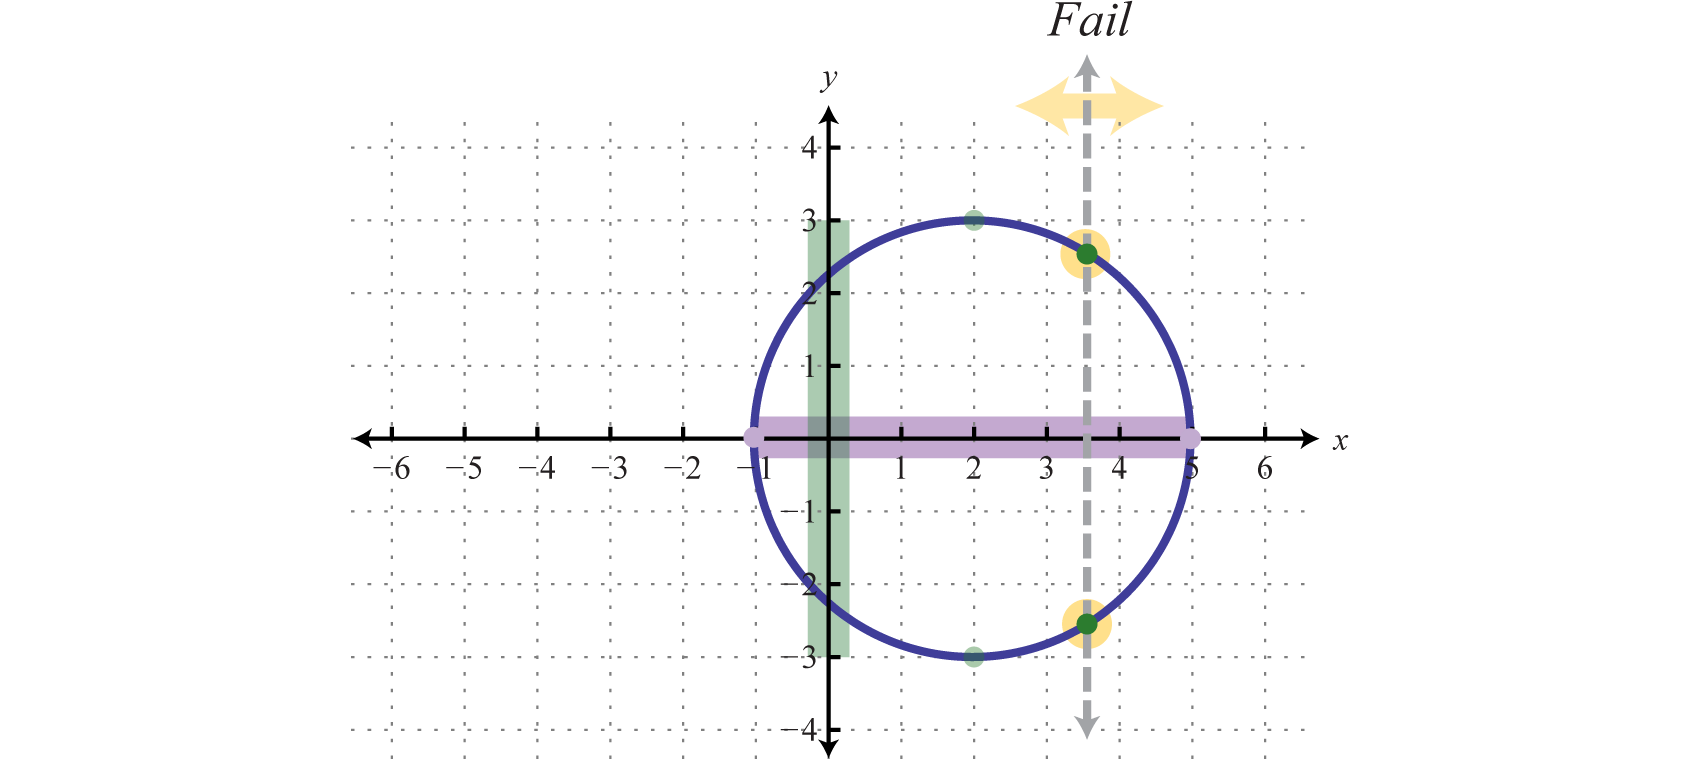
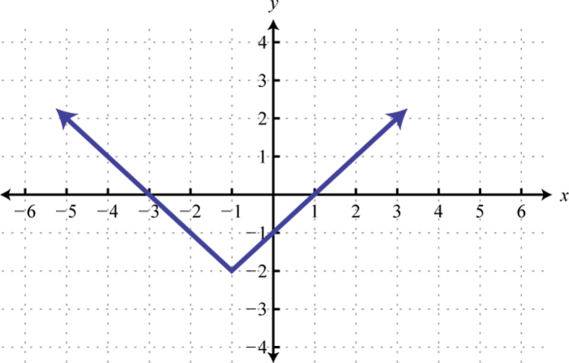
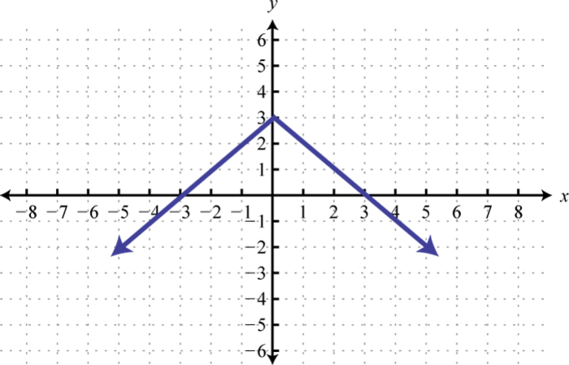
We can visually identify functions by their graphs using the vertical line testIf any vertical line intersects the graph more than once, then the graph does not represent a function.. If any vertical line intersects the graph more than once, then the graph does not represent a function.
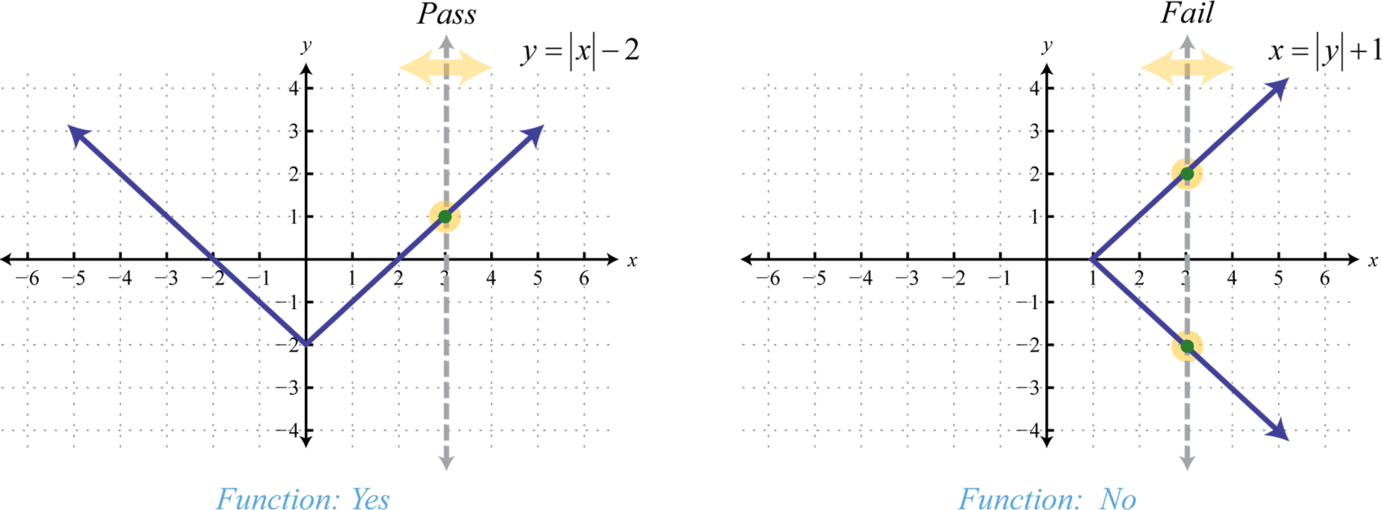
The vertical line represents a value in the domain, and the number of intersections with the graph represent the number of values to which it corresponds. As we can see, any vertical line will intersect the graph of only once; therefore, it is a function. A vertical line can cross the graph of more than once; therefore, it is not a function. As pictured, the x-value 3 corresponds to more than one y-value.
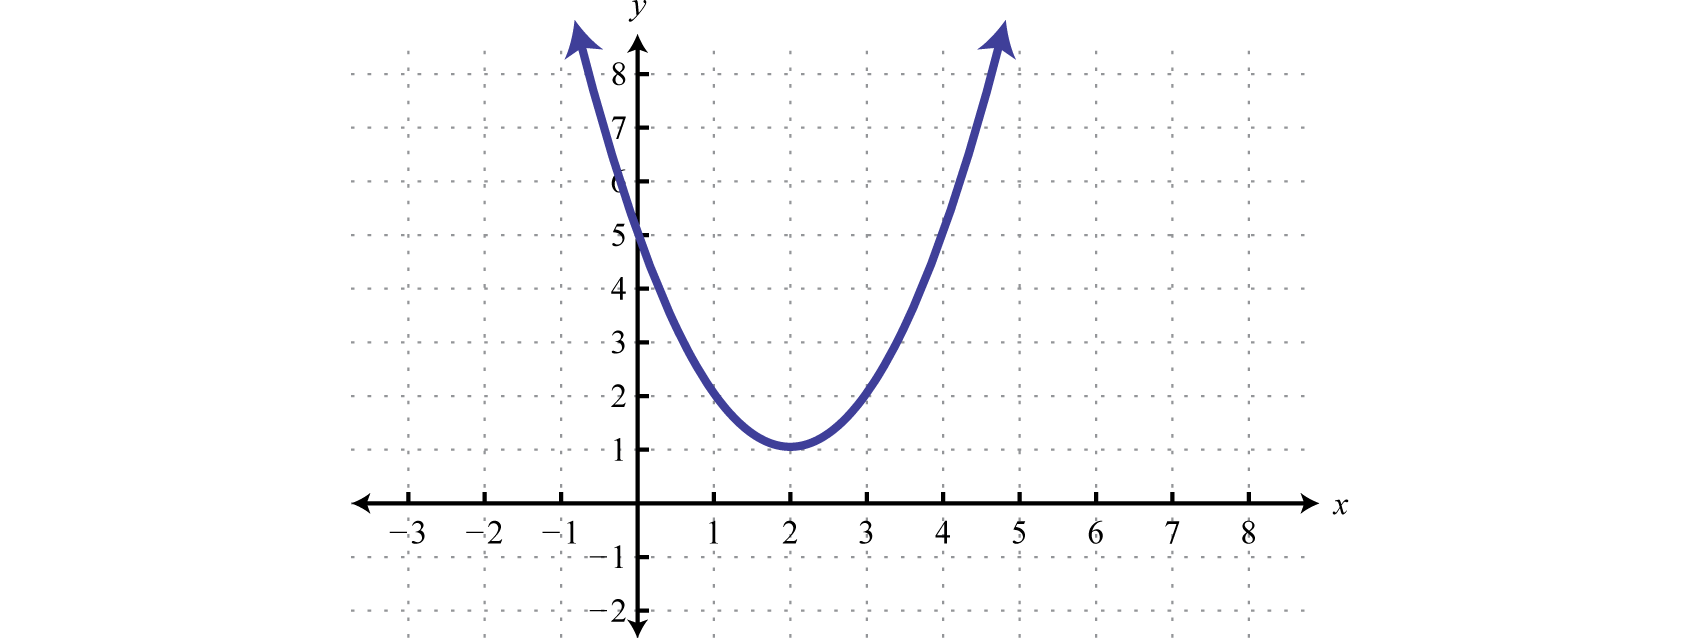
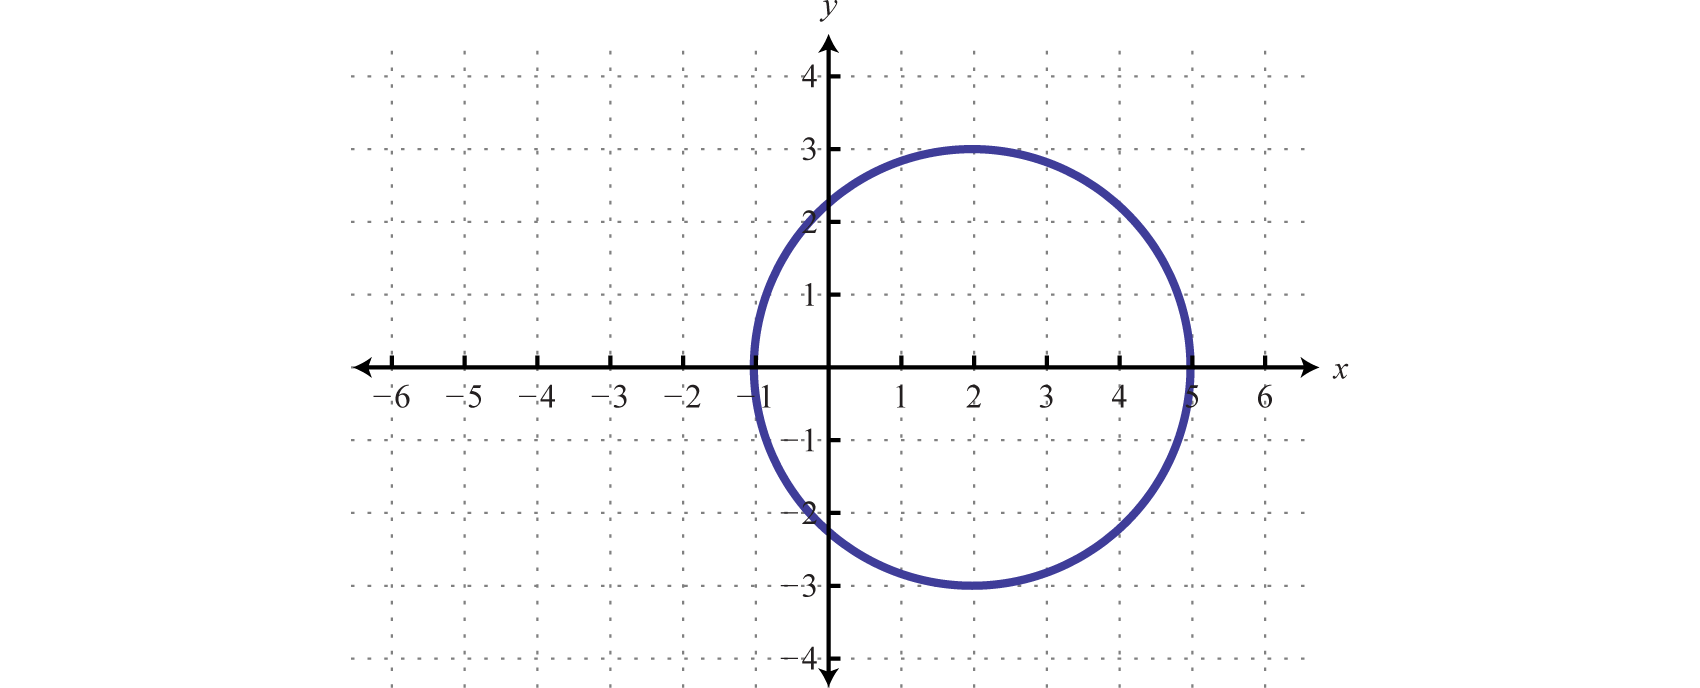
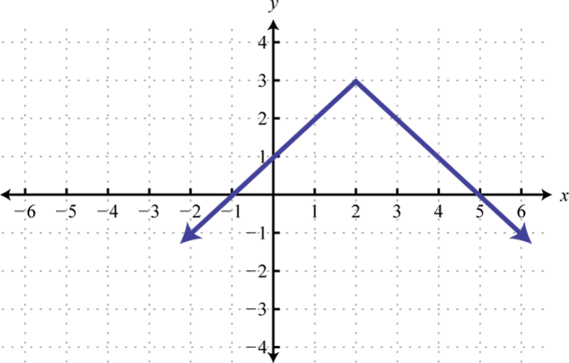
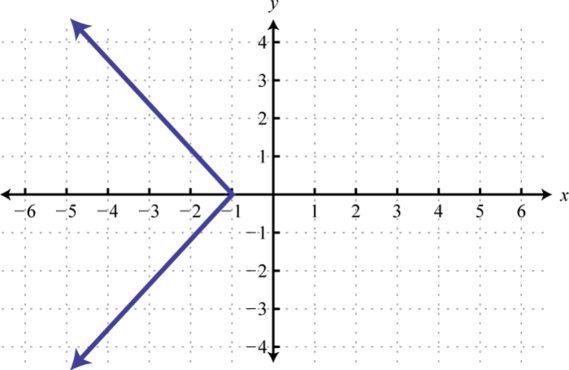
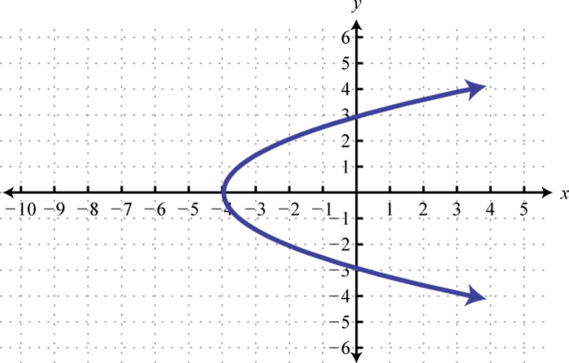
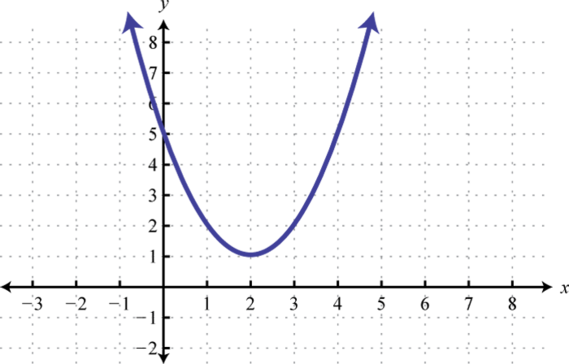
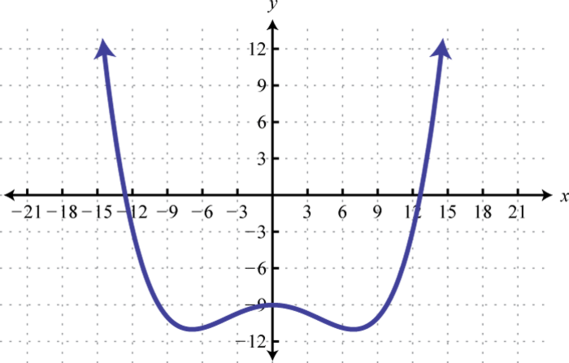
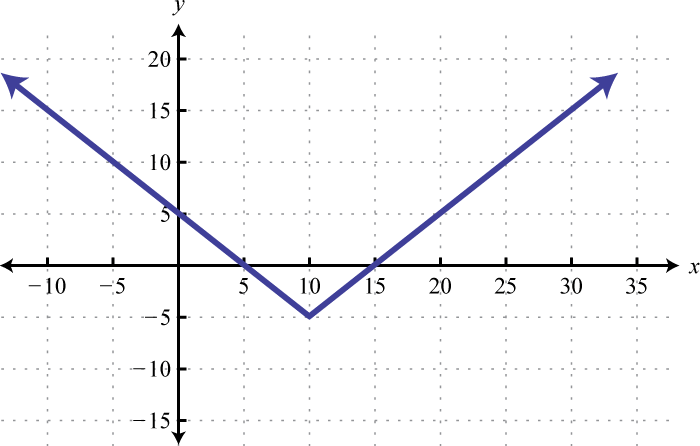
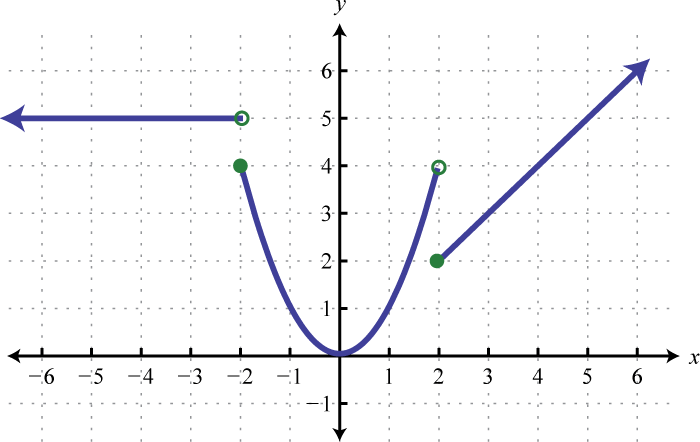
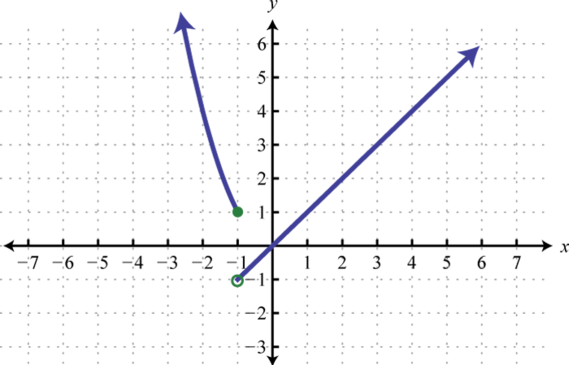
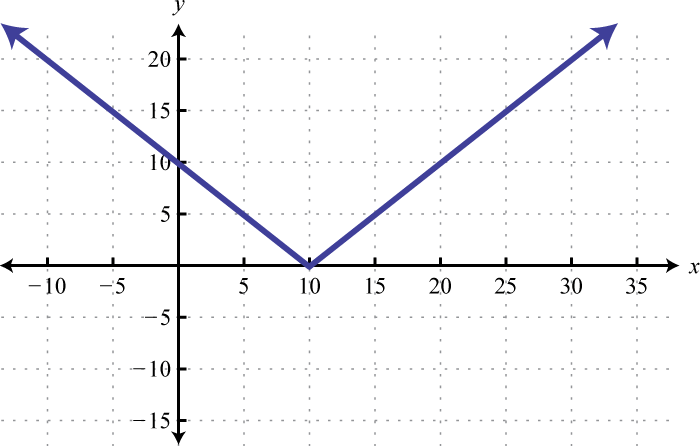
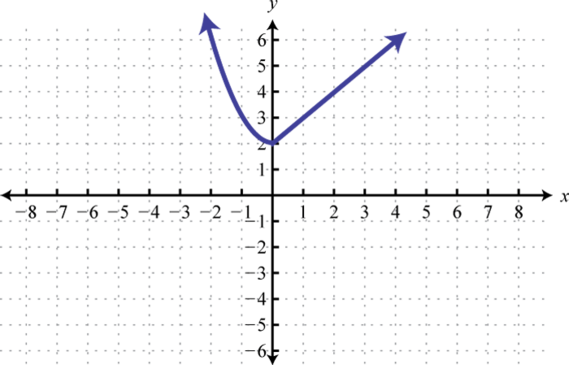
Given the graph, state the domain and range and determine whether or not it represents a function:
Solution:
From the graph we can see that the minimum x-value is −1 and the maximum x-value is 5. Hence, the domain consists of all the real numbers in the set from The maximum y-value is 3 and the minimum is −3; hence, the range consists of y-values in the interval
In addition, since we can find a vertical line that intersects the graph more than once, we conclude that the graph is not a function. There are many x-values in the domain that correspond to two y-values.
Answer: Domain: ; range: ; function: no
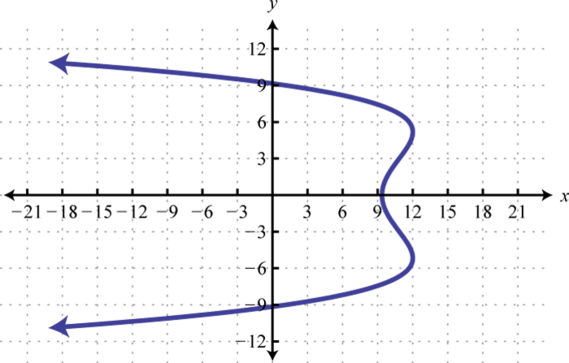
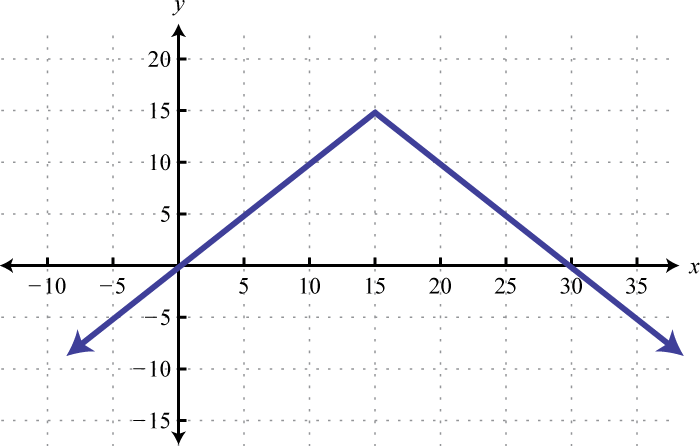
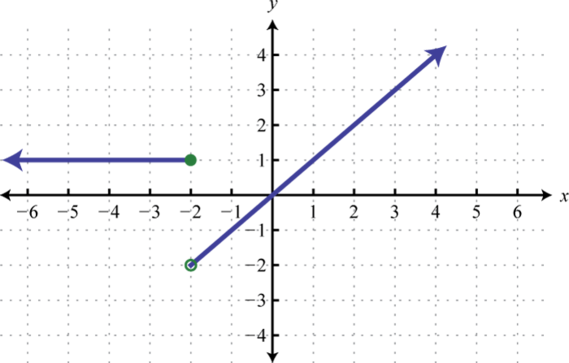
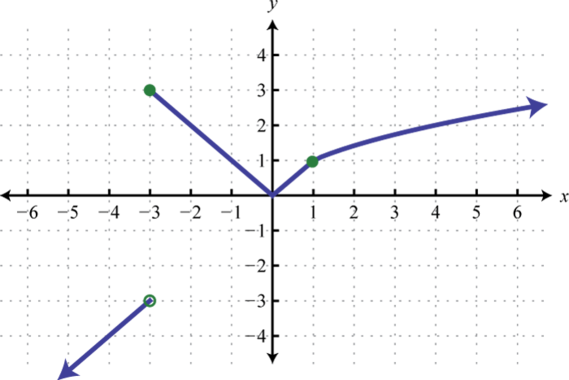
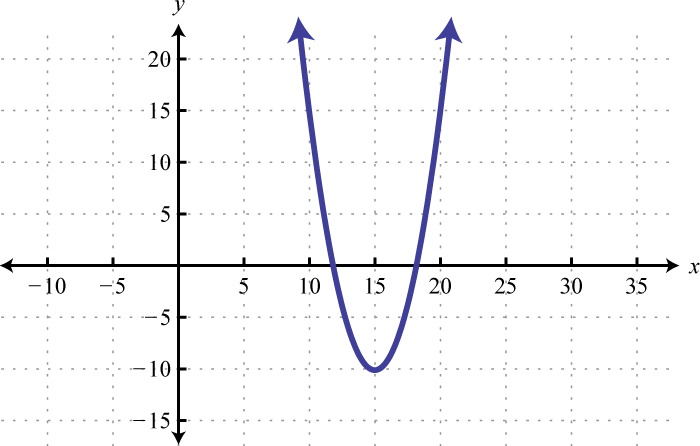
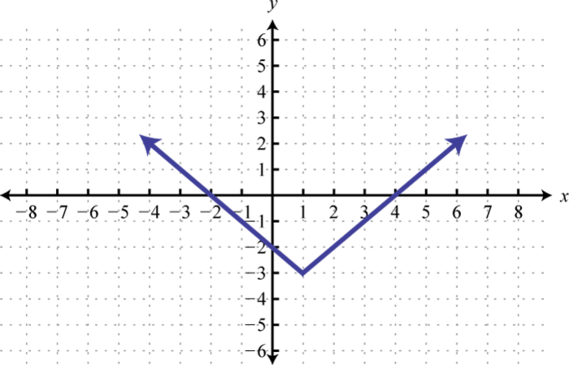
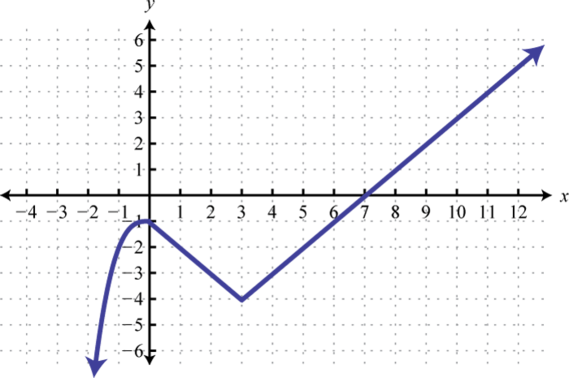
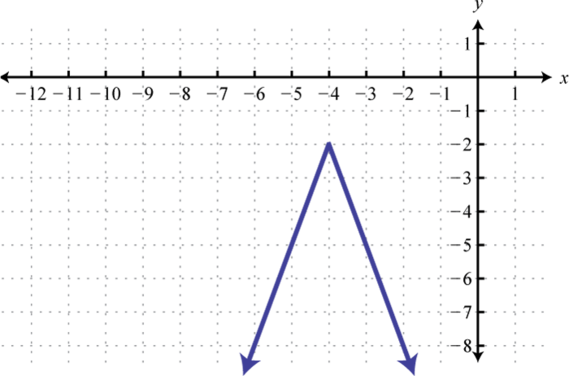
Try this! Given the graph, determine the domain and range and state whether or not it is a function:
Answer: Domain: ; range:; function: no
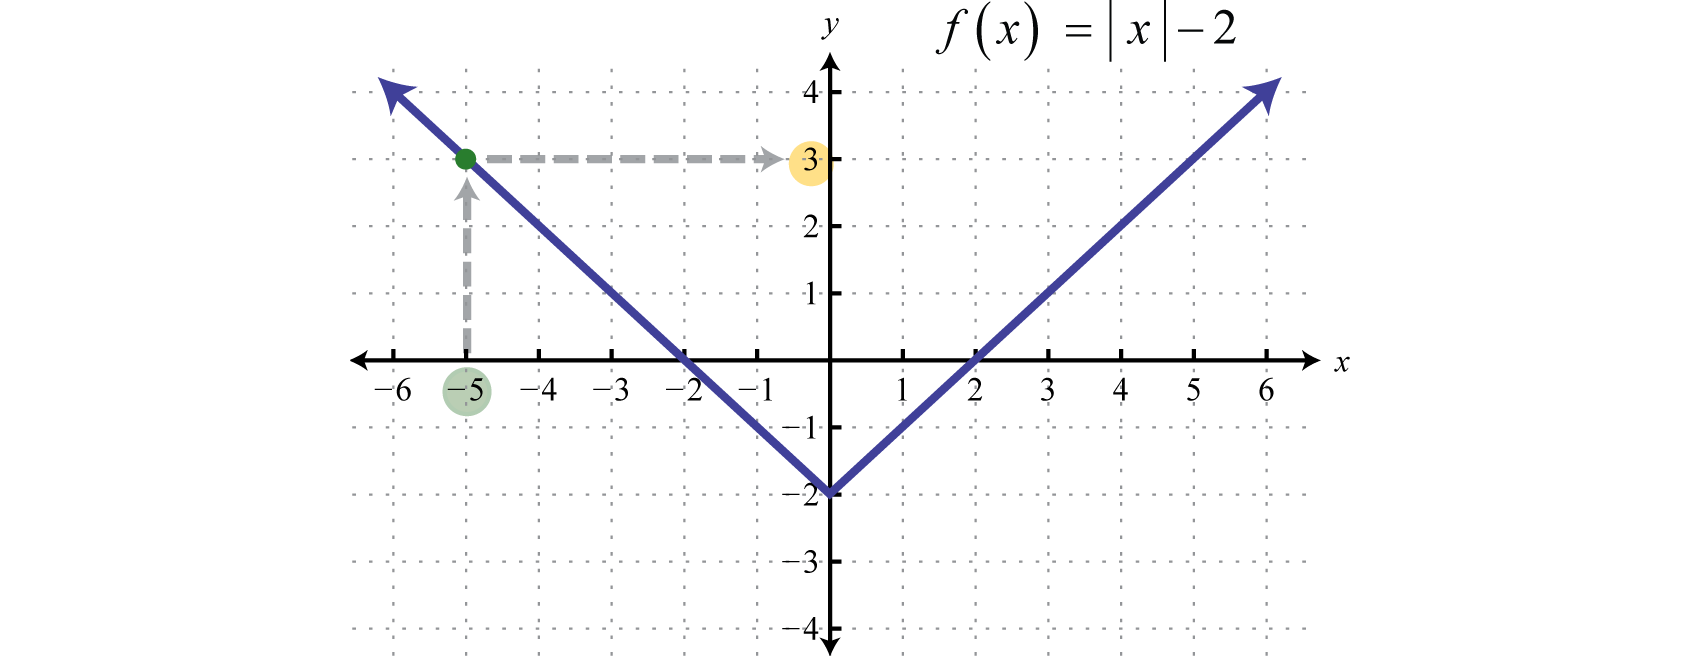
With the definition of a function comes special notation. If we consider each x-value to be the input that produces exactly one output, then we can use function notationThe notation , which reads “f of x is equal to y.” Given a function, y and can be used interchangeably.:
The notation reads, “f of x” and should not be confused with multiplication. Algebra frequently involves functions, and so the notation becomes useful when performing common tasks. Here f is the function name, and denotes the value in the range associated with the value x in the domain. Functions are often named with different letters; some common names for functions are f, g, h, C, and R. We have determined that the set of solutions to is a function; therefore, using function notation we can write:
It is important to note that y and are used interchangeably. This notation is used as follows:
Here the compact notation indicates that where (the input), the function results in (the output). In other words, replace the variable with the value given inside the parentheses.

Functions are compactly defined by an algebraic equation, such as Given values for x in the domain, we can quickly calculate the corresponding values in the range. As we have seen, functions are also expressed using graphs. In this case, we interpret as follows:
Function notation streamlines the task of evaluating. For example, use the function h defined by to evaluate for x-values in the set {−2, 0, 7}.
Given any function defined by , the value x is called the argument of the functionThe value or algebraic expression used as input when using function notation.. The argument can be any algebraic expression. For example:
Given , find , , and
Solution:
Recall that when evaluating, it is a best practice to begin by replacing the variables with parentheses and then substitute the appropriate values. This helps with the order of operations when simplifying expressions.
Answer: , ,
At this point, it is important to note that, in general, The previous example, where , illustrates this nicely.
Given , find , , and
Solution:
Answer: , ,
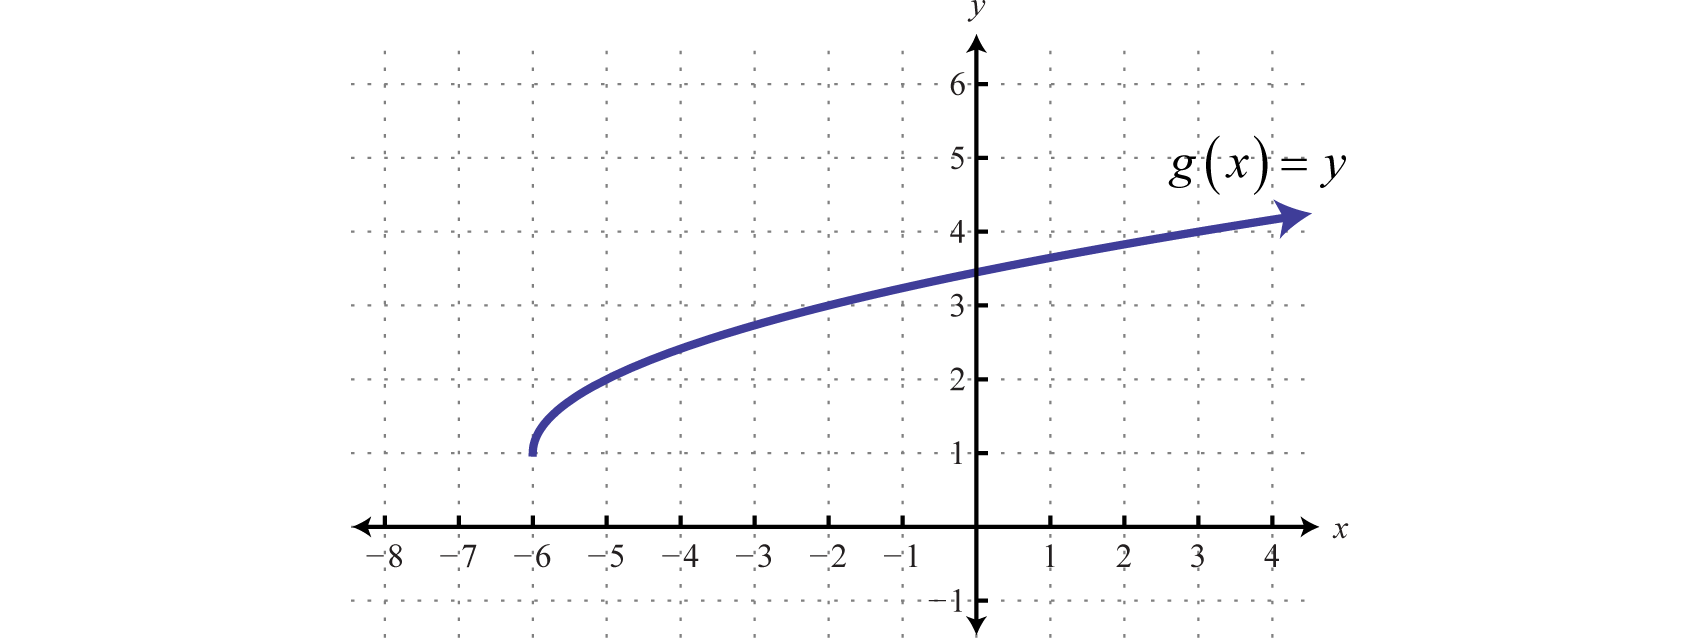
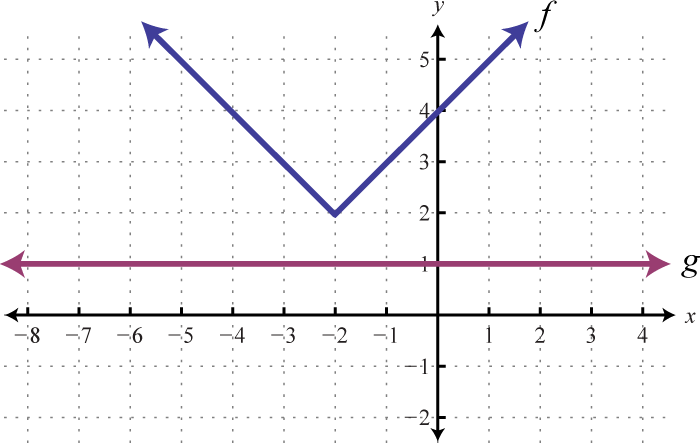
Given the graph of , find , , and
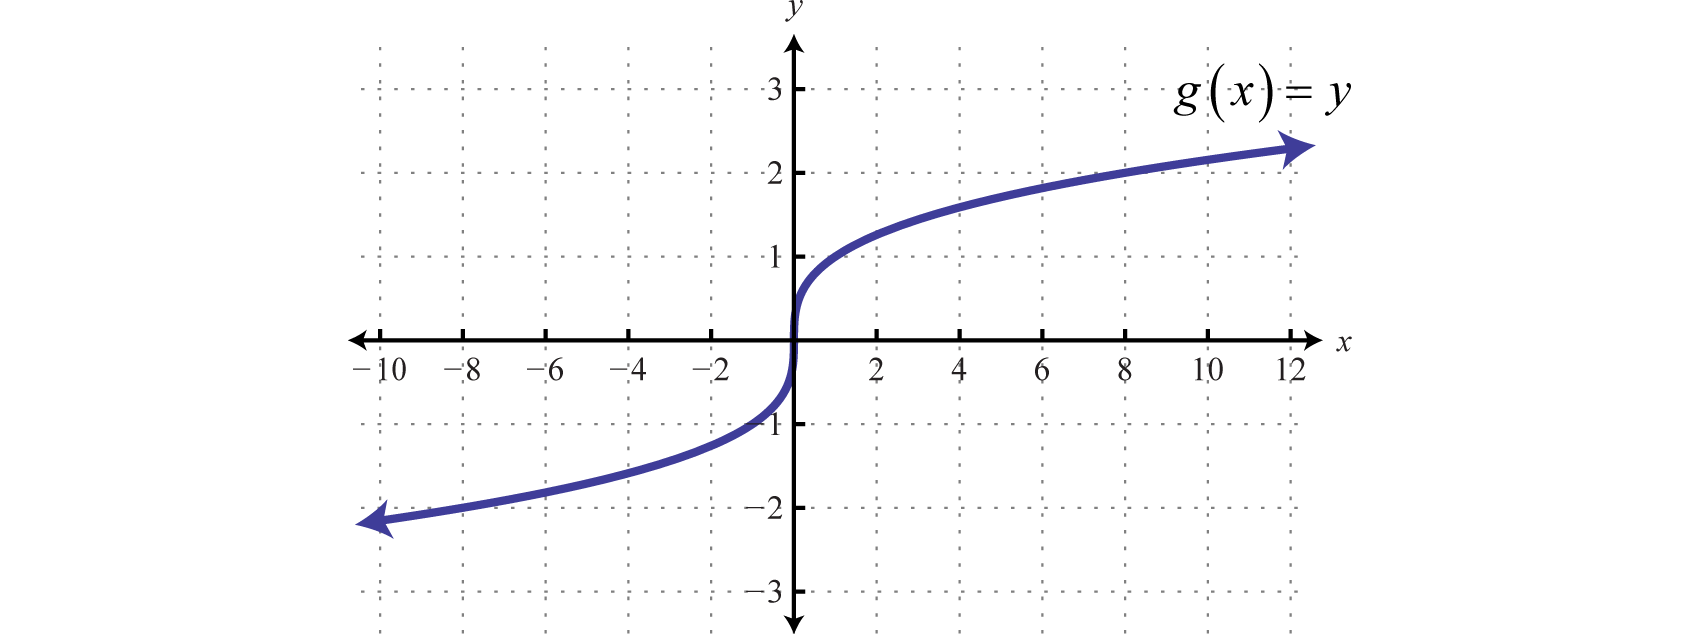
Solution:
Use the graph to find the corresponding y-values where x = −8, 0, and 8.
Answer: , ,
Sometimes the output is given and we are asked to find the input.
Given , find x where
Solution:
In this example, the output is given and we are asked to find the input. Substitute with 27 and solve.
Therefore, As a check, we can evaluate
Answer:
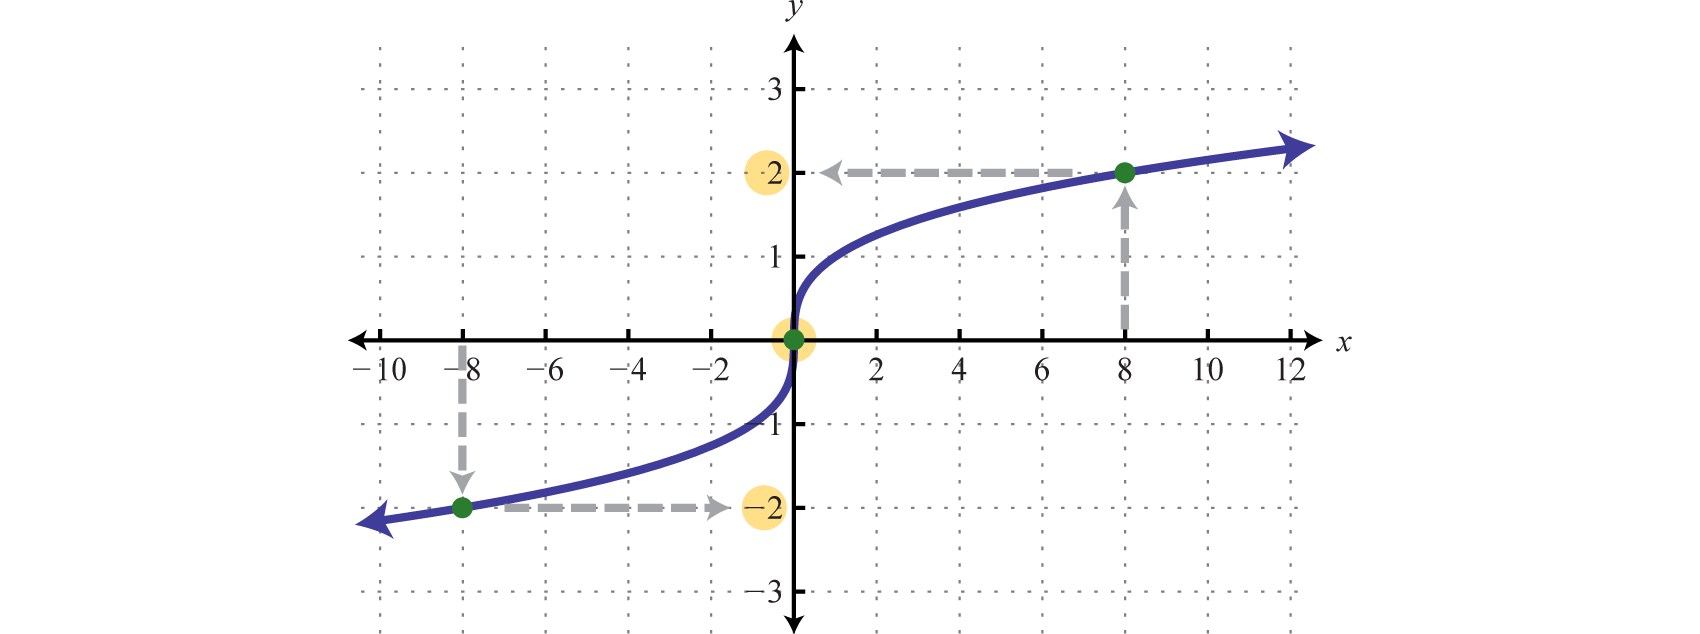
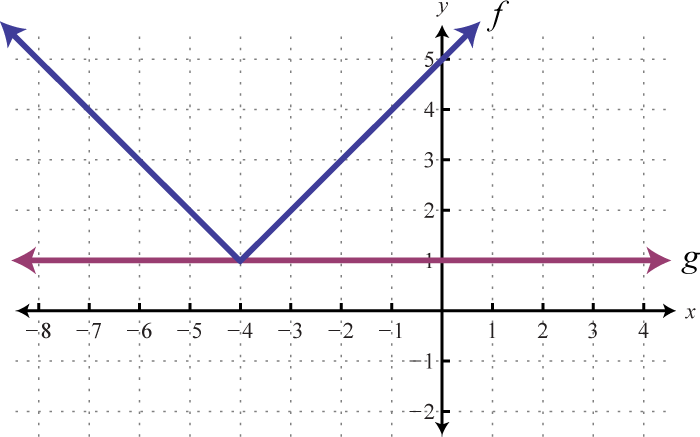
Given the graph of , find x where
Solution:
Here we are asked to find the x-value given a particular y-value. We begin with 2 on the y-axis and then read the corresponding x-value.
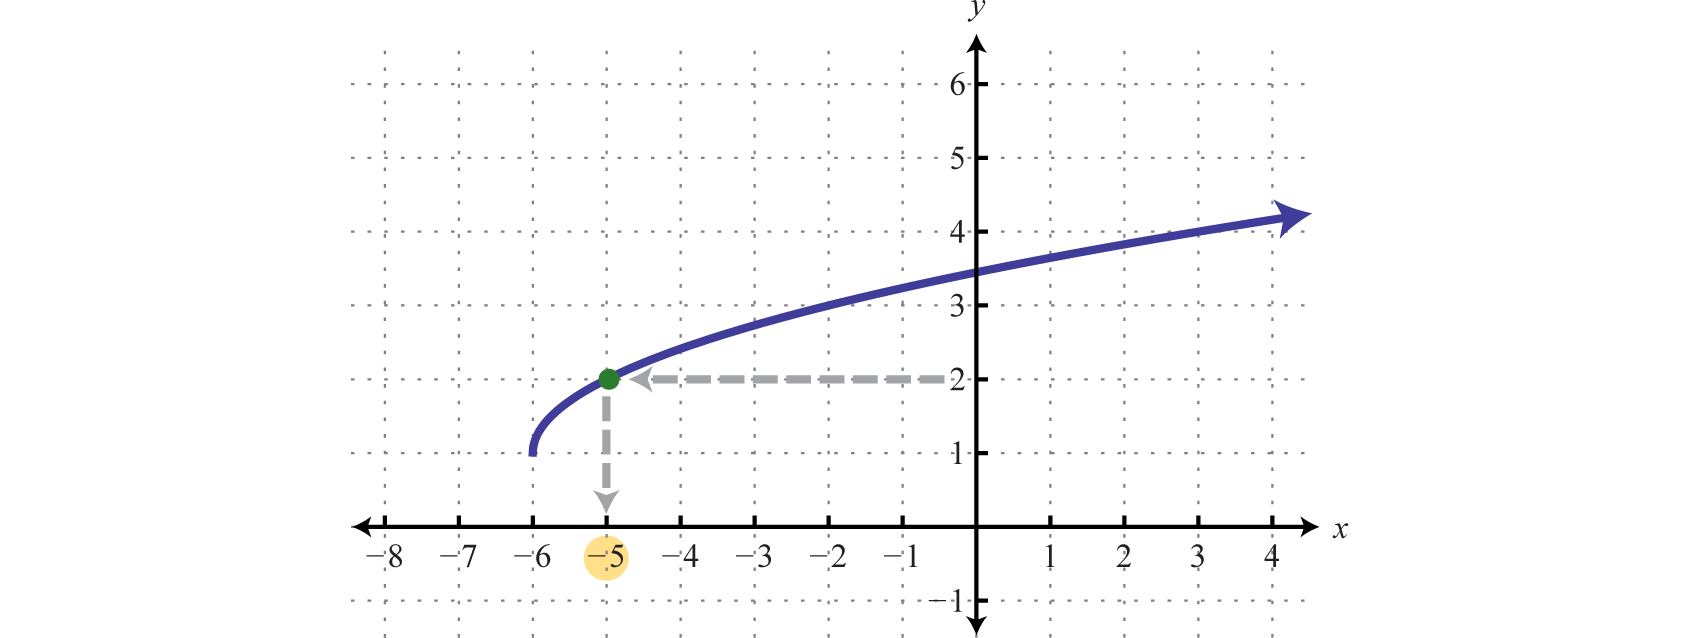
We can see that where ; in other words,
Answer:
Determine the domain and range and state whether the relation is a function or not.
{(3, 1), (5, 2), (7, 3), (9, 4), (12, 4)}
{(2, 0), (4, 3), (6, 6), (8, 6), (10, 9)}
{(7, 5), (8, 6), (10, 7), (10, 8), (15, 9)}
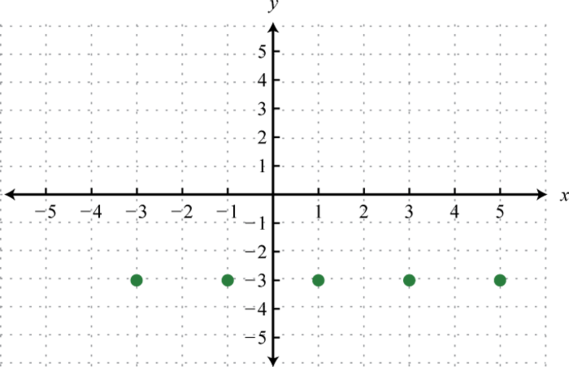
{(1, 1), (2, 1), (3, 1), (4, 1), (5, 1)}
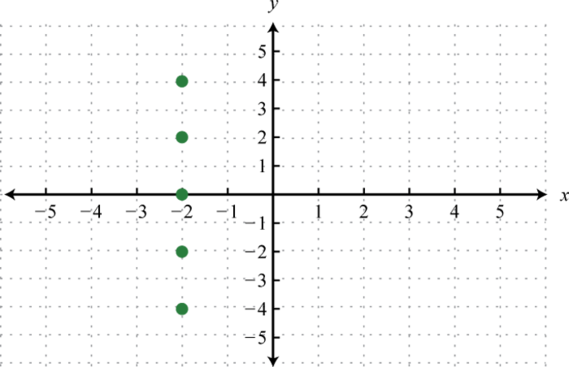
{(5, 0), (5, 2), (5, 4), (5, 6), (5, 8)}
{(−3, 1), (−2, 2), (−1, 3), (0, 4), (0, 5)}


Evaluate.
find , , and
; find , , and
; find , , and
; find , , and
; find , , and
; find , , and
; find , , and
; find , , and
; find , , and
; find , , and
; find , , and
; find , , and
; find , , and
; find , ,
find , ,
; find , ,
; find , , and
; find , , and
; find , ,
; find , ,
Given the function find
Find x given the function.
; find x where
; find x where
; find x where
; find x where
; find x where
; find x where
; find x where
; find x where
The value of a new car in dollars is given by the function where t represents the age of the car in years. Use the function to determine the value of the car when it is 4 years old. What was the value of the car new?
The monthly income in dollars of a commissioned car salesperson is given by the function where n represents the number of cars sold in the month. Use the function to determine the salesperson’s income if he sells 3 cars this month. What is his income if he does not sell any cars in one month?
Given the graph of the function , find the function values.
Find , , and
Find , , and
Find , , and

Find , , and
Find , , and
Find , , and
Find , , and
Find , , and
Find , , and
Find , , and
Given the graph of a function , find the x-values.
Find x where , , and
Find x where , , and
Find x where , , and
Find x where , , and
Find x where , , and
Find x where , , and
Find x where , , and
Find x where , , and
Find x where and
Find x where
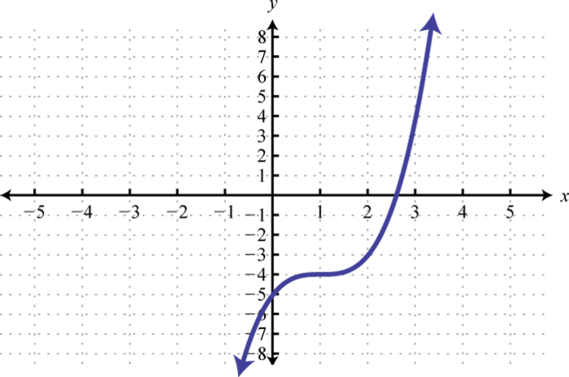
The value of a certain automobile in dollars depends on the number of years since it was purchased in 1970 according to the following function:
What was the value of the car when it was new in 1970?
In what year was the value of the car at a minimum?
What was the value of the car in 2005?
In what years was the car valued at $4,000?
Given the linear function defined by simplify the following.
Simplify given
Simplify given
Simplify given
Simplify given
Who is credited with the introduction of the notation ? Provide a brief summary of his life and accomplishments.
Explain to a beginning algebra student what the vertical line test is and why it works.
Research and discuss the life and contributions of René Descartes.
Conduct an Internet search for the vertical line test, functions, and evaluating functions. Share a link to a page that you think others may find useful.
Domain: {3, 5, 7, 9, 12}; range: {1, 2, 3, 4}; function: yes
Domain: {7, 8, 10, 15}; range: {5, 6, 7, 8, 9}; function: no
Domain: {5}; range: {0, 2, 4, 6, 8}; function: no
Domain: {−4, −1, 0, 2, 3}; range: {1, 2, 3}; function: yes
Domain: {−1, 0, 1, 2}; range: {0, 1, 2, 3, 4}; function: no
Domain: {−2}; range: {−4, −2, 0, 2, 4}; function: no
Domain: ; range: ; function: yes
Domain: ; range: ; function: no
Domain: ; range: ; function: yes
Domain: ; range: ; function: yes
Domain: ; range: ; function: yes
Domain: ; range: ; function: no
Domain: ; range: ; function: yes
Domain: ; range: ; function: yes
Domain: ; range: ; function: yes
Domain: ; range: ; function: no
Domain: ; range: ; function: yes
, ,
, ,
, ,
, ,
, ,
, ,
, ,
, ,
, ,
, ,
New: $22,000; 4 yrs old: $14,800
, ,
, ,
, ,
, ,
, ,
, , and
, ,
, ,
, ,
;
$5,000
$10,000
4
3
m
Answer may vary
Answer may vary
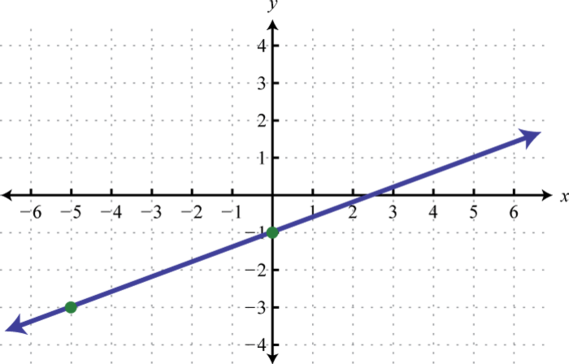
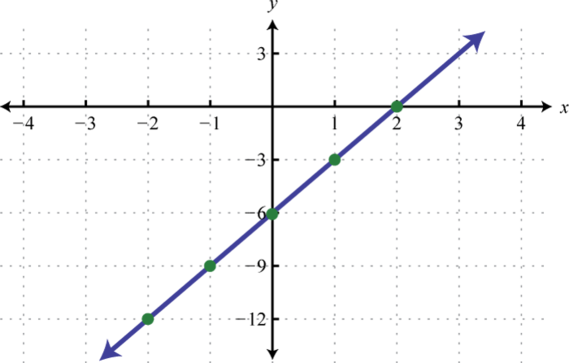
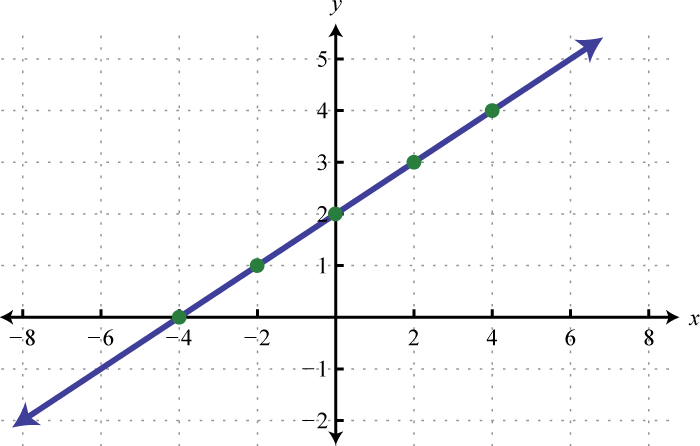
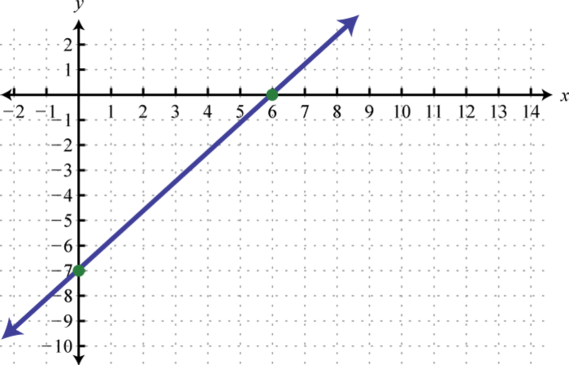
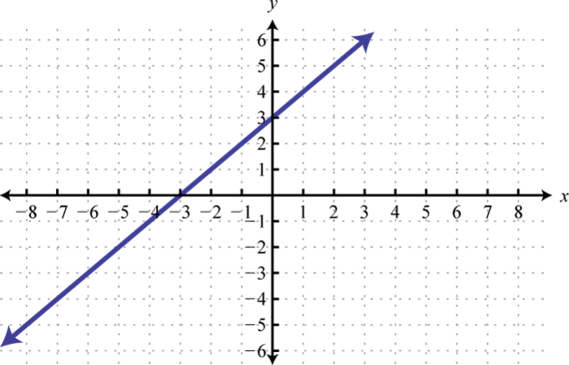
Recall that the set of all solutions to a linear equation can be represented on a rectangular coordinate plane using a straight line through at least two points; this line is called its graph. For example, to graph the linear equation we would first solve for y.
Written in this form, we can see that y depends on x; in other words, x is the independent variableThe variable that determines the values of other variables. Usually we think of the x-value of an ordered pair (x, y) as the independent variable. and y is the dependent variableThe variable whose value is determined by the value of the independent variable. Usually we think of the y-value of an ordered pair (x, y) as the dependent variable.. Choose at least two x-values and find the corresponding y-values. It is a good practice to choose zero, some negative numbers, as well as some positive numbers. Here we will choose five x values, determine the corresponding y-values, and then form a representative set of ordered pair solutions.
x |
y |
Solutions |
|
|---|---|---|---|
−2 |
7 |
(−2, 7) |
|
−1 |
5 |
(−1, 5) |
|
0 |
3 |
(0, 3) |
|
4 |
−5 |
(4, −5) |
|
6 |
−9 |
(6, −9) |
Plot the points and draw a line through the points with a straightedge. Be sure to add arrows on either end to indicate that the graph extends indefinitely.
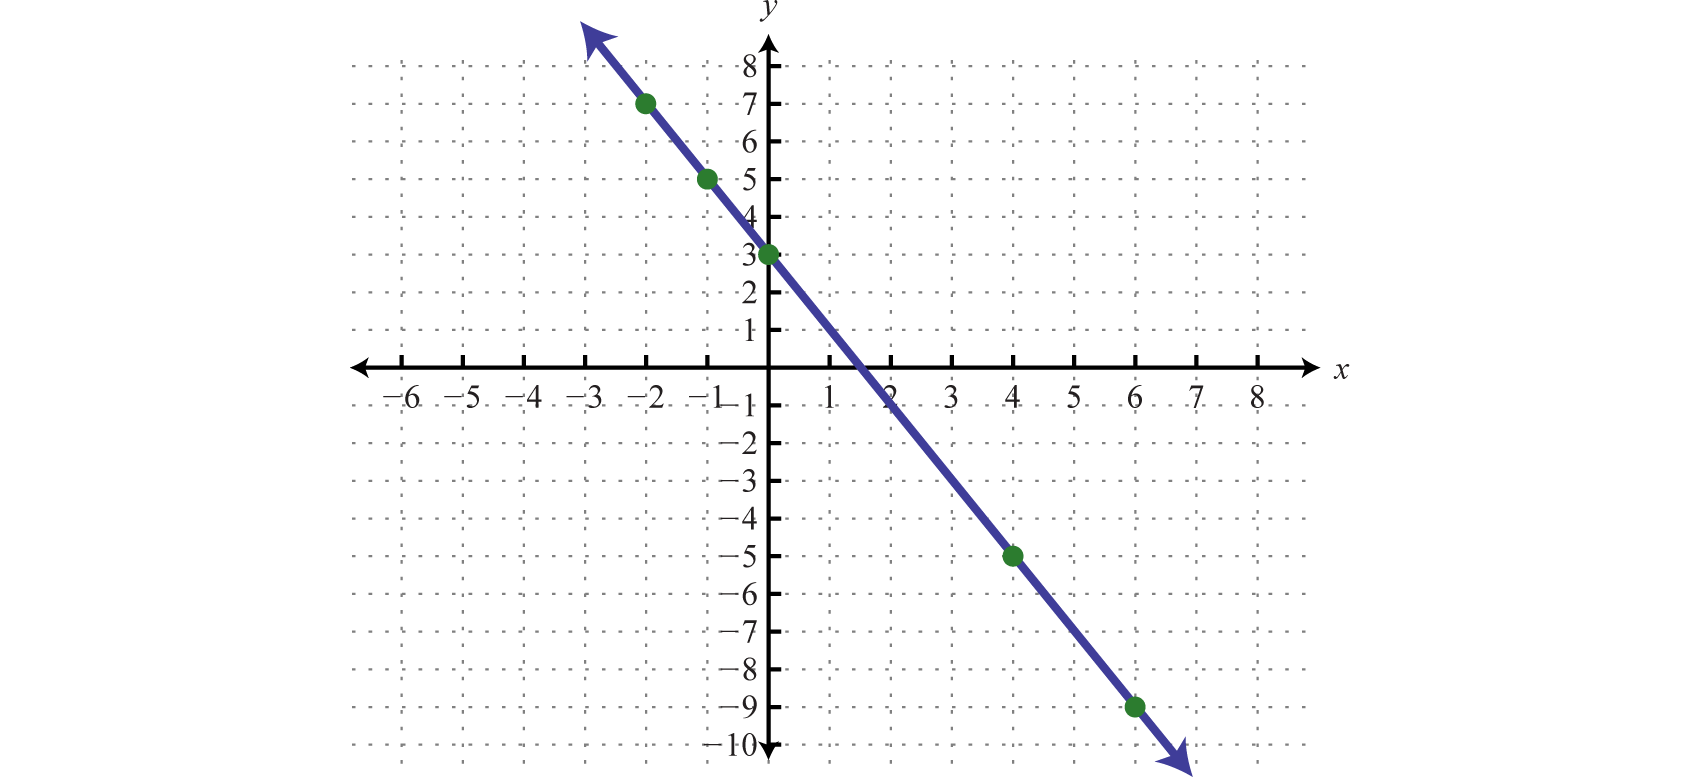
The resulting line represents all solutions to , of which there are infinitely many. The above process describes the technique for graphing known as plotting pointsA way of determining a graph using a finite number of representative ordered pair solutions.. This technique will be used to graph more complicated functions as we progress in this course.
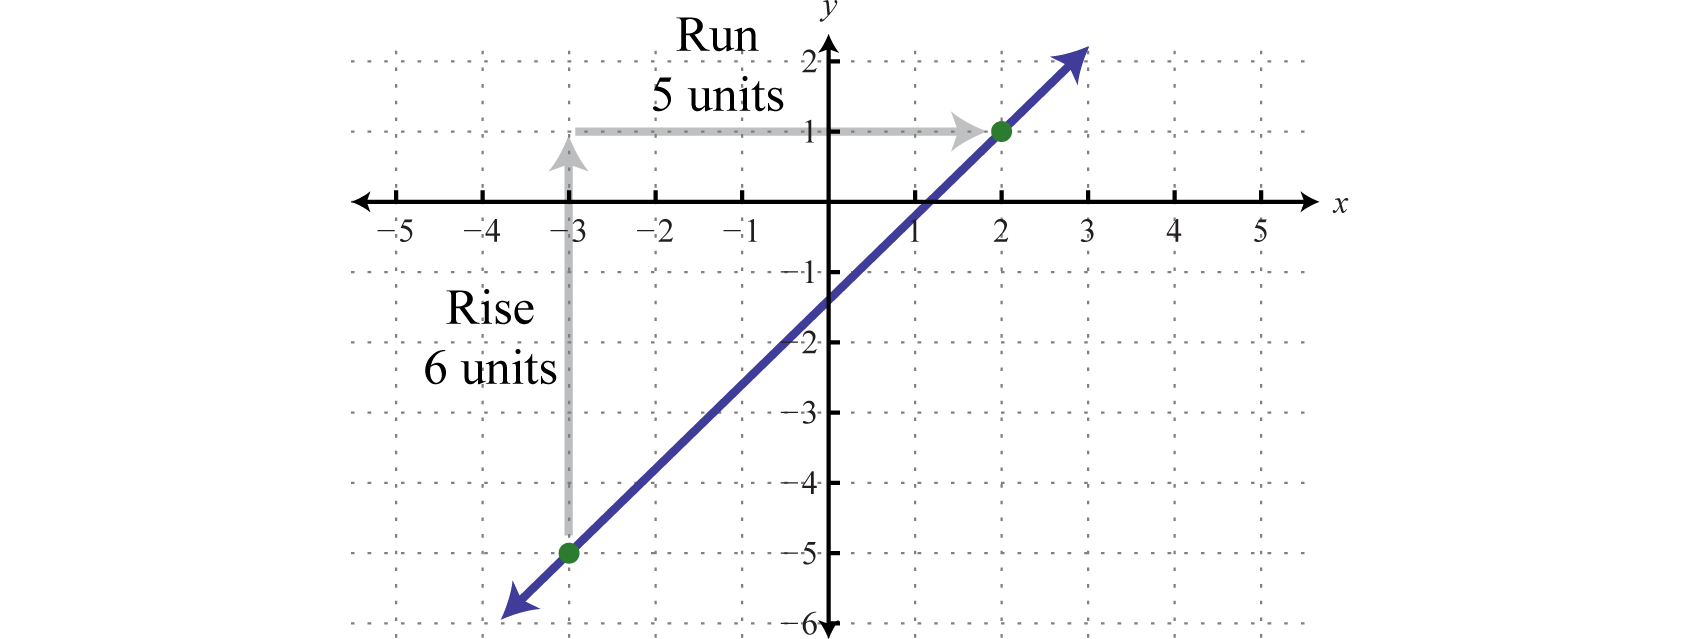
The steepness of any incline can be measured as the ratio of the vertical change to the horizontal change. For example, a 5% incline can be written as , which means that for every 100 feet forward, the height increases 5 feet.

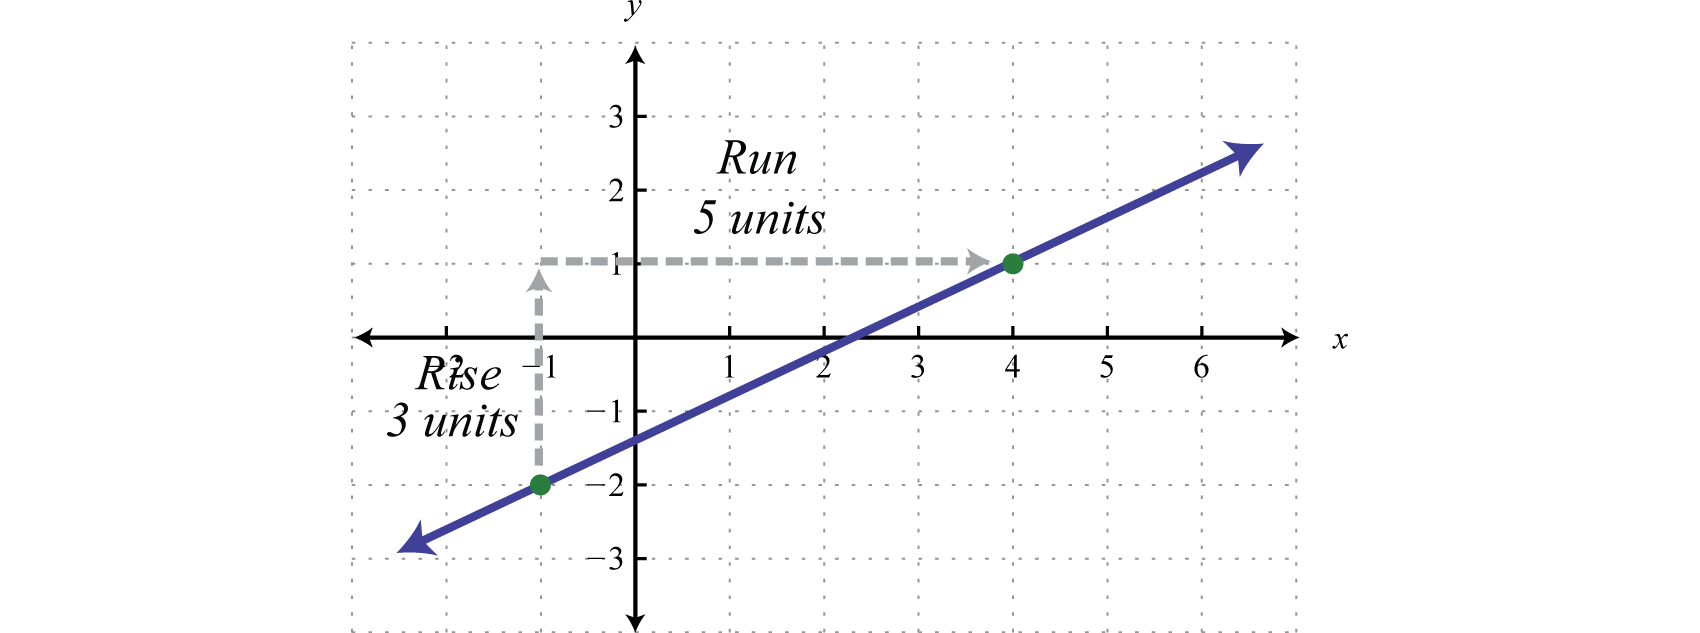
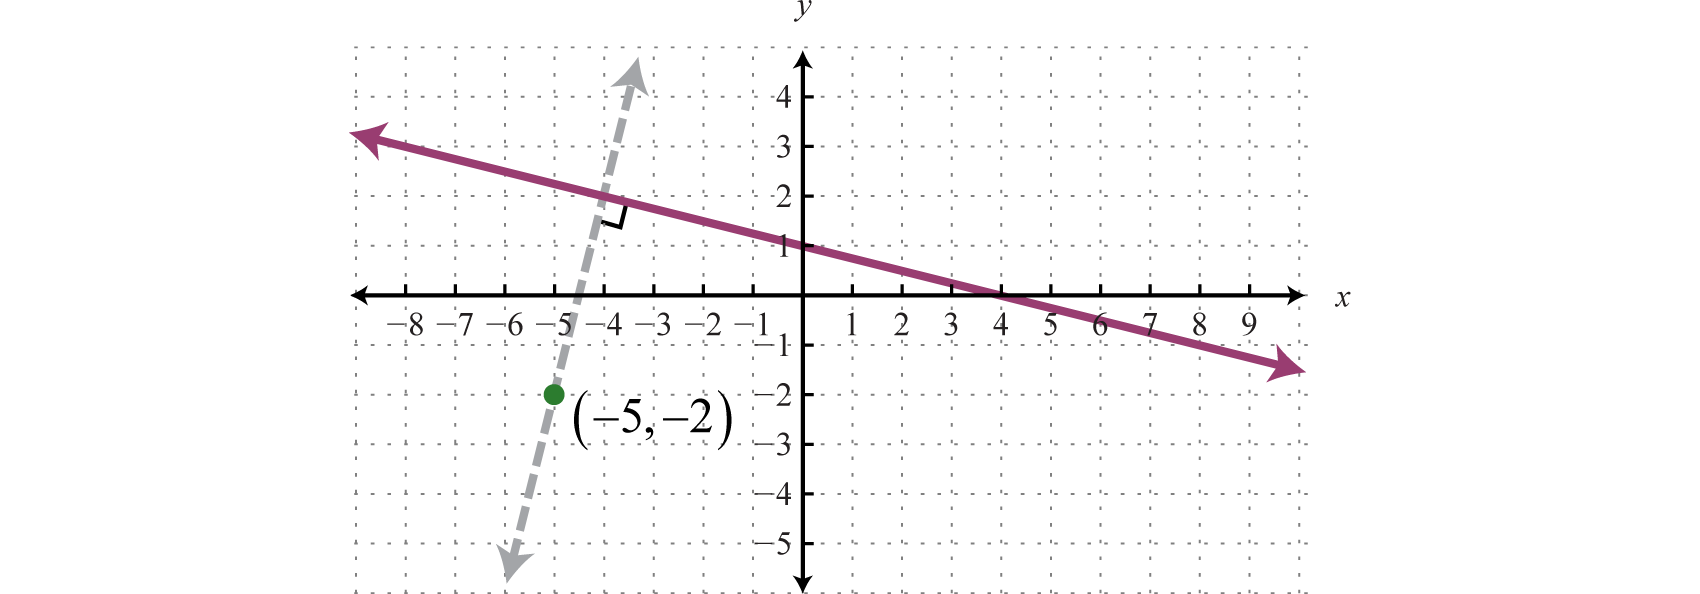
In mathematics, we call the incline of a line the slopeThe incline of a line measured as the ratio of the vertical change to the horizontal change, often referred to as “rise over run.”, denoted by the letter m. The vertical change is called the riseThe vertical change between any two points on a line. and the horizontal change is called the runThe horizontal change between any two points on a line.. Given any two points and , we can obtain the rise and run by subtracting the corresponding coordinates.

This leads us to the slope formulaThe slope of the line through the points and is given by the formula . Given any two points and , the slope is given by:
The Greek letter delta () is often used to describe the change in a quantity. Therefore, the slope is sometimes described using the notation , which represents the change in y divided by the change in x.
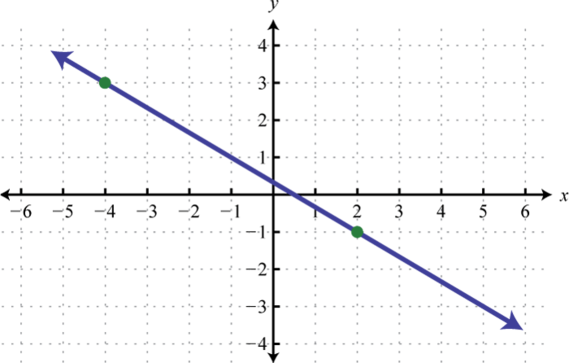
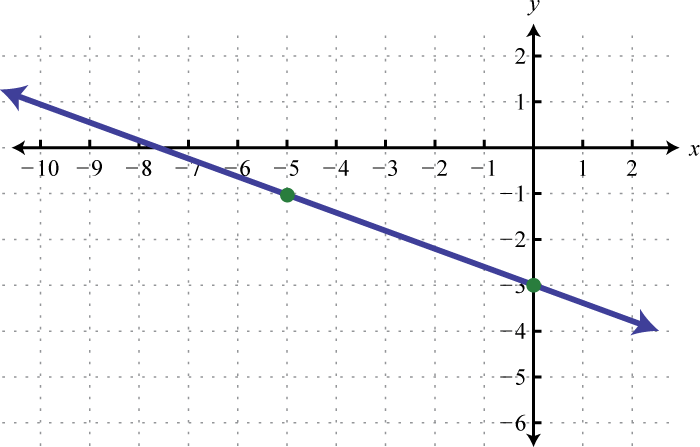
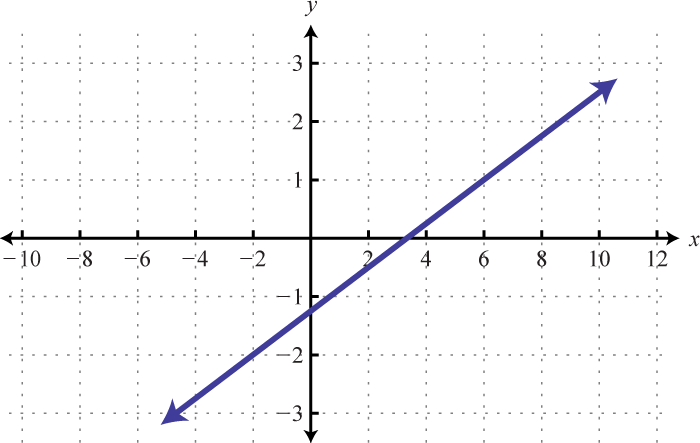
Find the slope of the line passing through (−3, −5) and (2, 1).
Solution:
Given (−3, −5) and (2, 1), calculate the difference of the y-values divided by the difference of the x-values. Take care to be consistent when subtracting the coordinates:
It does not matter which point you consider to be the first and second. However, because subtraction is not commutative, you must take care to subtract the coordinates of the first point from the coordinates of the second point in the same order. For example, we obtain the same result if we apply the slope formula with the points switched:
Answer:
Verify that the slope is by graphing the line described in the previous example.
Certainly the graph is optional; the beauty of the slope formula is that, given any two points, we can obtain the slope using only algebra.
Find the y-value for which the slope of the line passing through and is
Solution:
Substitute the given information into the slope formula.
After substituting in the given information, the only variable left is y. Solve.
Answer: y = 7
There are four geometric cases for the value of the slope.

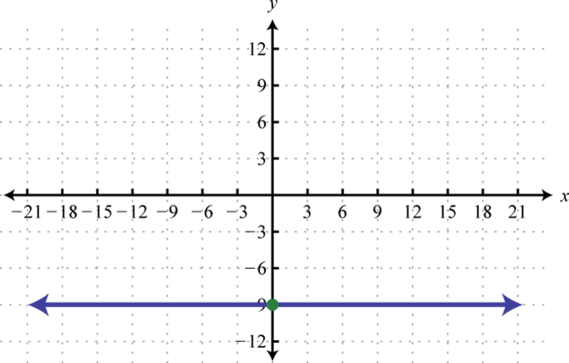
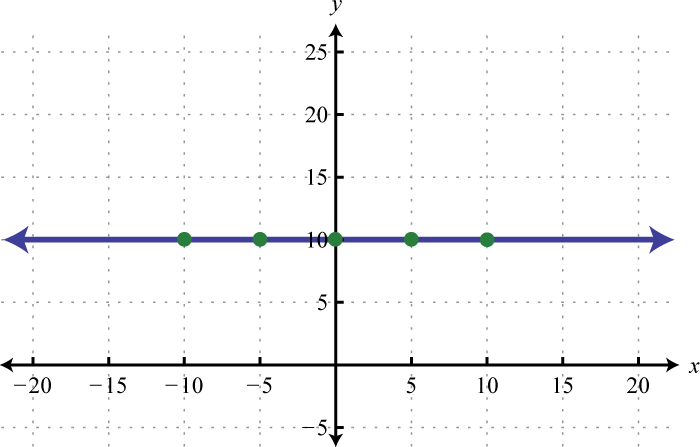
Reading the graph from left to right, lines with an upward incline have positive slopes and lines with a downward incline have negative slopes. The other two cases involve horizontal and vertical lines. Recall that if k is a real number we have
For example, if we graph we obtain a horizontal line, and if we graph we obtain a vertical line.
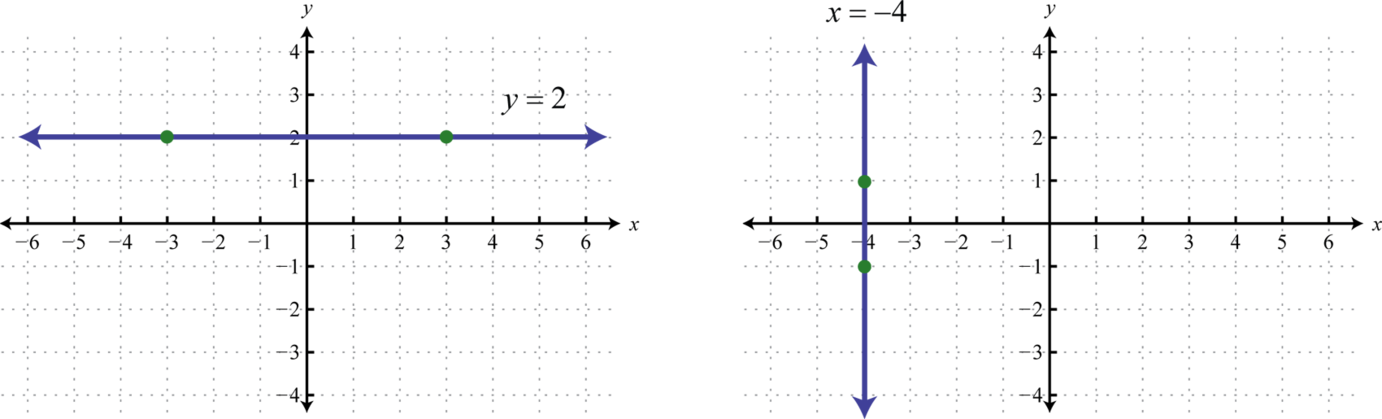
From the graphs we can determine two points and calculate the slope using the slope formula.
Horizontal Line |
Vertical Line |
|---|---|
|
|
|
Notice that the points on the horizontal line share the same y-values. Therefore, the rise is zero and hence the slope is zero. The points on the vertical line share the same x-values. Consequently, the run is zero, leading to an undefined slope. In general,

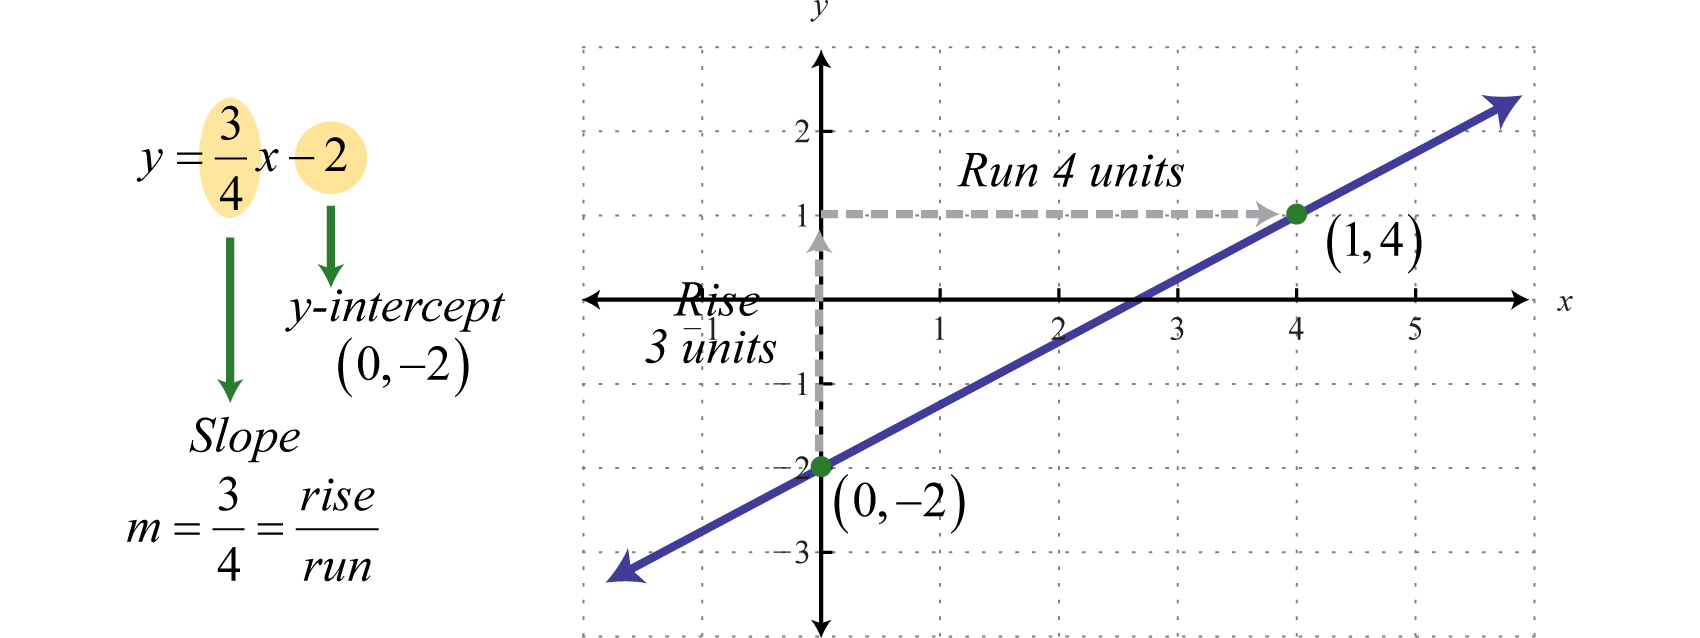
Given any linear equation in standard formAny nonvertical line can be written in the standard form , , we can solve for y to obtain slope-intercept formAny nonvertical line can be written in the form , where m is the slope and (0, b) is the y-intercept., For example,
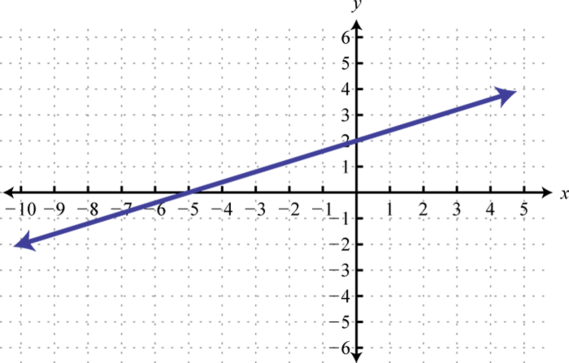
Where , we can see that and thus is an ordered pair solution. This is the point where the graph intersects the y-axis and is called the y-interceptThe point (or points) where a graph intersects the y-axis, expressed as an ordered pair (0, y).. We can use this point and the slope as a means to quickly graph a line. For example, to graph , start at the y-intercept and mark off the slope to find a second point. Then use these points to graph the line as follows:
The vertical line test indicates that this graph represents a function. Furthermore, the domain and range consists of all real numbers.
In general, a linear functionAny function that can be written in the form is a function that can be written in the form where the slope m and b represent any real numbers. Because , we can use and interchangeably, and ordered pair solutions on the graph can be written in the form
We know that any y-intercept will have an x-value equal to zero. Therefore, the y-intercept can be expressed as the ordered pair For linear functions,
Hence, the y-intercept of any linear function is To find the x-interceptThe point (or points) where a graph intersects the x-axis, expressed as an ordered pair (x, 0)., the point where the function intersects the x-axis, we find x where or
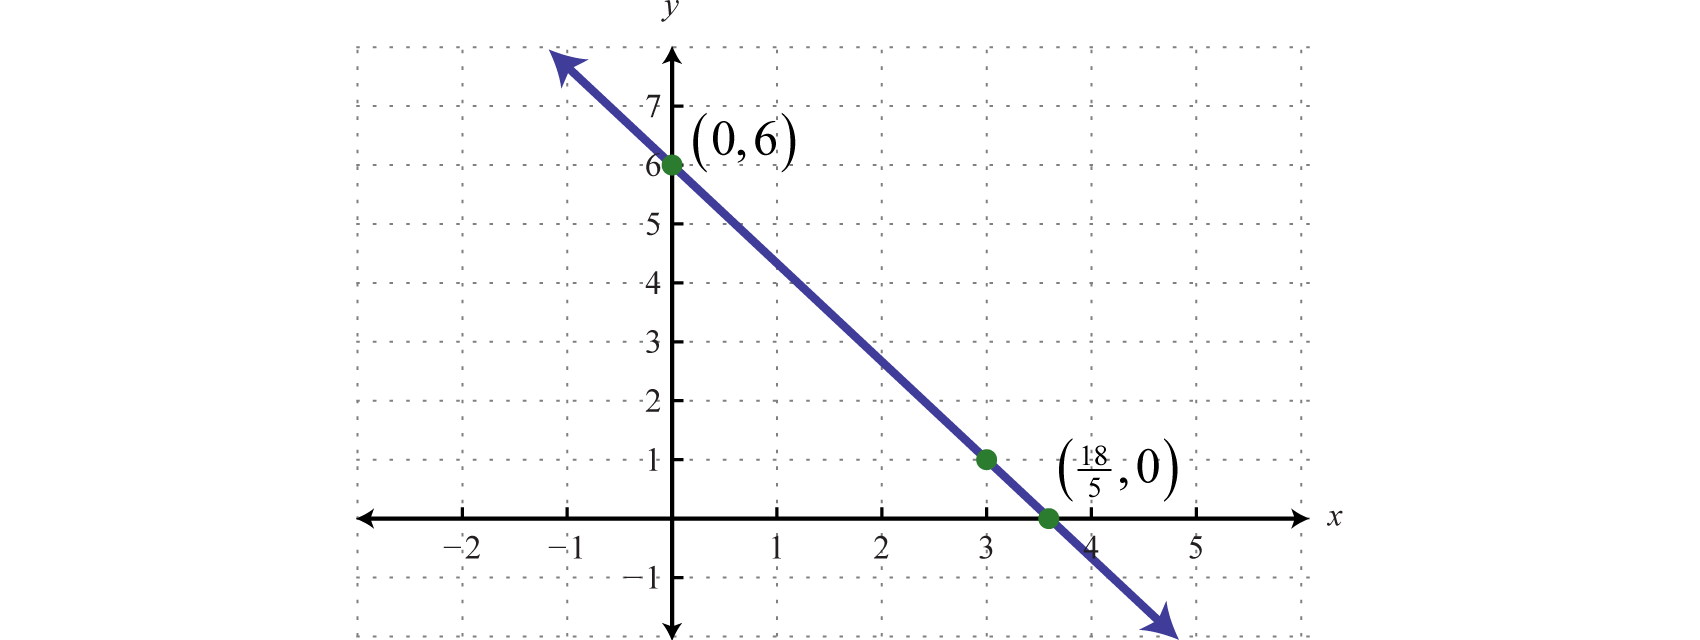
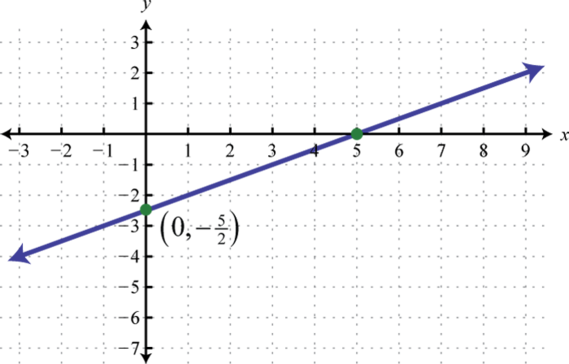
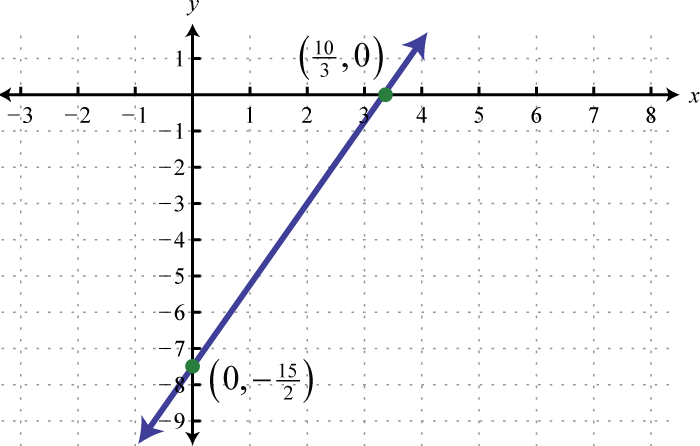
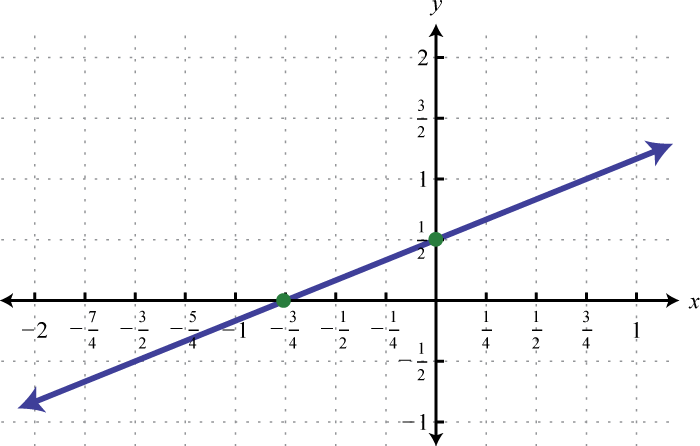
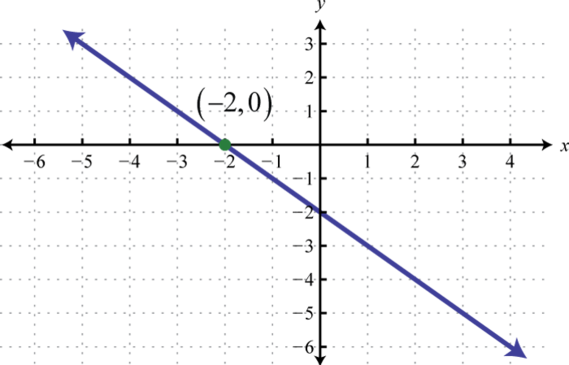
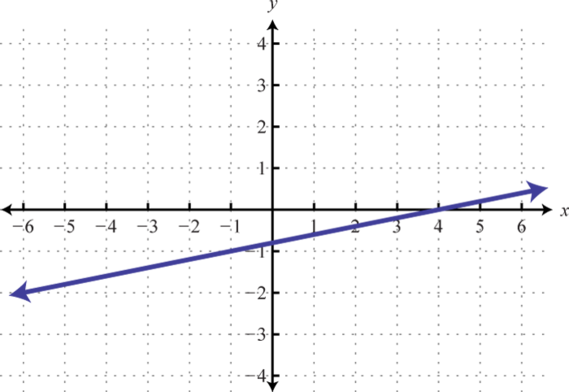
Graph the linear function and label the x-intercept.
Solution:
From the function, we see that (or ) and thus the y-intercept is (0, 6). Also, we can see that the slope Starting from the y-intercept, mark a second point down 5 units and right 3 units. Draw the line passing through these two points with a straightedge.
To determine the x-intercept, find the x-value where the function is equal to zero. In other words, determine x where
Therefore, the x-intercept is The general rule is to label all important points that cannot be clearly read from the graph.
Answer:
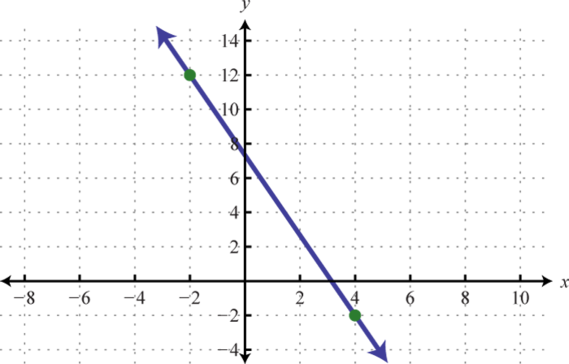
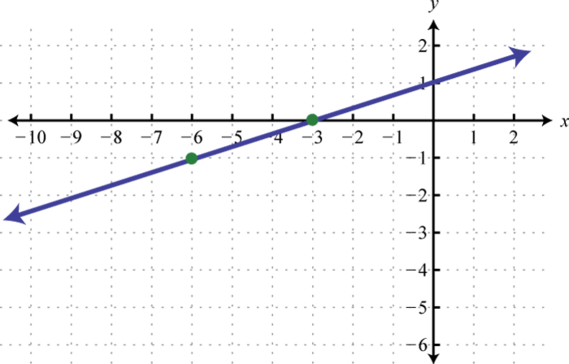
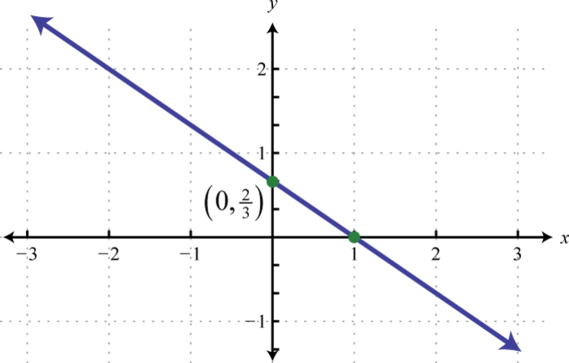
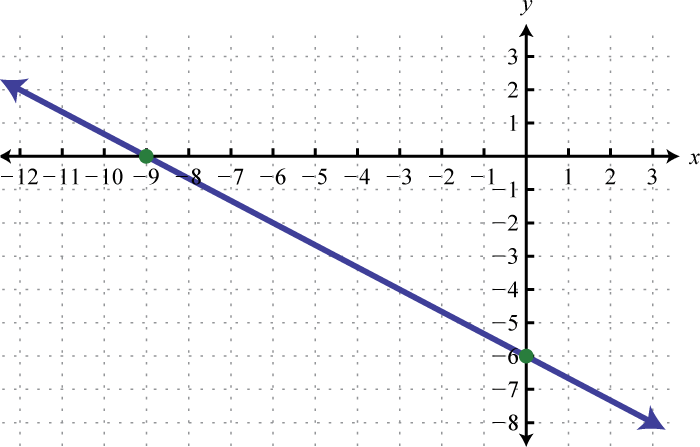
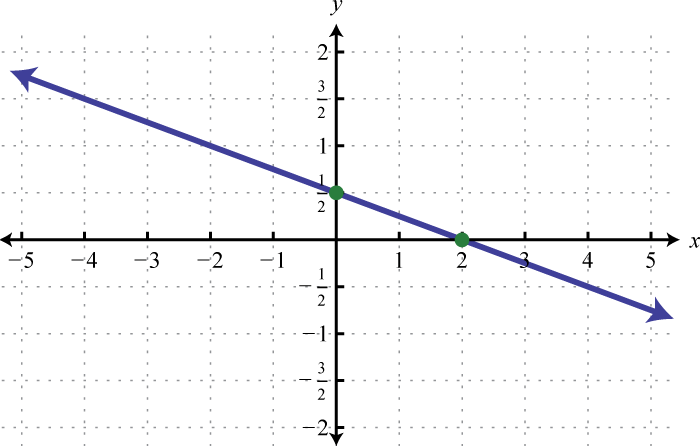
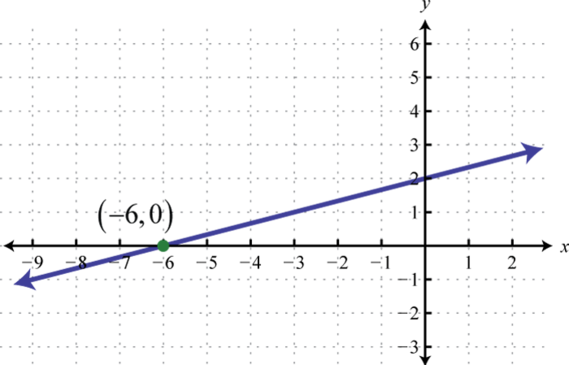
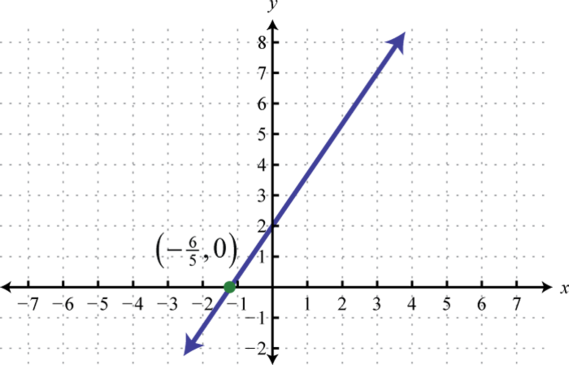
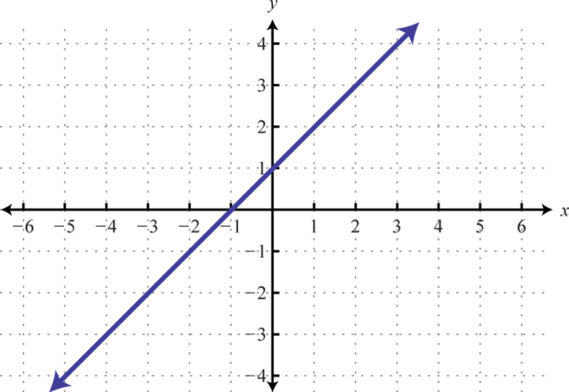
Determine a linear function that defines the given graph and find the x-intercept.
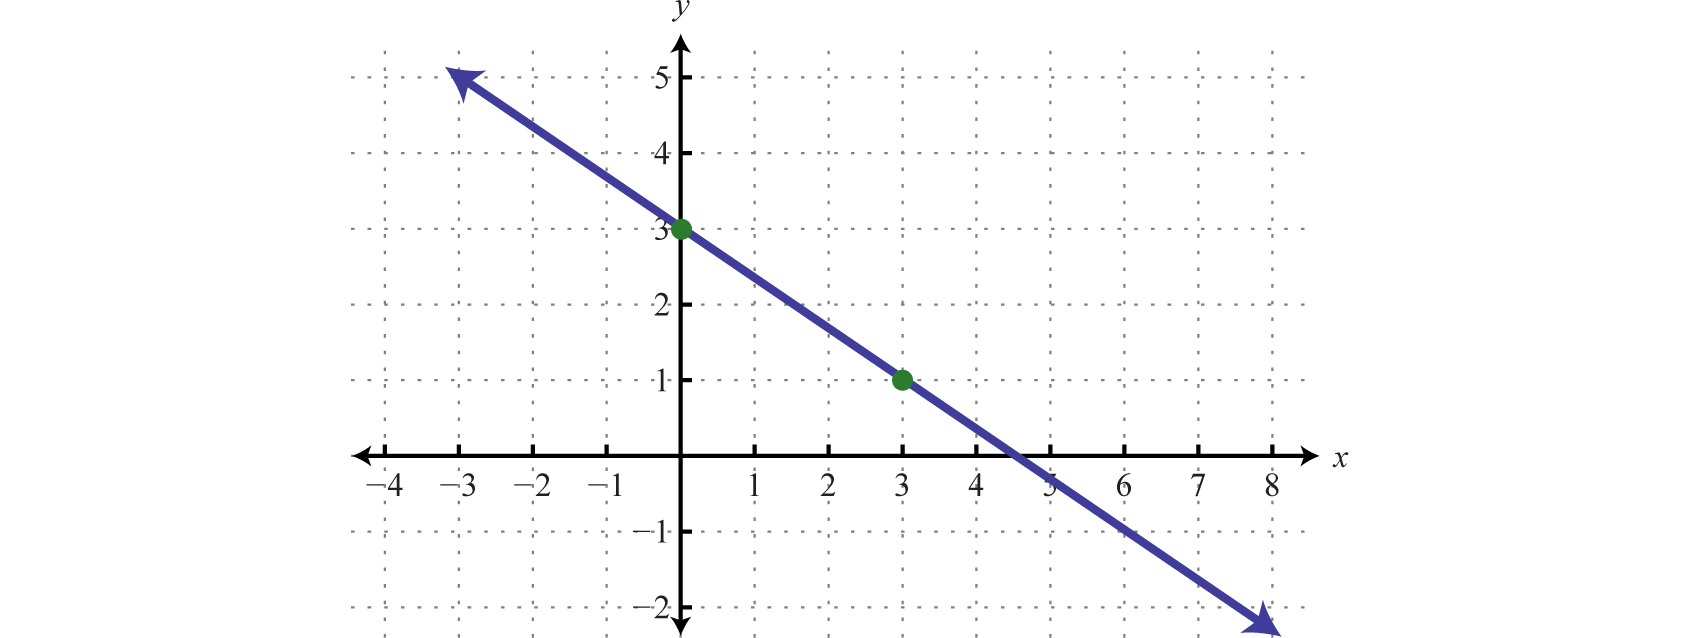
Solution:
We begin by reading the slope from the graph. In this case, two points are given and we can see that,
In addition, the y-intercept is (0, 3) and thus We can substitute into the equation for any linear function.
To find the x-intercept, we set and solve for x.
Answer: ; x-intercept:
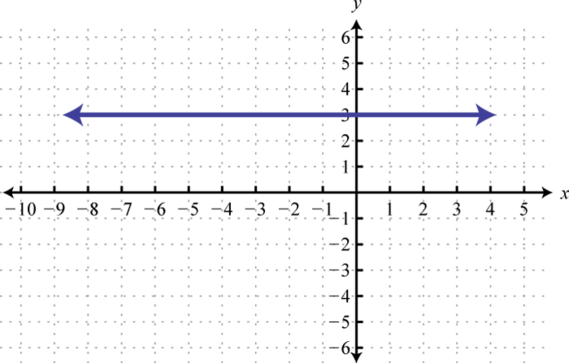
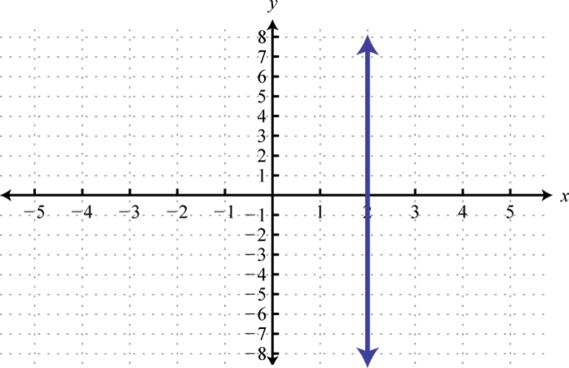
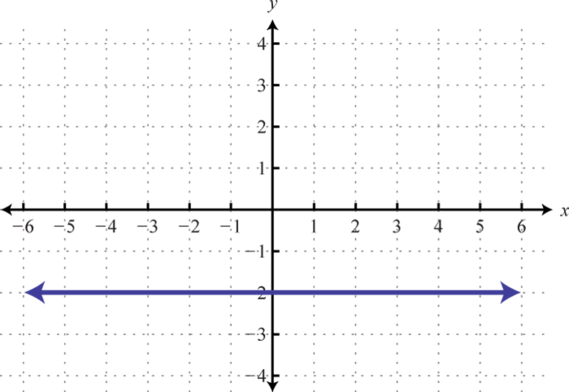
Next, consider horizontal and vertical lines. Use the vertical line test to see that any horizontal line represents a function, and that a vertical line does not.
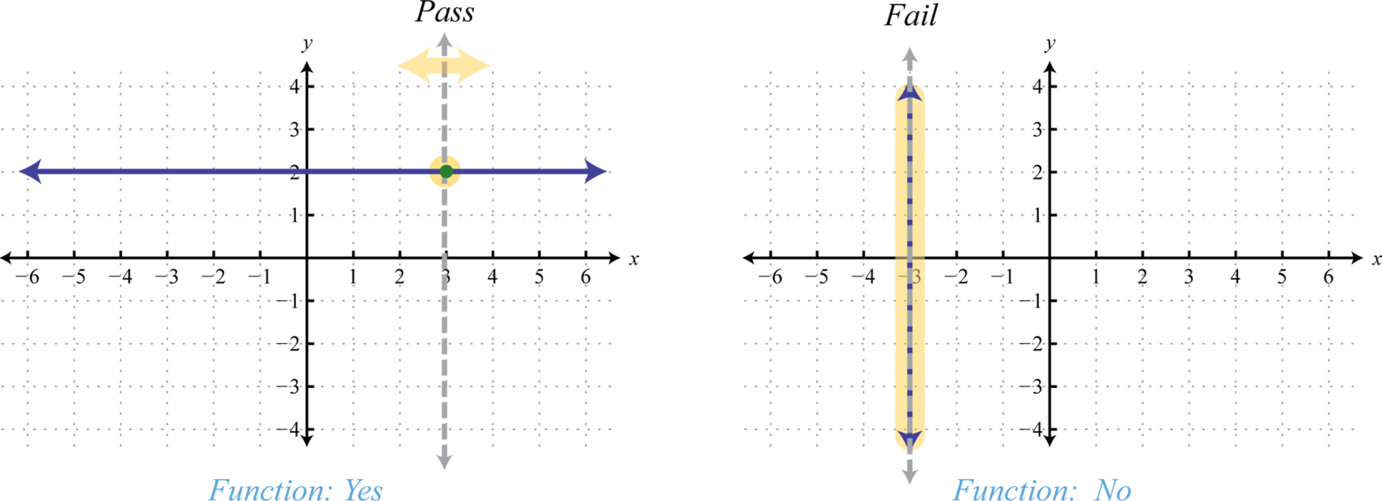
Given any horizontal line, the vertical line test shows that every x-value in the domain corresponds to exactly one y-value in the range; it is a function. A vertical line, on the other hand, fails the vertical line test; it is not a function. A vertical line represents a set of ordered pairs where all of the elements in the domain are the same. This violates the requirement that functions must associate exactly one element in the range to each element in the domain. We summarize as follows:
|
Horizontal Line |
Vertical Line |
|---|---|---|
Equation: |
||
x-intercept: |
None |
|
y-intercept: |
None |
|
Domain: |
||
Range: |
||
Function: |
Yes |
No |
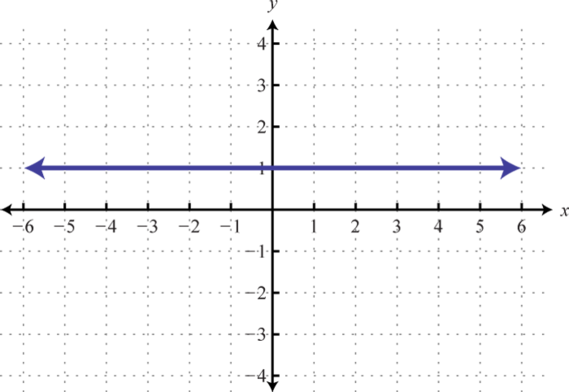
A horizontal line is often called a constant function. Given any real number c,
Graph the constant function and state the domain and range.
Solution:
Here we are given a constant function that is equivalent to This defines a horizontal line through

Answer: Domain: ; range:
We can use the ideas in this section to develop a geometric understanding of what it means to solve equations of the form , where f and g are linear functions. Using algebra, we can solve the linear equation as follows:
The solution to this equation is x = 4. Geometrically, this is the x-value of the intersection of the two graphs and The idea is to graph the linear functions on either side of the equation and determine where the graphs coincide.
Graph and on the same set of axes and determine where
Solution:
Here is a linear function with slope and y-intercept (0,1). The function is a constant function and represents a horizontal line. Graph both of these functions on the same set of axes.
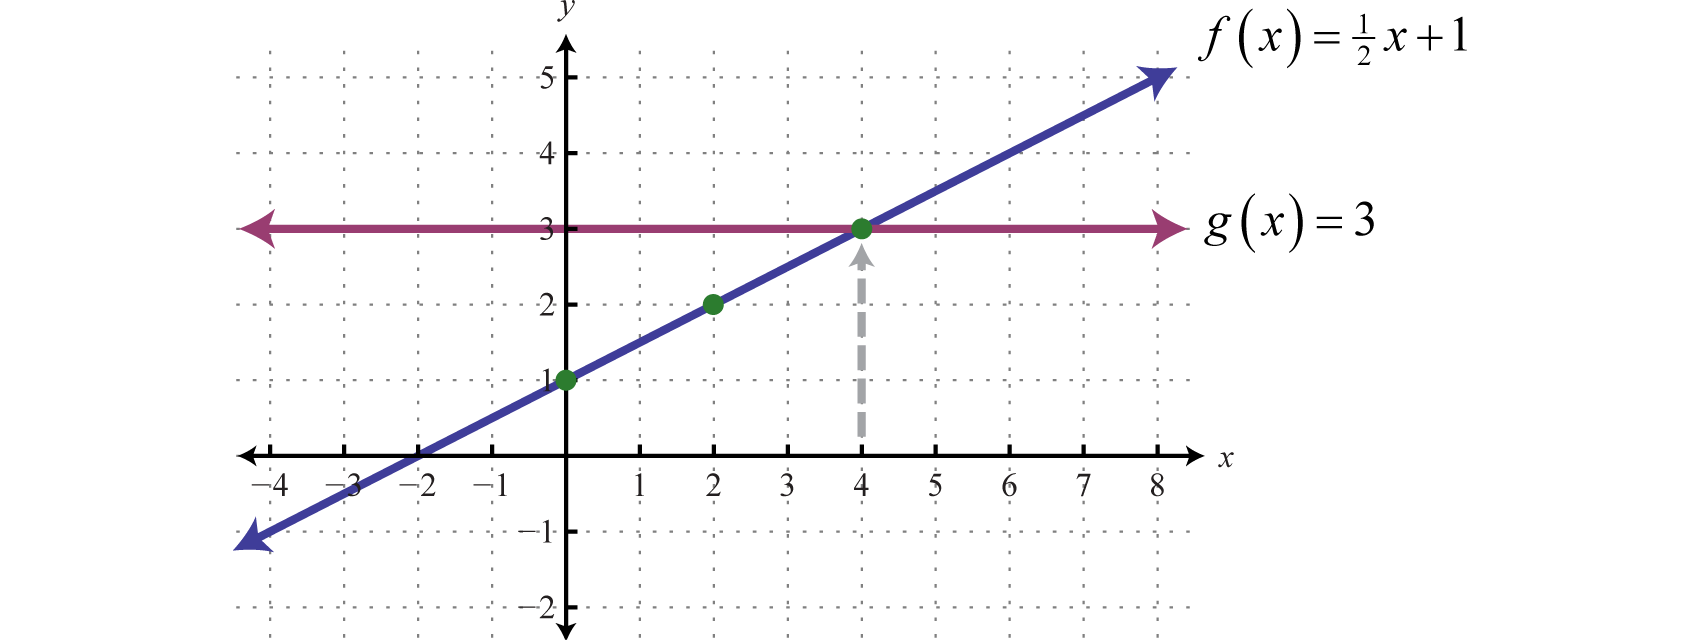
From the graph we can see that where In other words, where
Answer: x = 4
We can extend the geometric interpretation a bit further to solve inequalities. For example, we can solve the linear inequality , using algebra, as follows:
The solution set consists of all real numbers greater than or equal to 4. Geometrically, these are the x-values for which the graph lies above the graph of
Graph and on the same set of axes and determine where
Solution:
On the graph we can see this shaded.
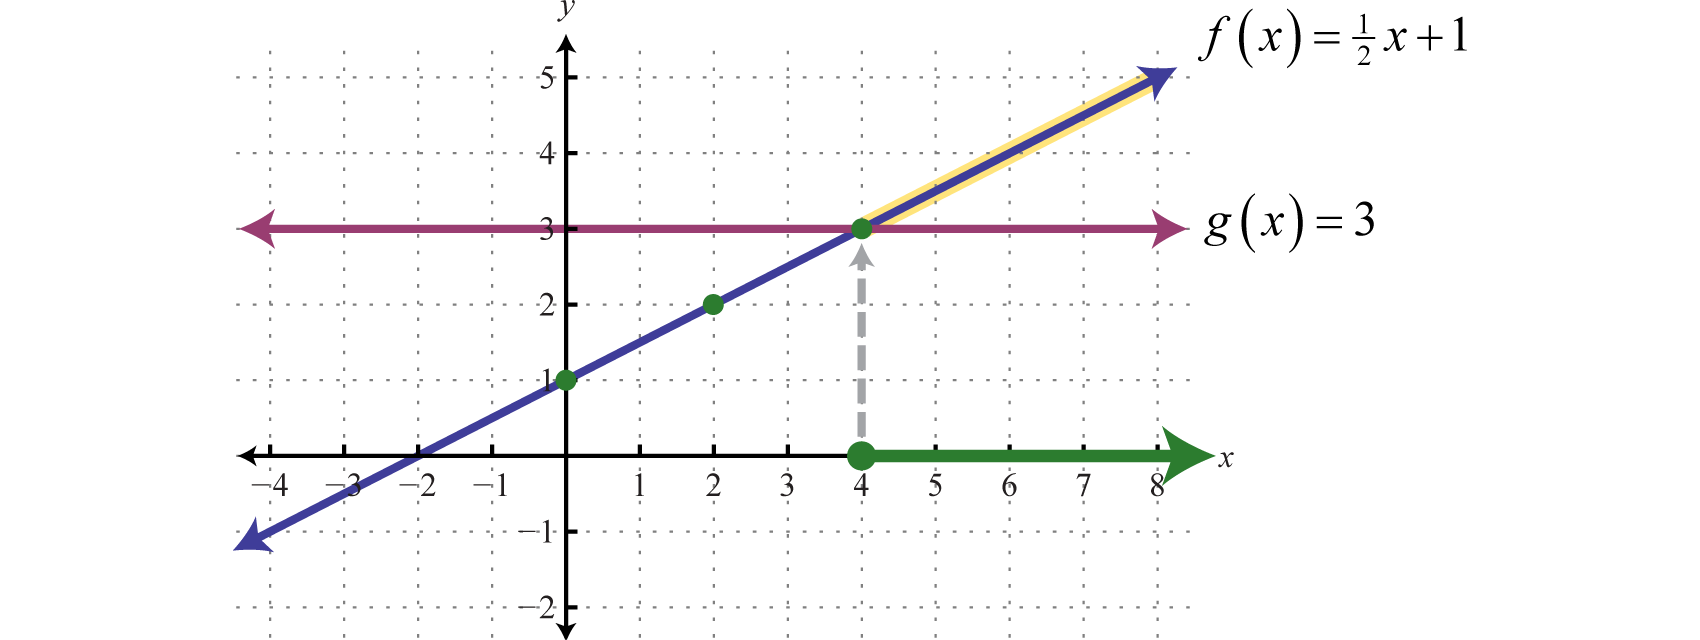
From the graph we can see that or where
Answer: The x-values that solve the inequality, in interval notation, are
Find five ordered pair solutions and graph.
Find the slope of the line passing through the given points.
and
and
and
and
and
and
Find the y-value for which the slope of the line passing through given points has the given slope.
; ,
; ,
; ,
; ,
; ,
; ,
Given the graph, determine the slope.
Find the x- and y-intercepts and use them to graph the following functions.
Graph the linear function and label the x-intercept.
Determine the linear function that defines the given graph and find the x-intercept.

Graph the functions and on the same set of axes and determine where Verify your answer algebraically.
,
,
,
,
,
,
,
,
,
,
Graph the functions and on the same set of axes and determine where Verify your answer algebraically.
,
,
,
,
,
,
,
,
Graph the functions and on the same set of axes and determine where Verify your answer algebraically.
,
,
,
,
,
,
,
,
Do all linear functions have y-intercepts? Do all linear functions have x-intercepts? Explain.
Can a function have more than one y-intercept? Explain.
How does the vertical line test show that a vertical line is not a function?

1
Undefined


;
;
; none
;
Answer may vary
Answer may vary
Given the algebraic equation of a line, we can graph it in a number of ways. In this section, we will be given a geometric description of a line and find the algebraic equation. Finding the equation of a line can be accomplished in a number of ways. The following example makes use of slope-intercept form, , or using function notation, If we can determine the slope, m, and the y-intercept, (0, b), we can then construct the equation.
Find the equation of the line passing through and
Solution:
We begin by finding the slope. Given two points, we can find the slope using the slope formula.
Here and we have
To find b, substitute either one of the given points through which the line passes. Here we will use , but would work just as well:
Therefore, the equation of the line passing through the two given points is:
Answer:
Next, we outline an alternative method for finding equations of lines. Begin by applying the slope formula with a given point and a variable point
Therefore, the equation of a nonvertical line can be written in point-slope formAny nonvertical line can be written in the form , where m is the slope and is any point on the line.:
Point-slope form is particularly useful for finding the equation of a line given the slope and any ordered pair solution. After finding the slope, in the previous example, we could use this form to find the equation.
Substitute as follows.
Notice that we obtain the same linear function
Note: Sometimes a variable is not expressed explicitly in terms of another; however, it is still assumed that one variable is dependent on the other. For example, the equation implicitly represents the function You should become comfortable with working with functions in either form.
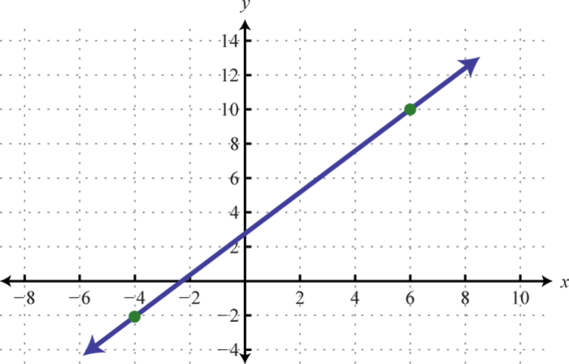
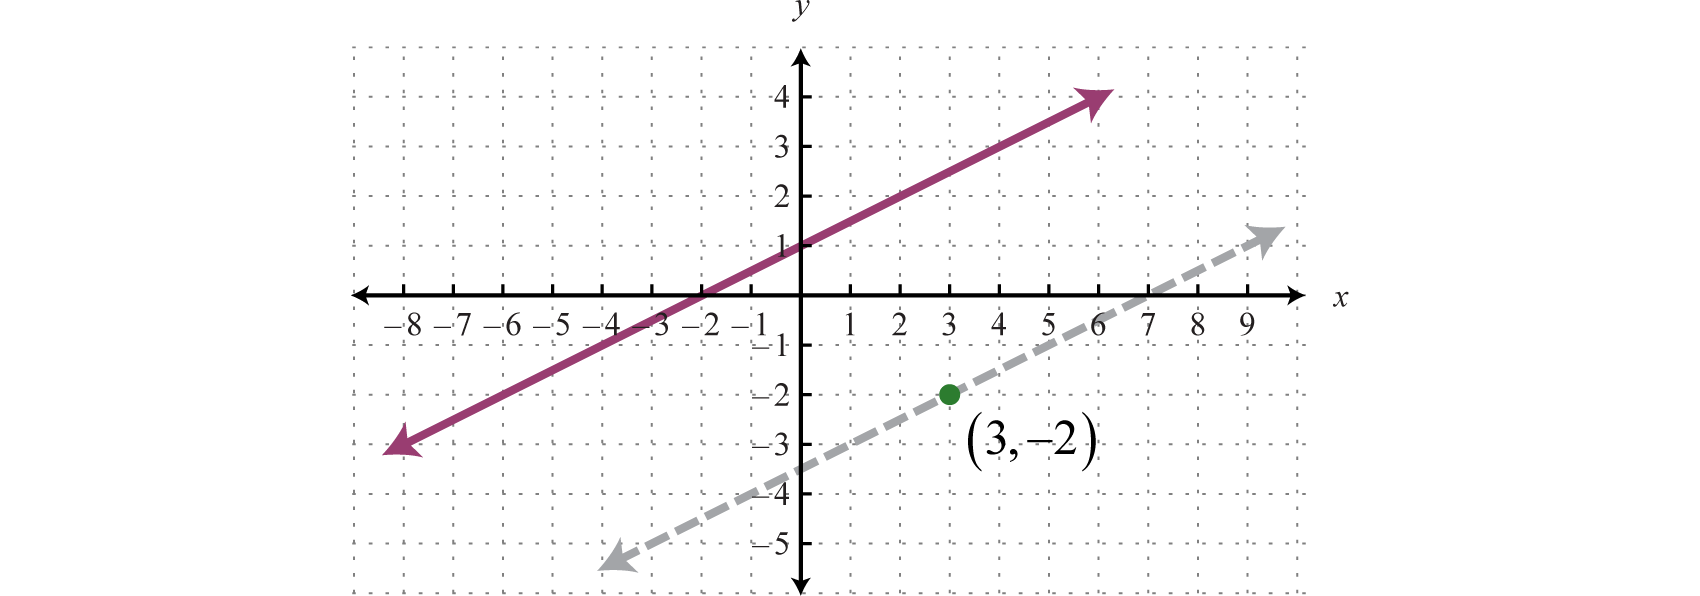
Find the equation of the following linear function:
Solution:
From the graph we can determine two points (−1, −2) and (4, 1). Use these points to read the slope from the graph. The rise is 3 units and the run is 5 units.
Therefore, we have the slope and a point. (It does not matter which of the given points we use, the result will be the same.)
Use point-slope form to determine the equation of the line.
Answer:
Recall that parallel linesLines in the same plane that do not intersect; their slopes are the same. are lines in the same plane that never intersect. Two non-vertical lines in the same plane with slopes and are parallel if their slopes are the same,
Find the equation of the line passing through and parallel to
Solution:
To find the slope of the given line, solve for y.
Here the given line has slope and thus the slope of a parallel line The notation reads “m parallel.” Since we are given a point and we now have the slope, we will choose to use point-slope form of a line to determine the equation.
Answer:
It is important to have a geometric understanding of this question. We were asked to find the equation of a line parallel to another line passing through a certain point.
Through the point we found a parallel line,, shown as a dashed line. Notice that the slope is the same as the given line, , but the y-intercept is different.
Recall that perpendicular linesLines in the same plane that intersect at right angles; their slopes are opposite reciprocals. are lines in the same plane that intersect at right angles (90 degrees). Two nonvertical lines, in the same plane with slopes and , are perpendicular if the product of their slopes is −1, We can solve for and obtain In this form, we see that perpendicular lines have slopes that are negative reciprocalsUsed when referring to opposite reciproacals., or opposite reciprocalsTwo real numbers whose product is −1. Given a real number , the opposite reciprocal is . In general, given real numbers a and b,
The mathematical notation reads “m perpendicular”. For example, the opposite reciprocal of is We can verify that two slopes produce perpendicular lines if their product is −1.
Find the equation of the line passing through and perpendicular to
Solution:
To find the slope of the given line, solve for y.
The given line has slope , and thus, Substitute this slope and the given point into point-slope form.
Answer:
Geometrically, we see that the line , shown as a dashed line in the graph, passes through and is perpendicular to the given line
Try this! Find the equation of the line passing through and perpendicular to
Answer:
Data can be used to construct functions that model real-world applications. Once an equation that fits given data is determined, we can use the equation to make certain predictions; this is called mathematical modelingUsing data to find mathematical equations that describe, or model, real-world applications..
The cost of a daily truck rental is $48.00, plus an additional $0.45 for every mile driven. Write a function that gives the cost of the daily truck rental and use it to determine the total cost of renting the truck for a day and driving it 60 miles.
Solution:
The total cost of the truck rental depends on the number of miles driven. If we let x represent the number of miles driven, then 0.45x represents the variable cost of renting the truck. Use this and the fixed cost, $48.00, to write a function that models the total cost,
Use this function to calculate the cost of the rental when miles.
Answer: The total cost of renting the truck for the day and driving it 60 miles would be $75.
We can use the model to answer many more questions. For example, how many miles can be driven to keep the cost of the rental at most $66? To answer this question, set up an inequality that expresses the cost less than or equal to $66.
Solve for x to determine the number of miles that can be driven.
To limit the rental cost to $66, the truck can be driven 40 miles or less.
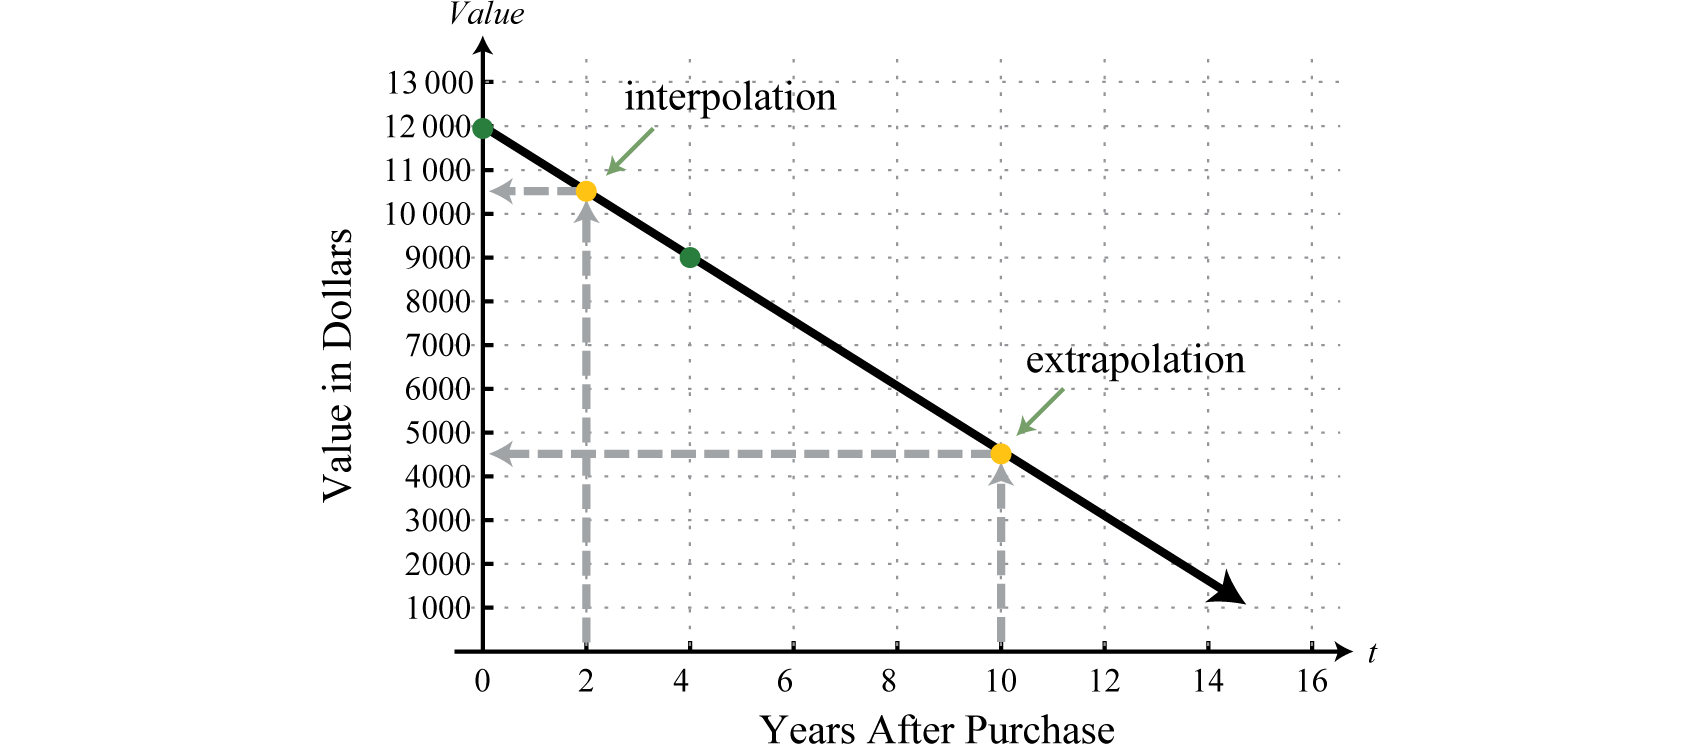
A company purchased a new piece of equipment for $12,000. Four years later it was valued at $9,000 dollars. Use this data to construct a linear function that models the value of the piece of equipment over time.
Solution:
The value of the item depends on the number of years after it was purchased. Therefore, the age of the piece of equipment is the independent variable. Use ordered pairs where the x-values represent the age and the y-values represent the corresponding value.
From the problem, we can determine two ordered pairs. Purchased new (age = 0), the item cost $12,000, and 4 years later the item was valued at $9,000. Therefore, we can write the following two ordered pairs:
Use these two ordered pairs to construct a linear model. Begin by finding the slope m.
Here we have m = −750. The ordered pair (0, 12,000) gives the y-intercept; therefore, b = 12,000.
Lastly, write this model as a function which gives the value of the piece of equipment over time. Choose the function name V, for value, and the variable t instead of x to represent time in years.
Answer:
The function called a linear depreciation modelA linear function used to describe the declining value of an item over time.. It uses a linear equation to expresses the declining value of an item over time. Using this function to determine the value of the item between the given data points is called interpolationUsing a linear function to estimate a value between given data points.. For example, we can use the function to determine the value of the item where ,
The function shows that the item was worth $10,500 two years after it was purchased. Using this model to predict the value outside the given data points is called extrapolationUsing a linear function to estimate values that extend beyond the given data points.. For example, we can use the function to determine the value of the item when :
The model predicts that the piece of equipment will be worth $4,500 ten years after it is purchased.
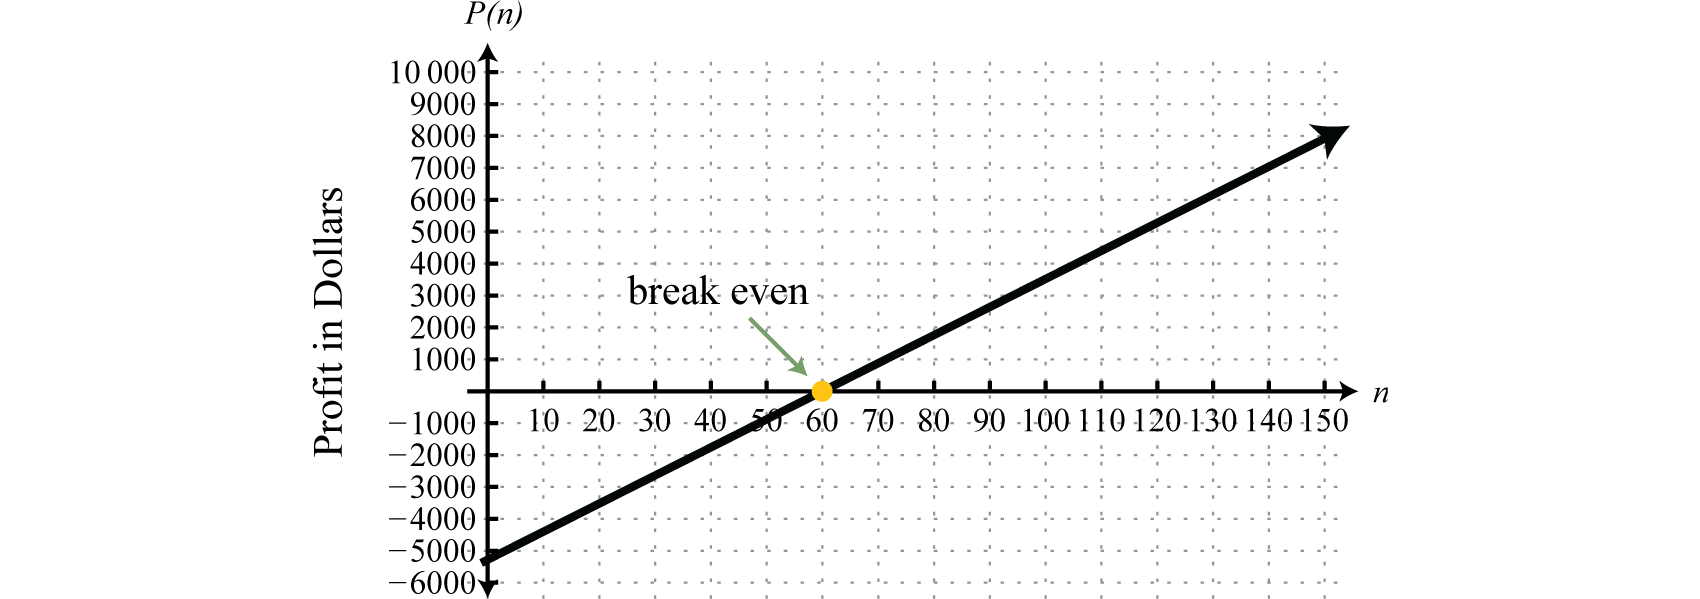
In a business application, revenue results from the sale of a number of items. For example, if an item can be sold for $150 and we let n represent the number of units sold, then we can form the following revenue functionA function that models income based on a number of units sold.:
Use this function to determine the revenue generated from selling units,
The function shows that the revenue generated from selling 100 items is $15,000. Typically, selling items does not represent the entire story. There are a number of costs associated with the generation of revenue. For example, if there is a one-time set up fee of $5,280 and each item cost $62 to produce, then we can form the following cost functionA function that models the cost of producing a number of units.:
Here n represents the number of items produced. Use this function to determine the cost associated with producing units:
The function shows that the cost associated with producing 100 items is $11,480. Profit is revenue less costs:
Therefore, the profit generated by producing and selling 100 items is $3,520. In general, given a revenue function and a cost function , we can form a profit functionA function that models the profit as revenue less cost. by subtracting as follows:
The cost in dollars of producing n items is given by the formula The revenue in dollars is given by , where n represents the number items sold. Write a function that gives the profit generated by producing and selling n items. Use the function to determine how many items must be produced and sold in order to earn a profit of at least $7,000.
Solution:
Obtain the profit function by subtracting the cost function from the revenue function.
Therefore, models the profit. To determine the number of items that must be produced and sold to profit at least $7,000, solve the following:
Round up because the number of units produced and sold must be an integer. To see this, calculate the profit where n is 139 and 140 units.
Answer: 140 or more items must be produced and sold in order to earn a profit of at least $7,000.
Sometimes the costs exceed the revenue, in which case, the profit will be negative. For example, use the profit function of the previous example, , to calculate the profit generated where This indicates that when 50 units are produced and sold the corresponding profit is a loss of $880.
It is often important to determine how many items must be produced and sold to break even. To break even means to neither have a gain nor a loss; in this case, the profit will be equal to zero. To determine the breakeven pointThe point at which profit is neither negative nor positive; profit is equal to zero., set the profit function equal to zero and solve:
Therefore, 60 items must be produced and sold to break even.
Try this! Custom t-shirts can be sold for $6.50 each. In addition to an initial set-up fee of $120, each t-shirt cost $3.50 to produce. a. Write a function that models the revenue and a function that models the cost. b. Determine a function that models the profit and use it to determine the profit from producing and selling 150 t-shirts. c. Calculate the number of t-shirts that must be sold to break even.
Answer: a. Revenue: ; cost: ; b. profit: ; $330 c. 40
Find the linear function f passing through the given points.
and
and
and
and
and
and
and
and
and
and
and
and
Find the equation of the given linear function.
Find the equation of the line:
Parallel to and passing through
Parallel to and passing through
Parallel to and passing through
Parallel to and passing through
Parallel to and passing through
Parallel to and passing through
Parallel to and passing through
Parallel to and passing through
Parallel to and passing through
Parallel to and passing through
Perpendicular to and passing through
Perpendicular to and passing through
Perpendicular to and passing through
Perpendicular to and passing through
Perpendicular to and passing through
Perpendicular to and passing through
Perpendicular to and passing through
Perpendicular to and passing through
Perpendicular to and passing through
Perpendicular to and passing through
Give the equation of the line that coincides with the x-axis.
Give the equation of the line that coincides with the y-axis.
Given any line in standard form, , determine the slope of any perpendicular line.
Given any line in standard form, , determine the slope of any parallel line.
Use algebra to solve the following.
A company wishes to purchase pens stamped with the company logo. In addition to an initial set-up fee of $90, each pen cost $1.35 to produce. Write a function that gives the cost in terms of the number of pens produced. Use the function to determine the cost of producing 500 pens with the company logo stamped on it.
A rental car company charges a daily rate of $42.00 plus $0.51 per mile driven. Write a function that gives the cost of renting the car for a day in terms of the number of miles driven. Use the function to determine the cost of renting the car for a day and driving it 76 miles.
A certain cellular phone plan charges $16 per month and $0.15 per minute of usage. Write a function that gives the cost of the phone per month based on the number of minutes of usage. Use the function to determine the number of minutes of usage if the bill for the first month was $46.
A web-services company charges $2.50 a month plus $0.14 per gigabyte of storage on their system. Write a function that gives the cost of storage per month in terms of the number of gigabytes stored. How many gigabytes are stored if the bill for this month was $6.00?
Mary has been keeping track of her cellular phone bills for the last two months. The bill for the first month was $45.00 for 150 minutes of usage. The bill for the second month was $25.00 for 50 minutes of usage. Find a linear function that gives the total monthly bill based on the minutes of usage.
A company in its first year of business produced 1,200 brochures for a total cost of $5,050. The following year, the company produced 500 more brochures at a cost of $2,250. Use this information to find a linear function that gives the total cost of producing brochures from the number of brochures produced.
A Webmaster has noticed that the number of registered users has been steadily increasing since beginning an advertising campaign. Before starting to advertise, he had 2,200 registered users, and after 4 months of advertising he now has 5,480 registered users. Use this data to write a linear function that gives the total number of registered users, given the number of months after starting to advertise. Use the function to predict the number of users 8 months into the advertising campaign.
A corn farmer in California was able to produce 154 bushels of corn per acre 2 years after starting his operation. Currently, after 7 years of operation, he has increased his yield to 164 bushels per acre. Use this information to write a linear function that gives the total yield per acre based on the number of years of operation, and use it to predict the yield for next year.
A commercial van was purchased new for $22,500 and is expected to be worthless in 12 years. Use this information to write a linear depreciation function for the value of the van. Use the function to determine the value of the van after 8 years of use.
The average lifespan of an industrial welding robot is 10 years, after which it is considered to have no value. If an industrial welding robot was purchased new for $58,000, write a function that gives the value of the robot in terms of the number of years of operation. Use the function to value the robot after 3 years of operation.
A business purchased a piece of equipment new for $2,400. After 5 years of use the equipment is valued at $1,650. Find a linear function that gives the value of the equipment in terms of years of usage. Use the function to determine the number of years after which the piece of equipment will have no value.
A salesman earns a base salary of $2,400 a month plus a 5% commission on all sales. Write a function that gives the salesman’s monthly salary in terms of sales. Use the function to determine the monthly sales required to earn at least $3,600 a month.
When a certain professor was hired in 2005, the enrollment at a college was 8,500 students. Five years later, in 2010, the enrollment grew to 11,200 students. Determine a linear growth function that models the student population in years since 2005. Use the model to predict the year in which enrollment will exceed 13,000 students.
In 1980, the population of California was about 24 million people. Twenty years later, in the year 2000, the population was about 34 million. Use this data to construct a linear function to model the population growth in years since 1980. Use the function to predict the year in which the population will reach 40 million.
A classic car is purchased for $24,500 and is expected to increase in value each year by $672. Write a linear function that models the appreciation of the car in terms of the number of years after purchase. Use the function to predict the value of the car in 7 years.
A company reported first and second quarter sales of $52,000 and $64,500, respectively.
A particular search engine assigns a ranking to a webpage based on the number of links that direct users to the webpage. If no links are found, the webpage is assigned a ranking of 1. If 20 links are found directing users to the webpage, the search engine assigns a page ranking of 3.5. a. Find a linear function that gives the webpage ranking based on the number of links that direct users to it. b. How many links will be needed to obtain a page ranking of 5?
Online sales of a particular product are related to the number of clicks on its advertisement. It was found that 1,520 clicks in a month results in $2,748 of online sales, and that 1,840 clicks results in $2,956 of online sales. Write a linear function that models the online sales of the product based on the number of clicks on its advertisement. How many clicks would we need to expect $3,385 in monthly online sales from this particular product?
A bicycle manufacturing business can produce x bicycles at a cost, in dollars, given by the formula The company sells each bicycle at a wholesale price of $145. The revenue, in dollars, is given by , where x represents the number of bicycles sold. Write a function that gives profit in terms of the number of bicycles produced and sold. Use the function to determine the number of bicycles that need to be produced and sold to break even.
The cost, in dollars, of producing n custom lamps is given by the formula Each lamp can be sold online for $79. The revenue in dollars, is given by , where n represents the number of lamps sold. Write a function that gives the profit from producing and selling n custom lamps. Use the function to determine how many lamps must be produced and sold to earn at least $1,000 in profit.
A manufacturer can produce a board game at a cost of $12 per unit after an initial fixed retooling investment of $12,500. The games can be sold for $22 each to retailers.
A vending machine can be leased at a cost of $90 per month. The items used to stock the machine can be purchased for $0.50 each and sold for $1.25 each.
Research and discuss linear depreciation. In a linear depreciation model, what do the slope and y-intercept represent?
Write down your own steps for finding the equation of a line. Post your steps on the discussion board.
; $765
; 200 minutes
; 8,760 users
; $7,500
; 16 years
; 2013
; $29,204
; 40 bicycles
Answer may vary
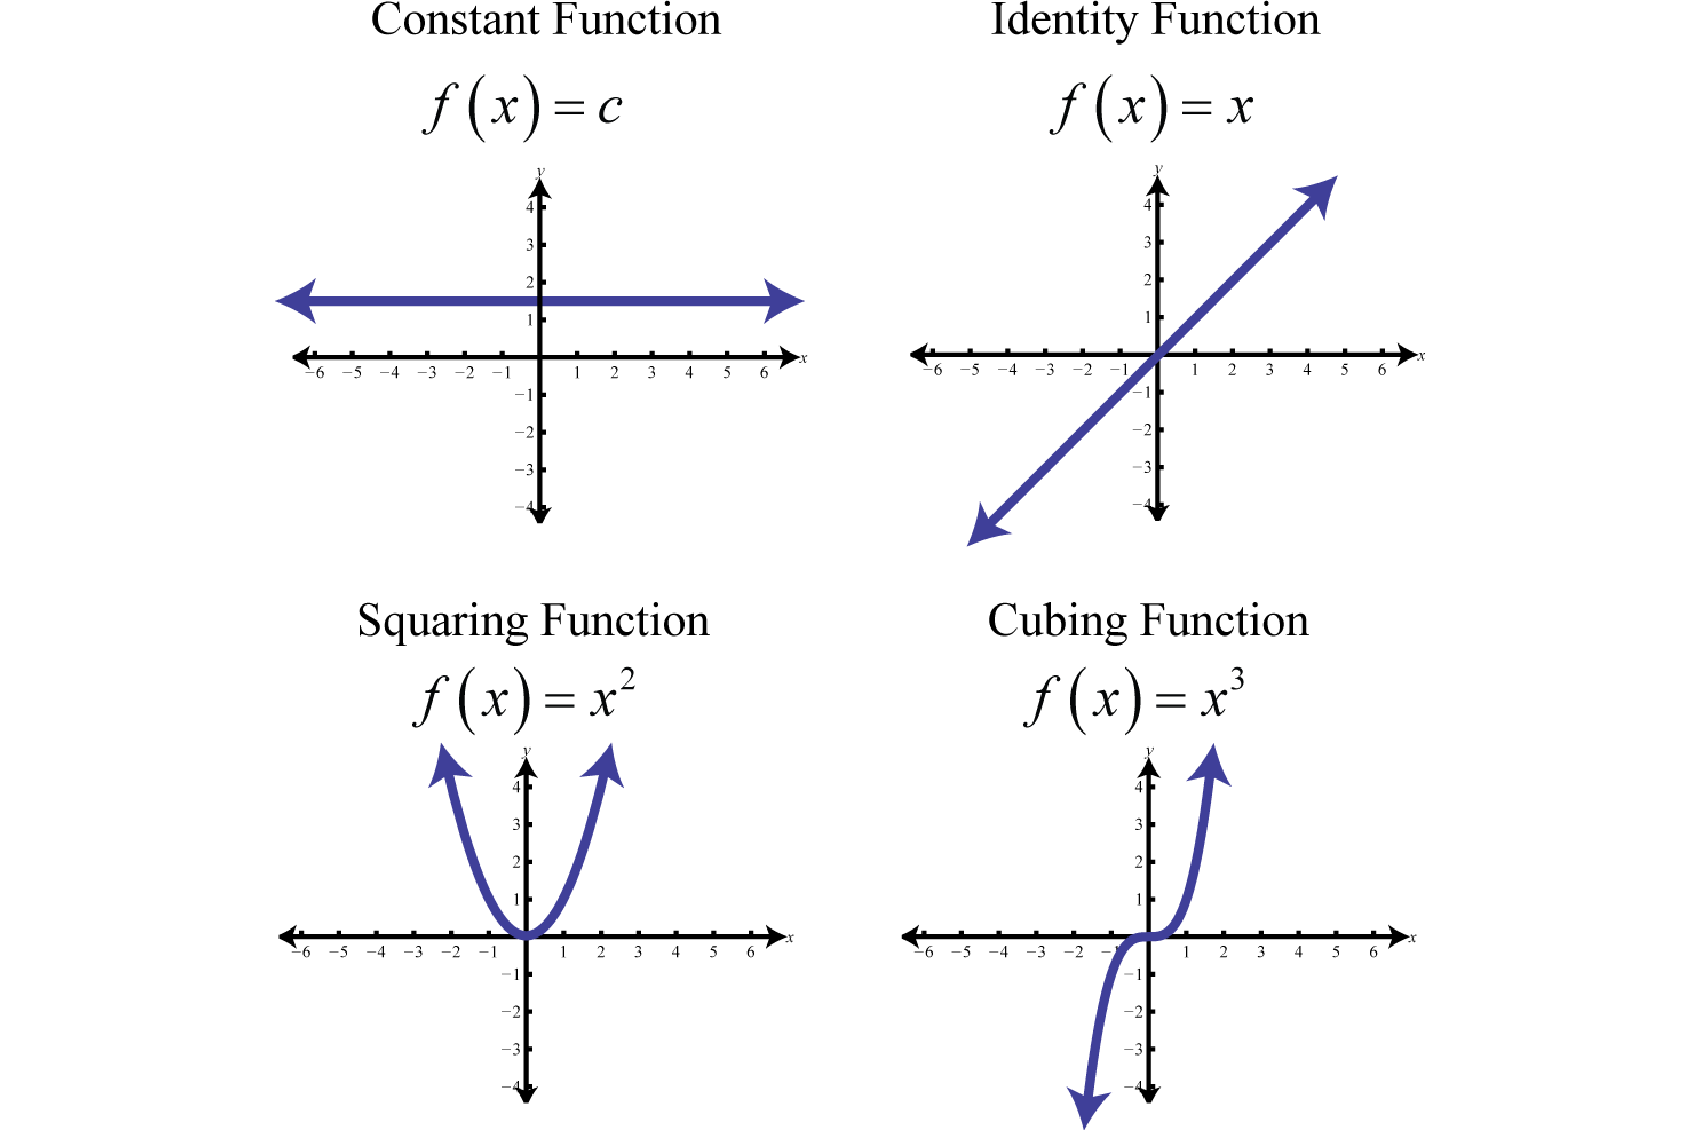
In this section we graph seven basic functions that will be used throughout this course. Each function is graphed by plotting points. Remember that and thus and y can be used interchangeably.
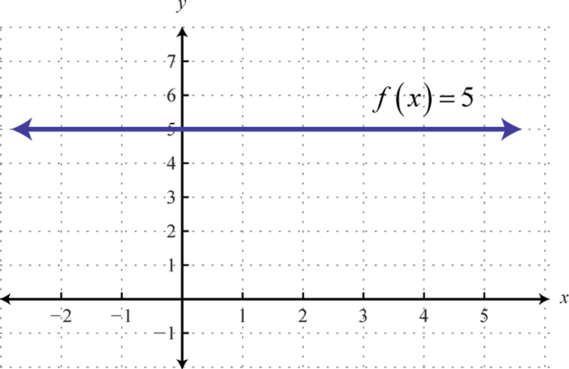
Any function of the form , where c is any real number, is called a constant functionAny function of the form where c is a real number.. Constant functions are linear and can be written In this form, it is clear that the slope is 0 and the y-intercept is Evaluating any value for x, such as x = 2, will result in c.
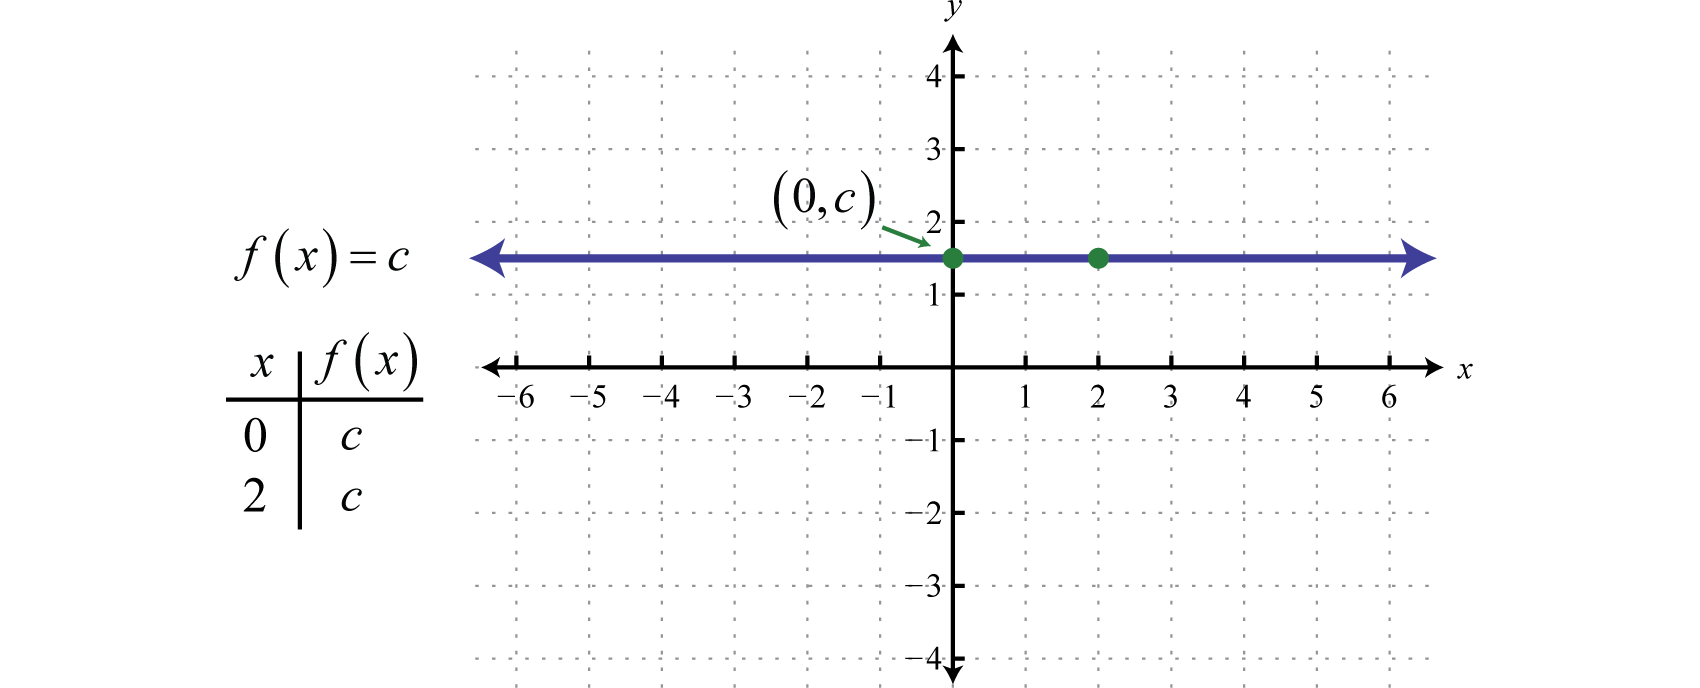
The graph of a constant function is a horizontal line. The domain consists of all real numbers and the range consists of the single value {c}.
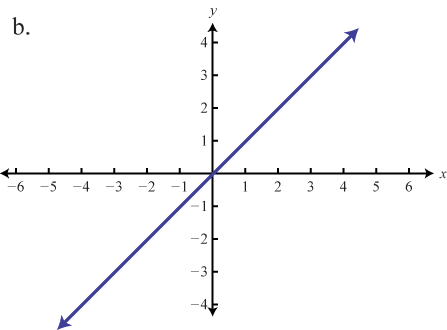
We next define the identity functionThe linear function defined by Evaluating any value for x will result in that same value. For example, and The identity function is linear, , with slope and y-intercept (0, 0).
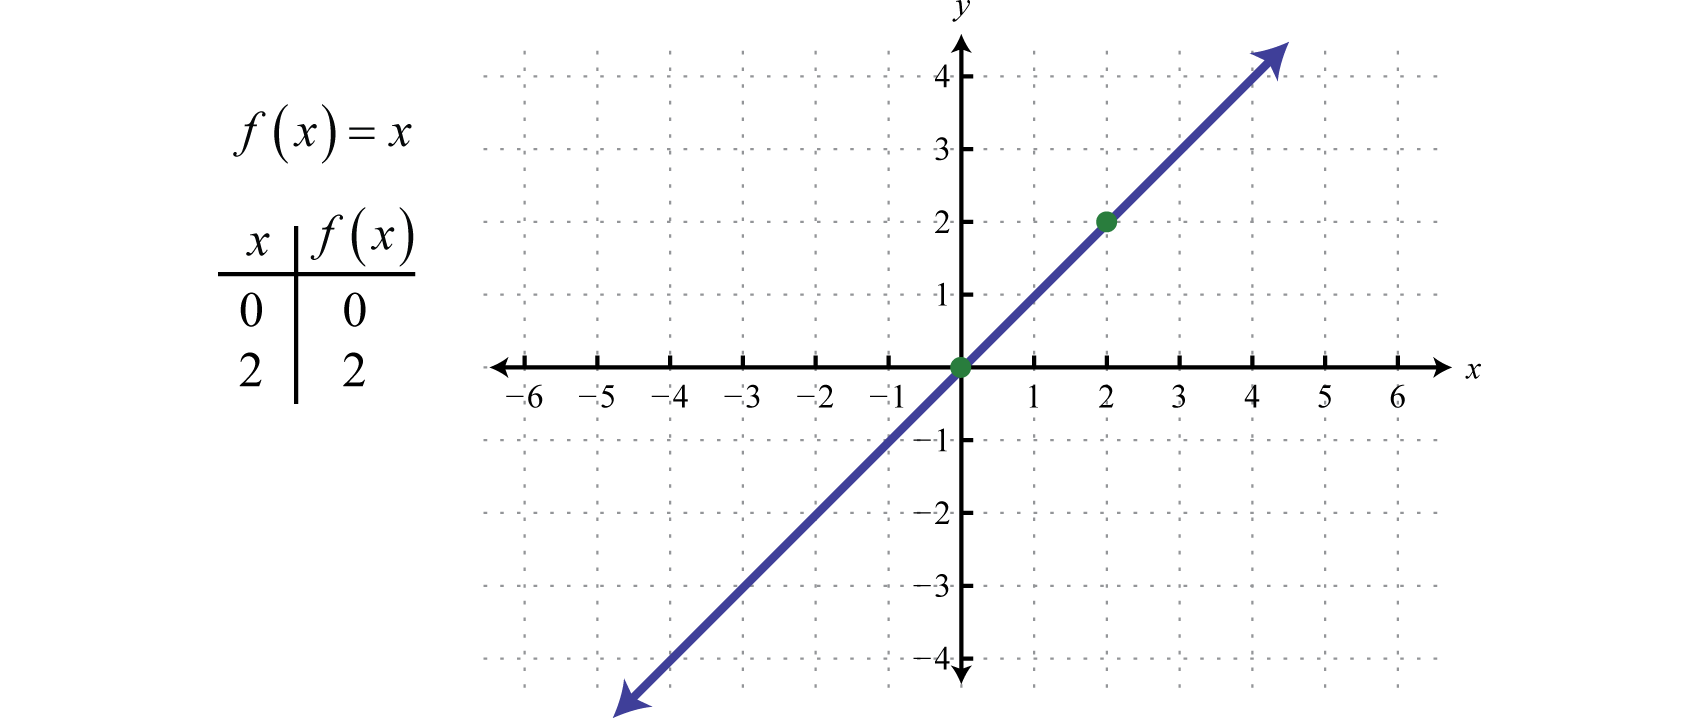
The domain and range both consist of all real numbers.
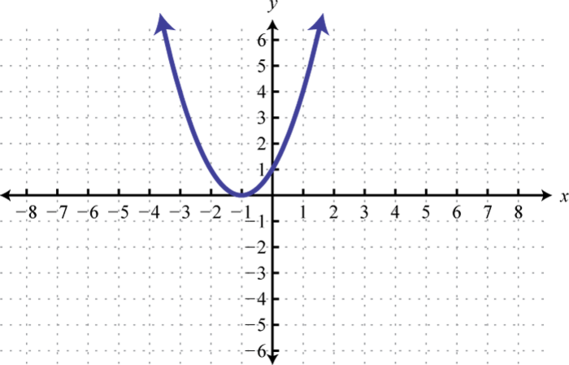
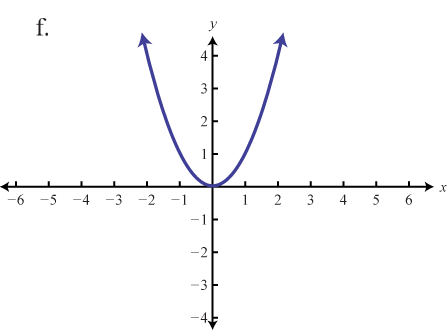
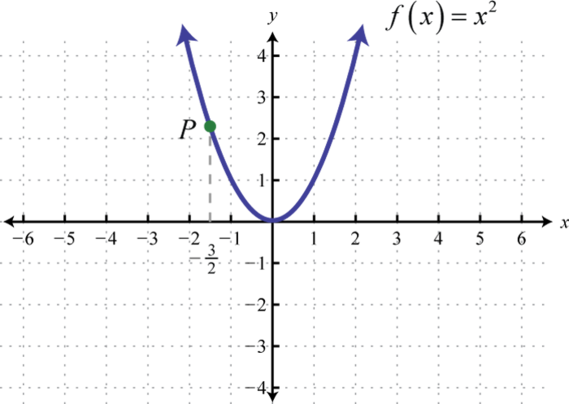
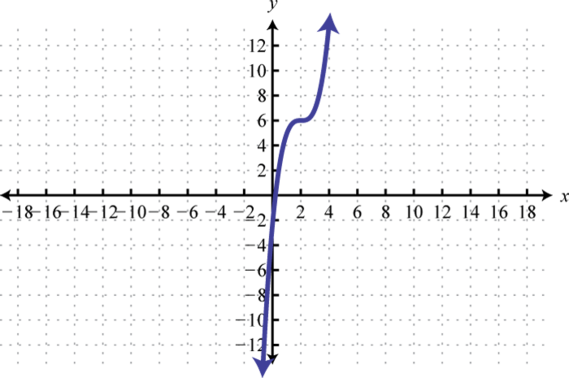
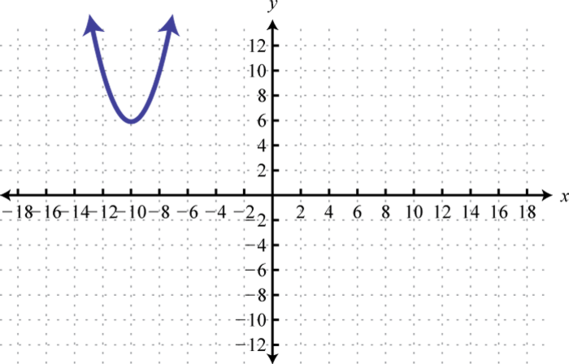
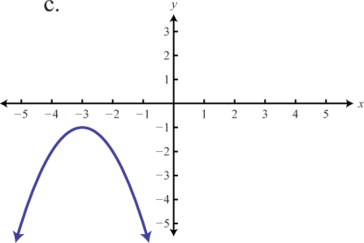
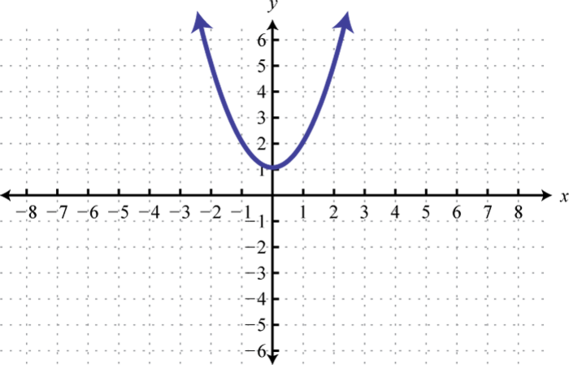
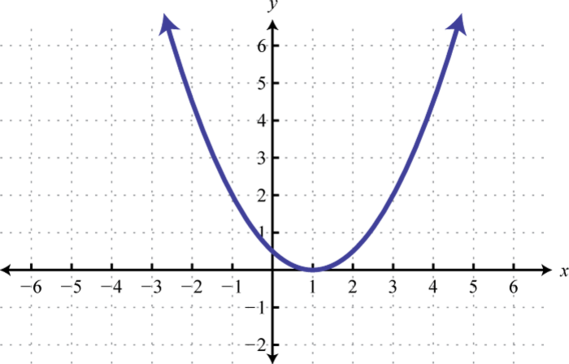
The squaring functionThe quadratic function defined by , defined by , is the function obtained by squaring the values in the domain. For example, and The result of squaring nonzero values in the domain will always be positive.
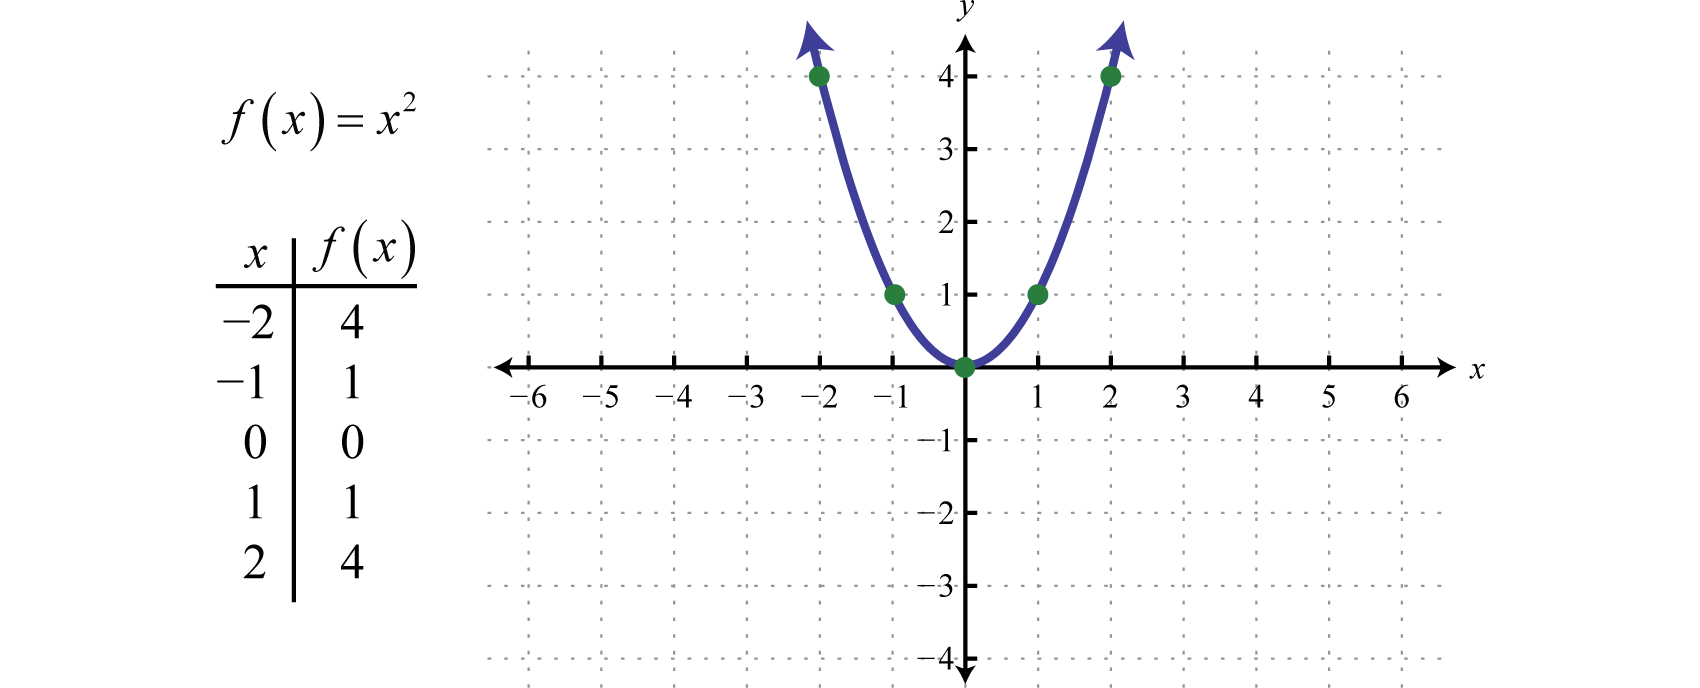
The resulting curved graph is called a parabolaThe curved graph formed by the squaring function.. The domain consists of all real numbers and the range consists of all y-values greater than or equal to zero
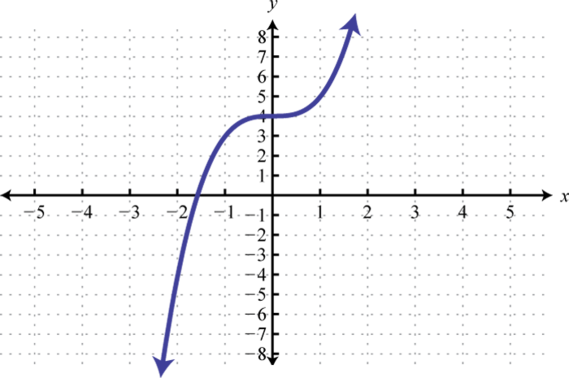
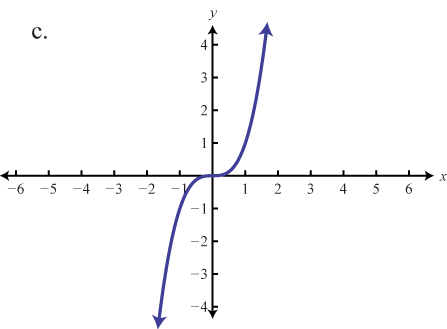
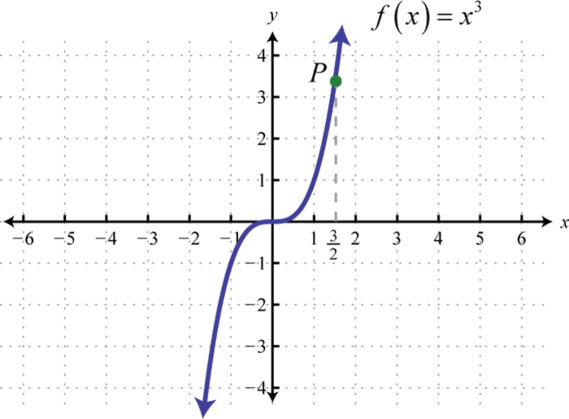
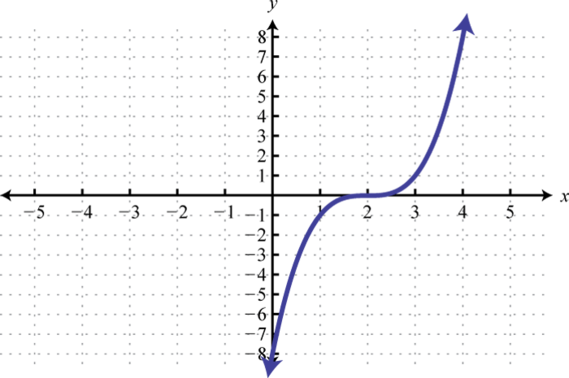
The cubing functionThe cubic function defined by , defined by , raises all of the values in the domain to the third power. The results can be either positive, zero, or negative. For example, , , and
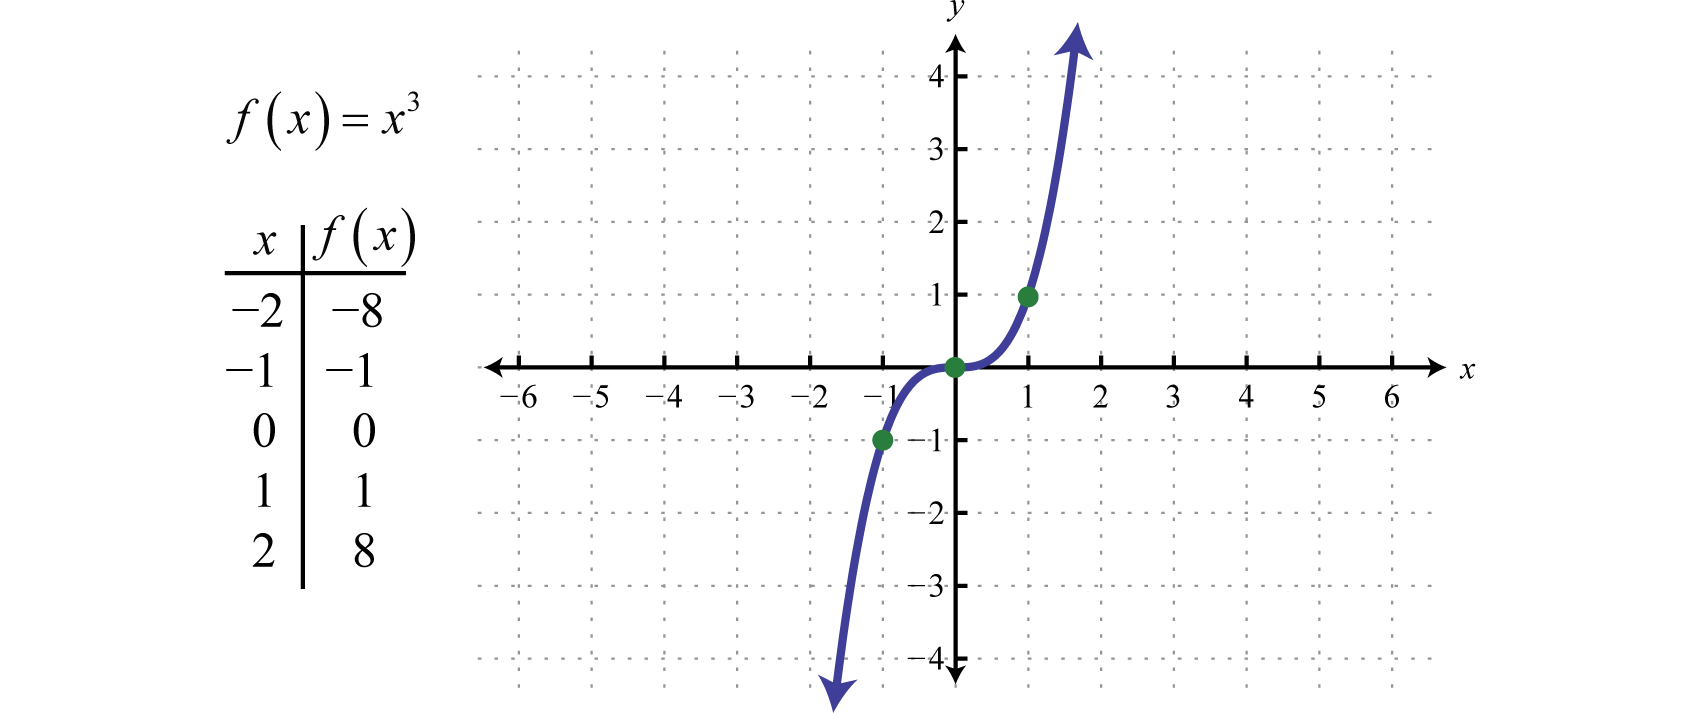
The domain and range both consist of all real numbers
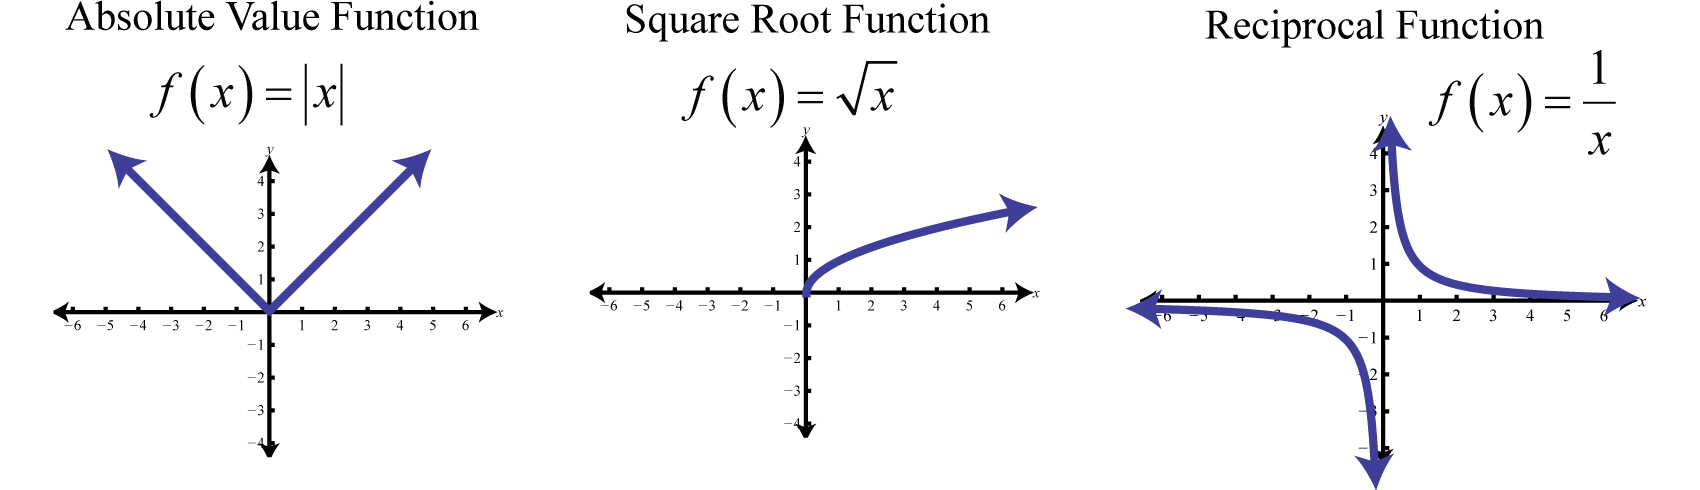
Note that the constant, identity, squaring, and cubing functions are all examples of basic polynomial functions. The next three basic functions are not polynomials.
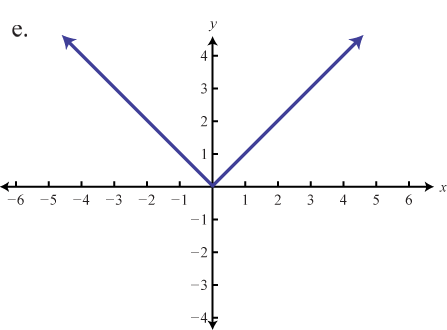
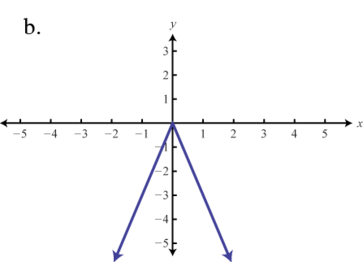
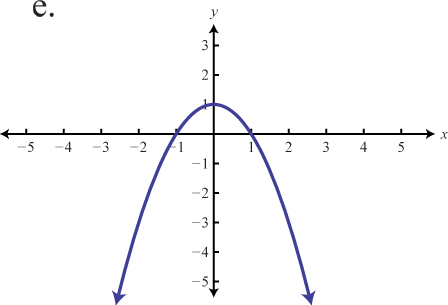
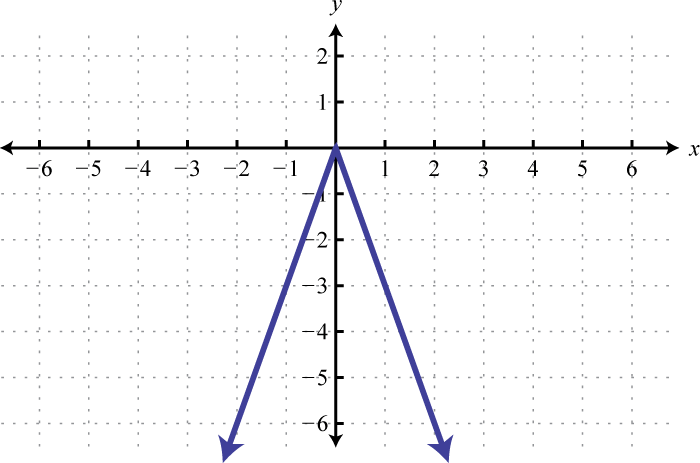
The absolute value functionThe function defined by , defined by , is a function where the output represents the distance to the origin on a number line. The result of evaluating the absolute value function for any nonzero value of x will always be positive. For example, and
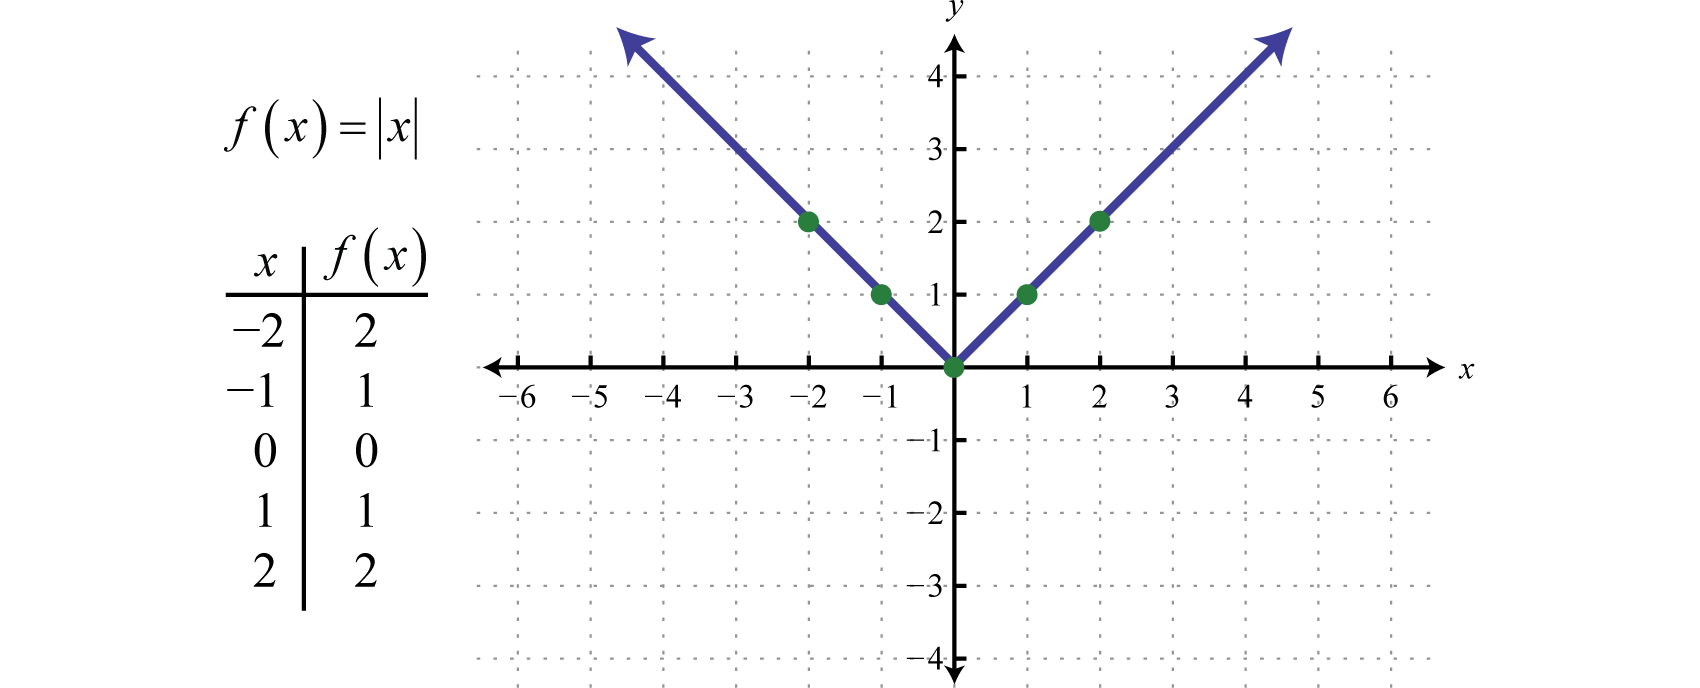
The domain of the absolute value function consists of all real numbers and the range consists of all y-values greater than or equal to zero
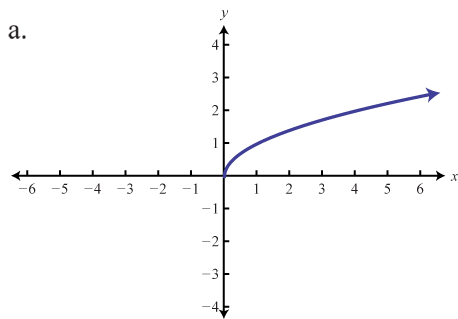
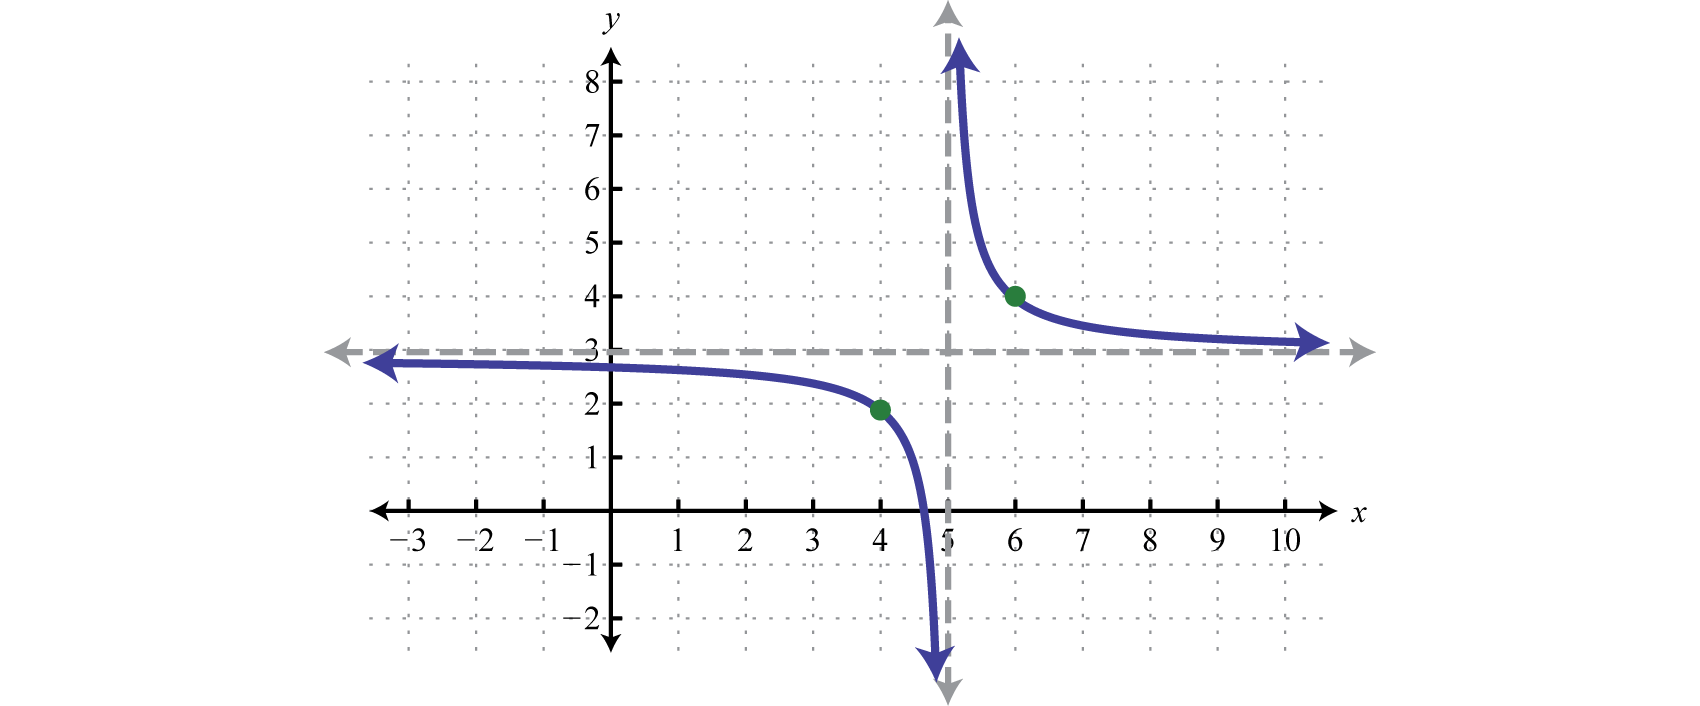
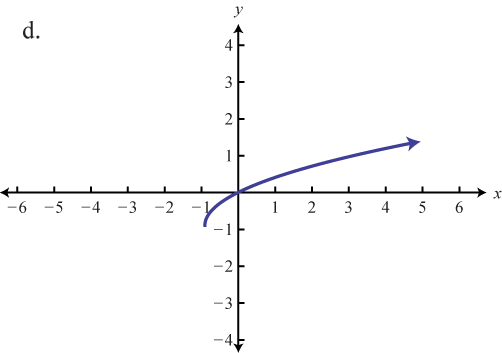
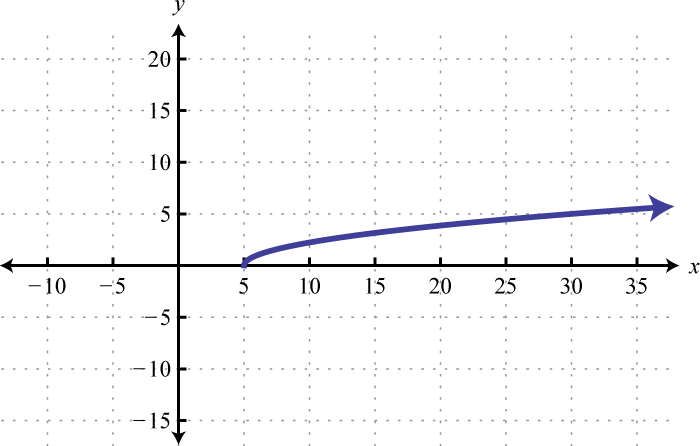
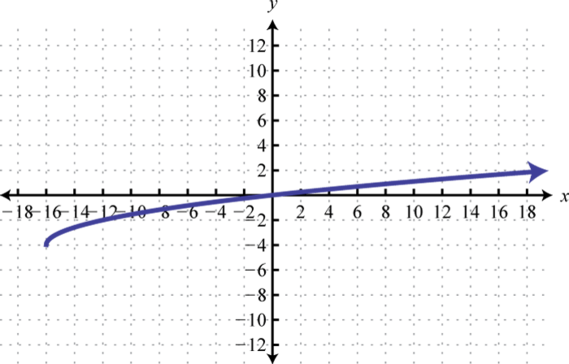
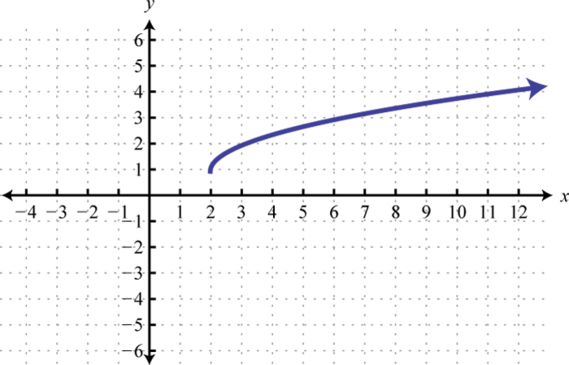
The square root functionThe function defined by , defined by , is not defined to be a real number if the x-values are negative. Therefore, the smallest value in the domain is zero. For example, and
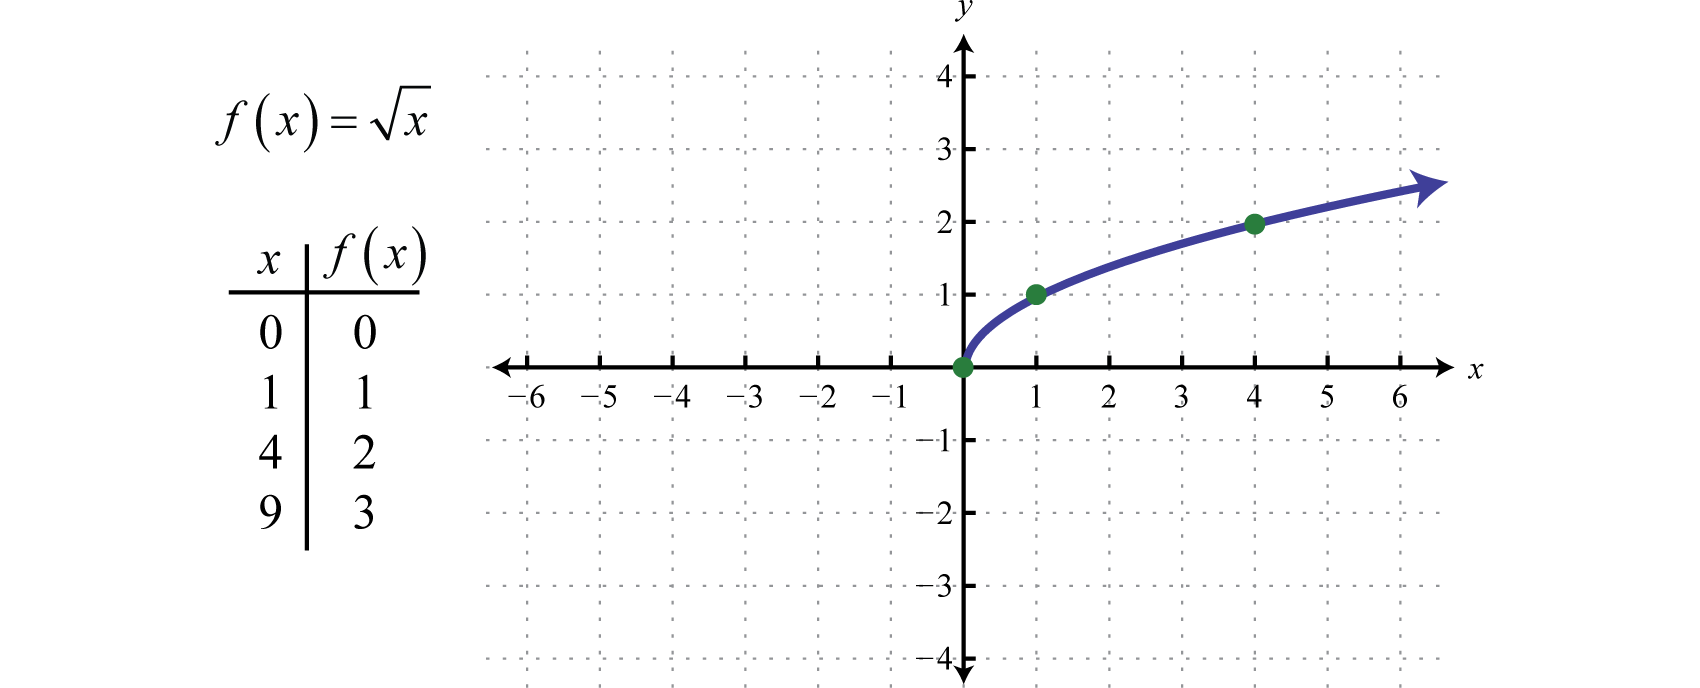
The domain and range both consist of real numbers greater than or equal to zero
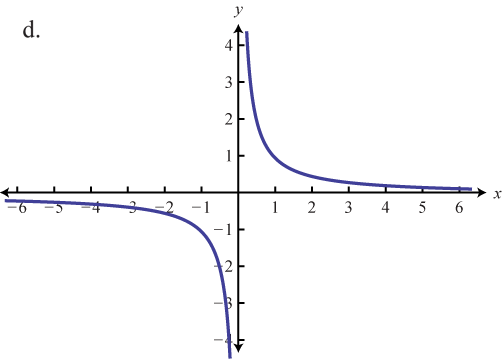
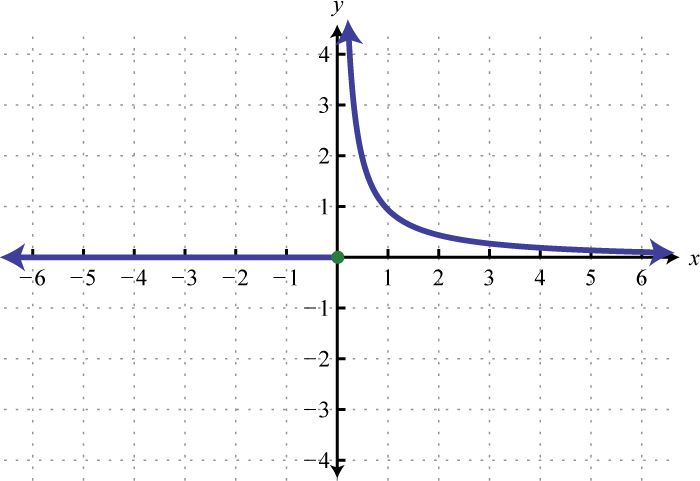
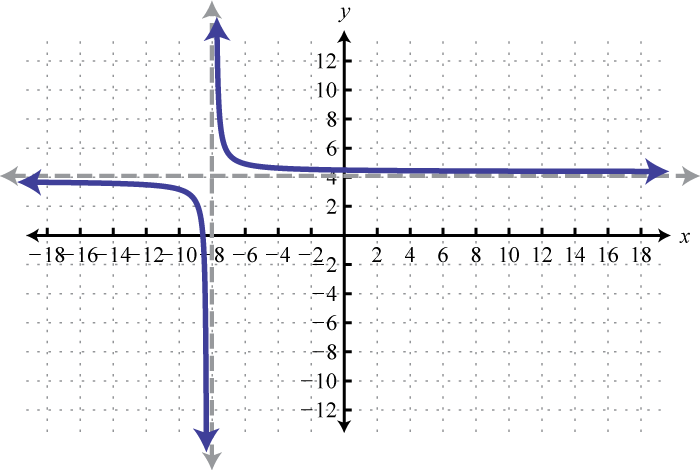
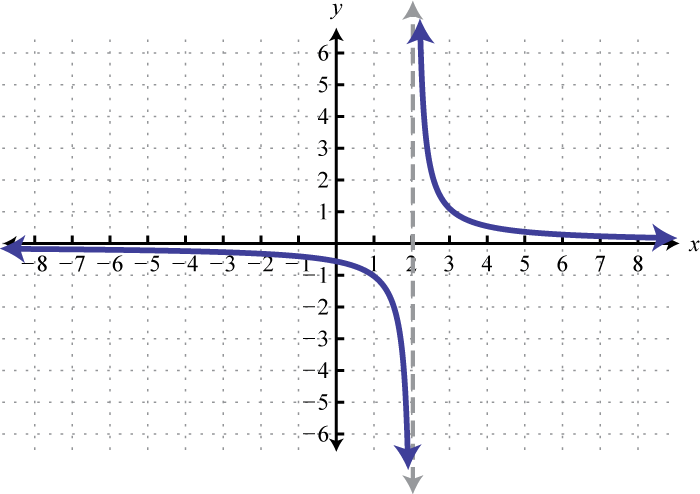
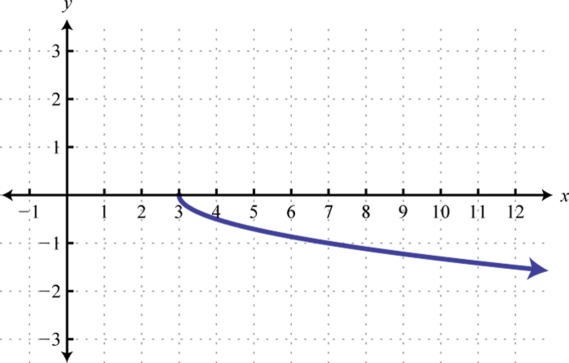
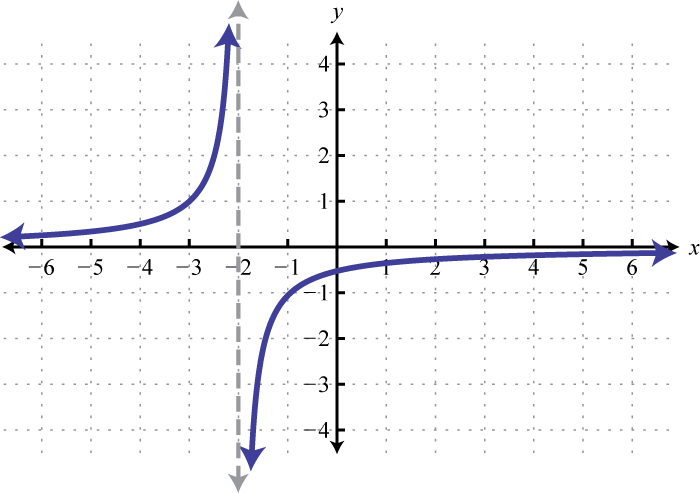
The reciprocal functionThe function defined by , defined by , is a rational function with one restriction on the domain, namely The reciprocal of an x-value very close to zero is very large. For example,
In other words, as the x-values approach zero their reciprocals will tend toward either positive or negative infinity. This describes a vertical asymptoteA vertical line to which a graph becomes infinitely close. at the y-axis. Furthermore, where the x-values are very large the result of the reciprocal function is very small.
In other words, as the x-values become very large the resulting y-values tend toward zero. This describes a horizontal asymptoteA horizontal line to which a graph becomes infinitely close where the x-values tend toward ±∞. at the x-axis. After plotting a number of points the general shape of the reciprocal function can be determined.
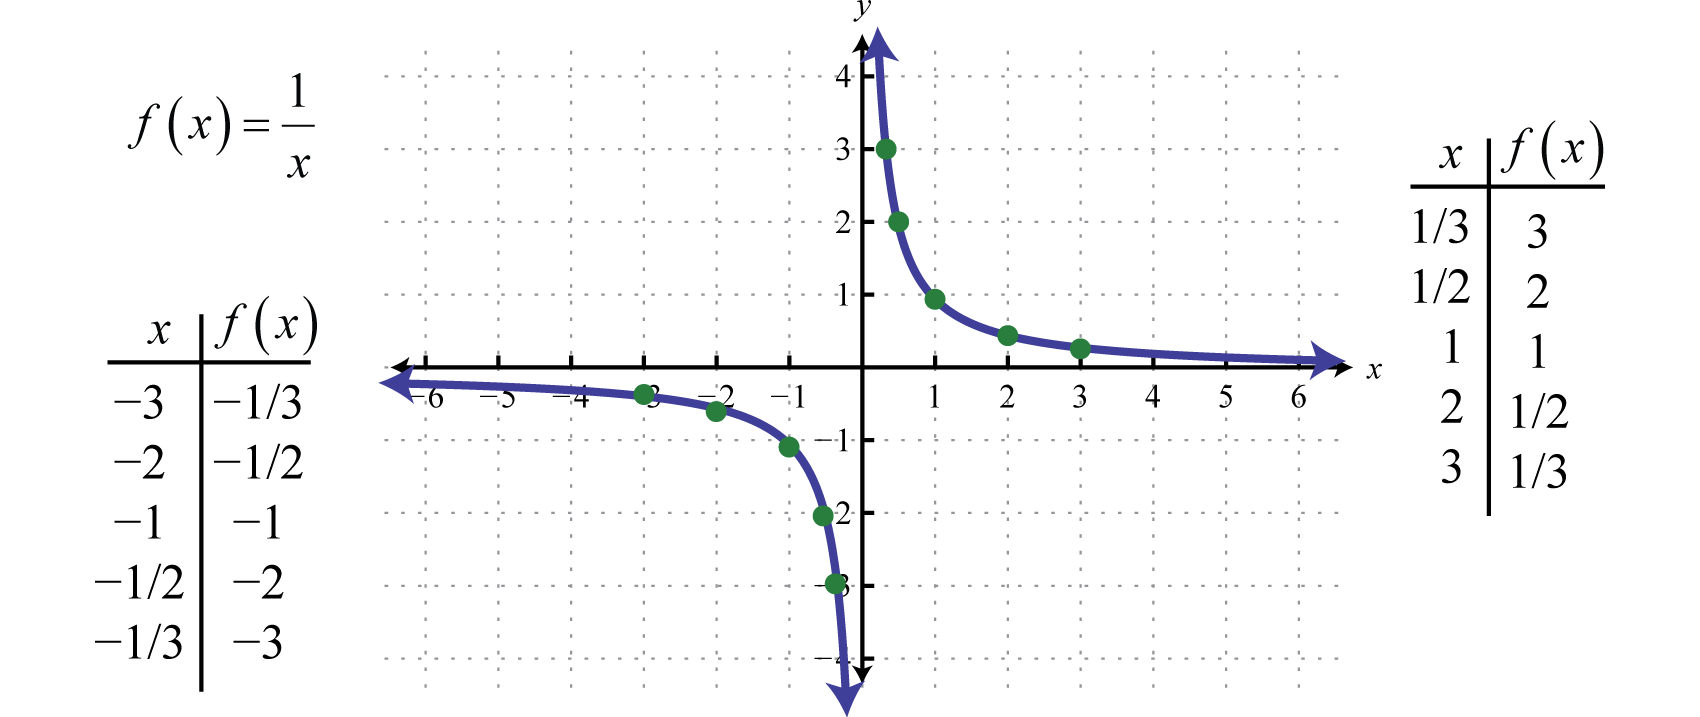
Both the domain and range of the reciprocal function consists of all real numbers except 0, which can be expressed using interval notation as follows:
In summary, the basic polynomial functions are:
The basic nonpolynomial functions are:
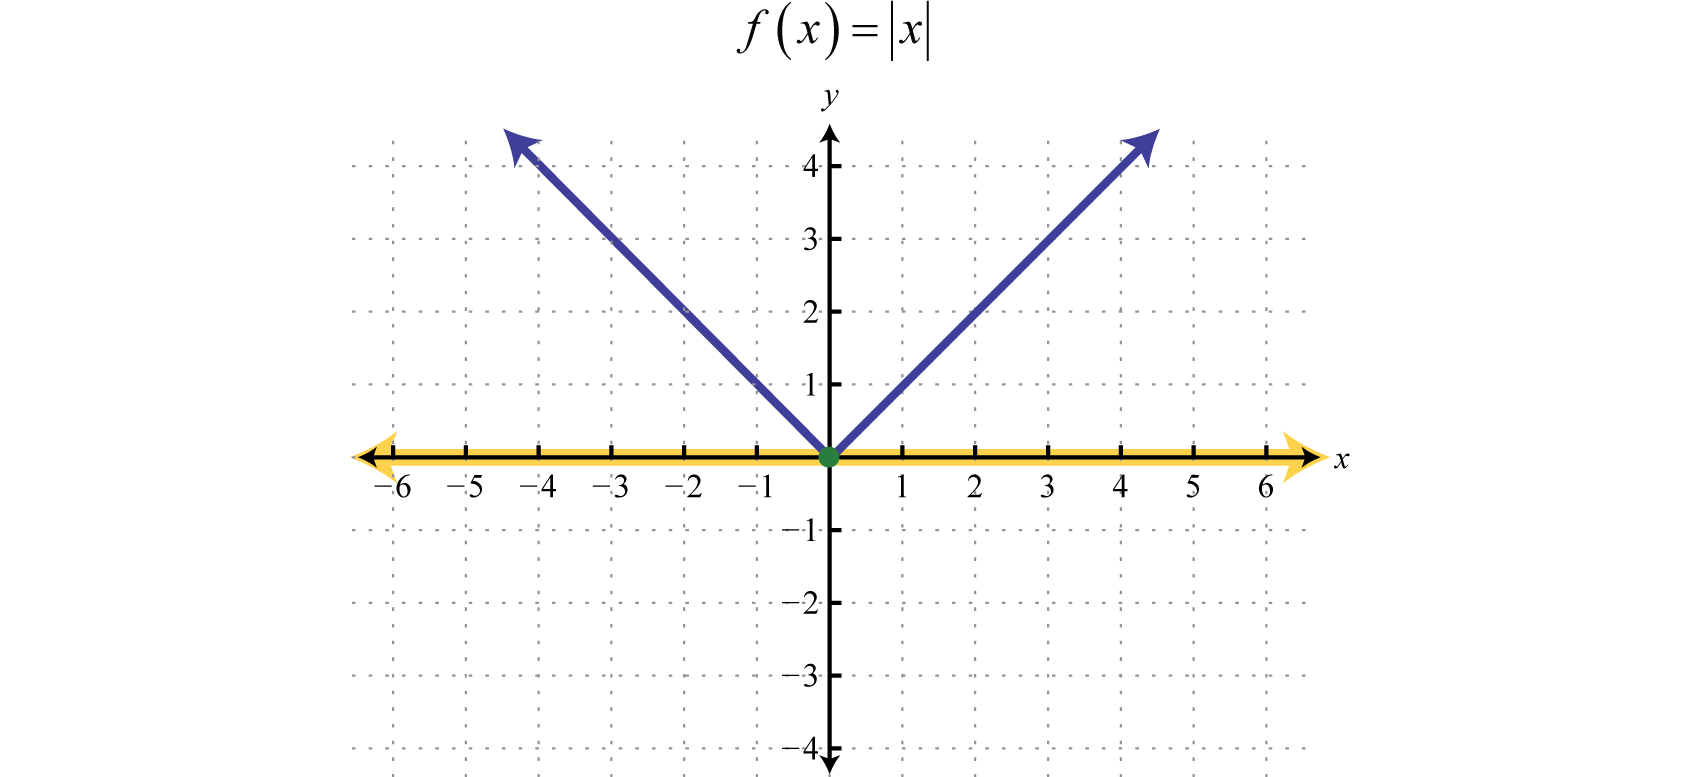
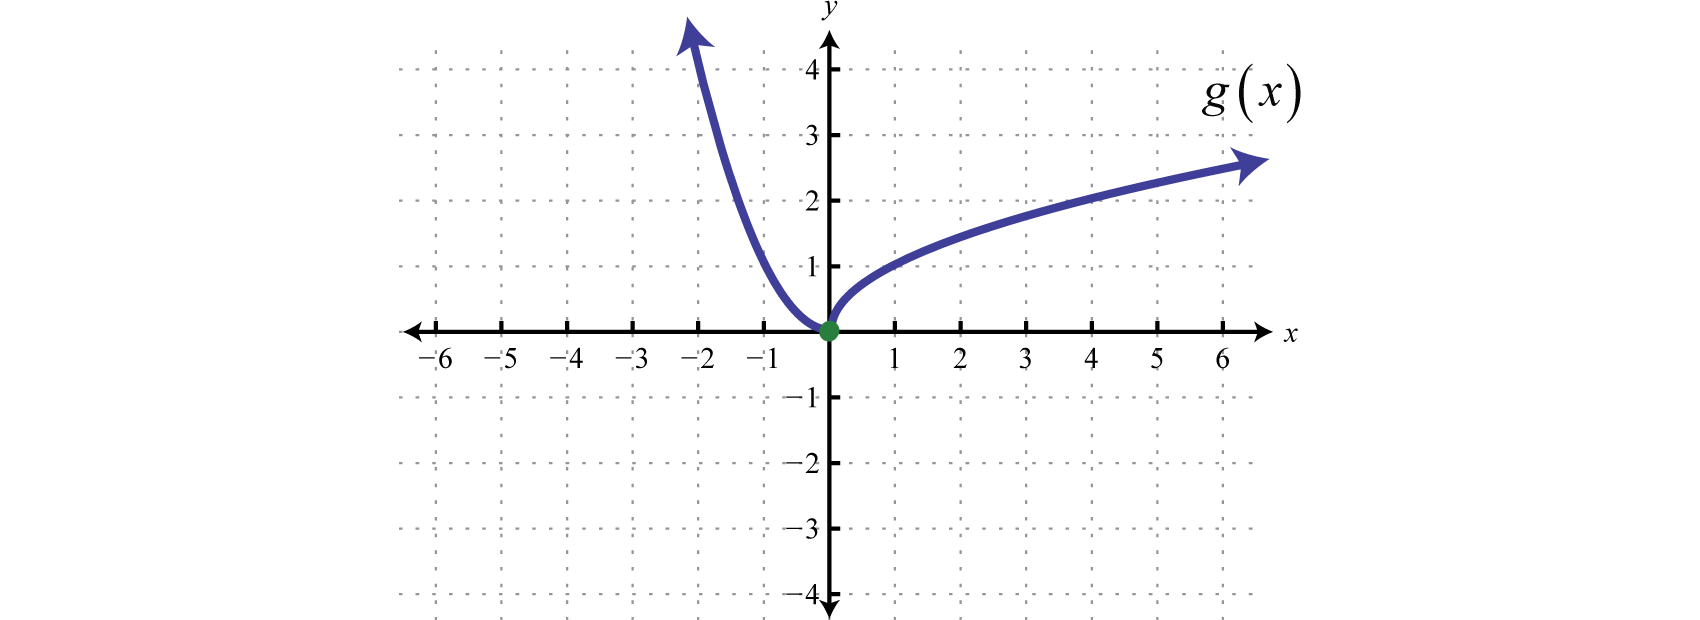
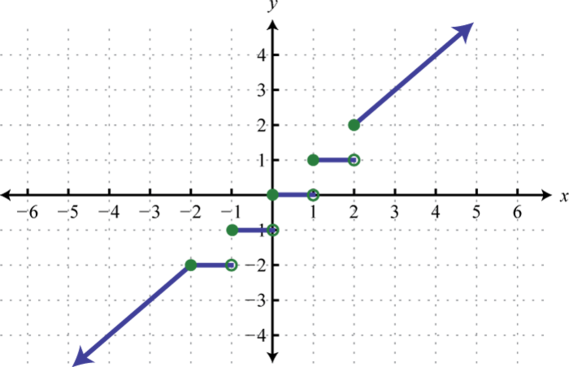
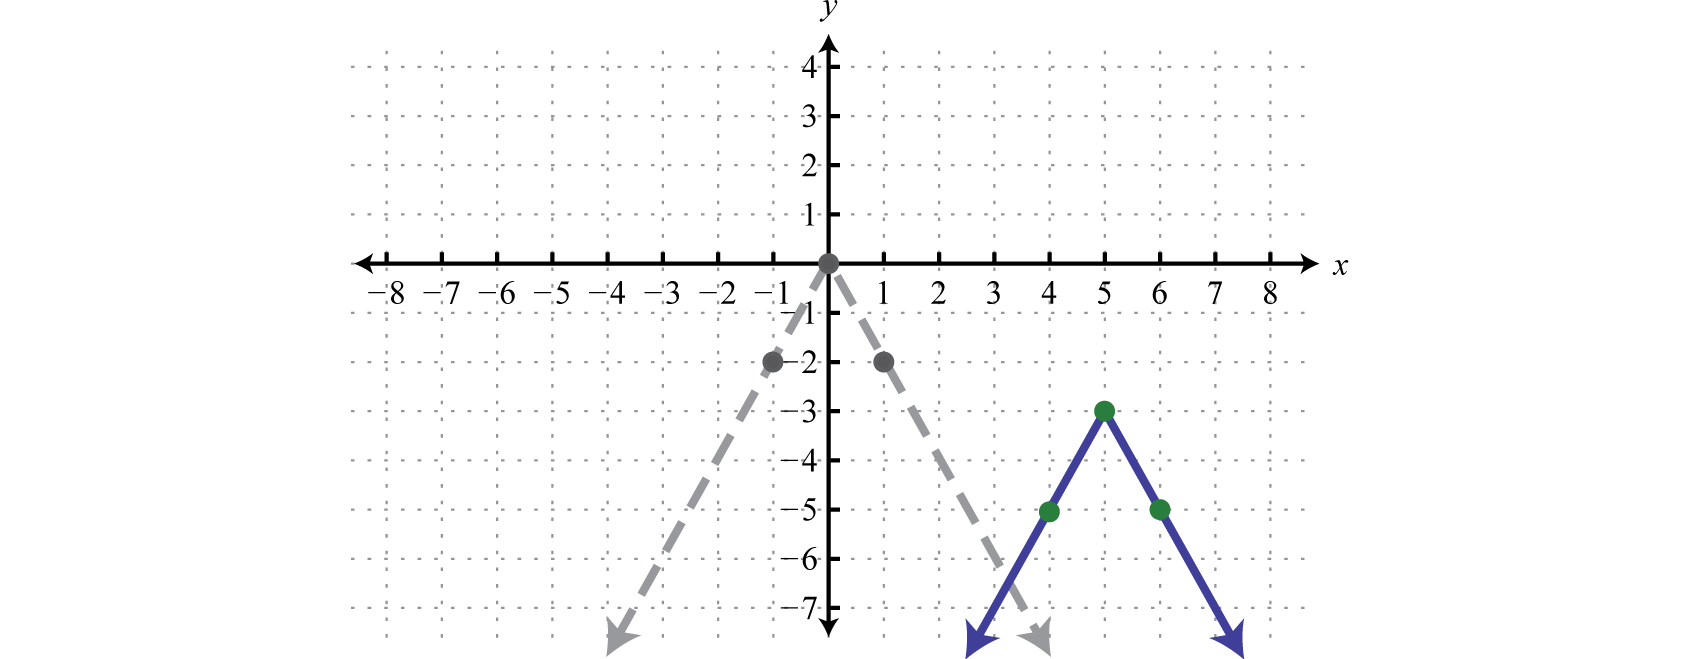
A piecewise functionA function whose definition changes depending on the values in the domain., or split functionA term used when referring to a piecewise function., is a function whose definition changes depending on the value in the domain. For example, we can write the absolute value function as a piecewise function:
In this case, the definition used depends on the sign of the x-value. If the x-value is positive, , then the function is defined by And if the x-value is negative, , then the function is defined by
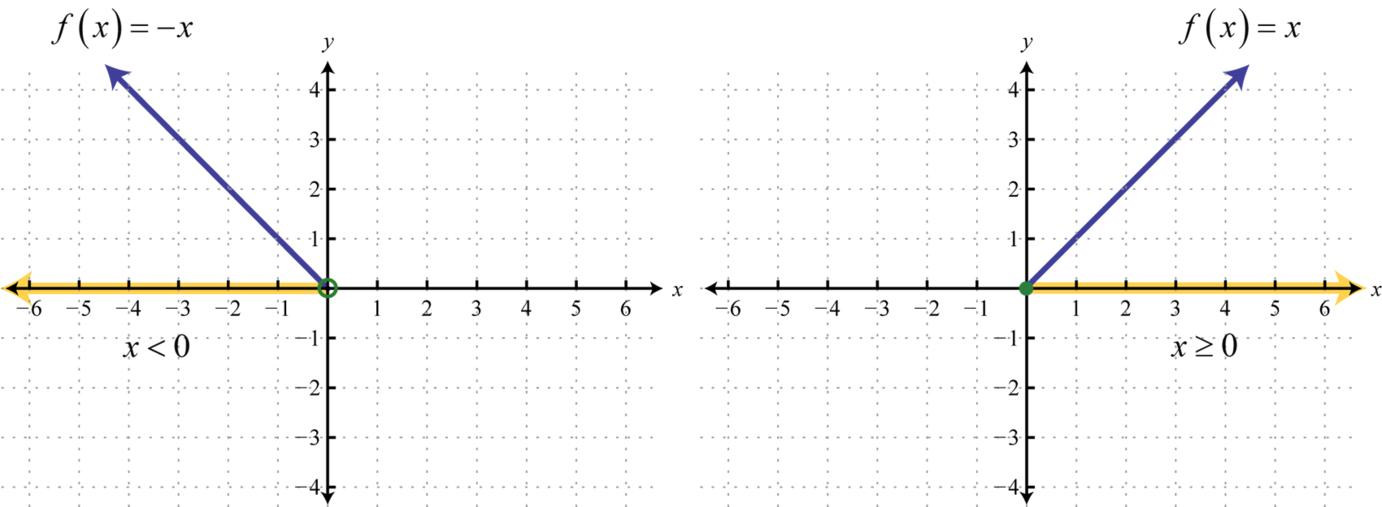
Following is the graph of the two pieces on the same rectangular coordinate plane:
Graph:
Solution:
In this case, we graph the squaring function over negative x-values and the square root function over positive x-values.
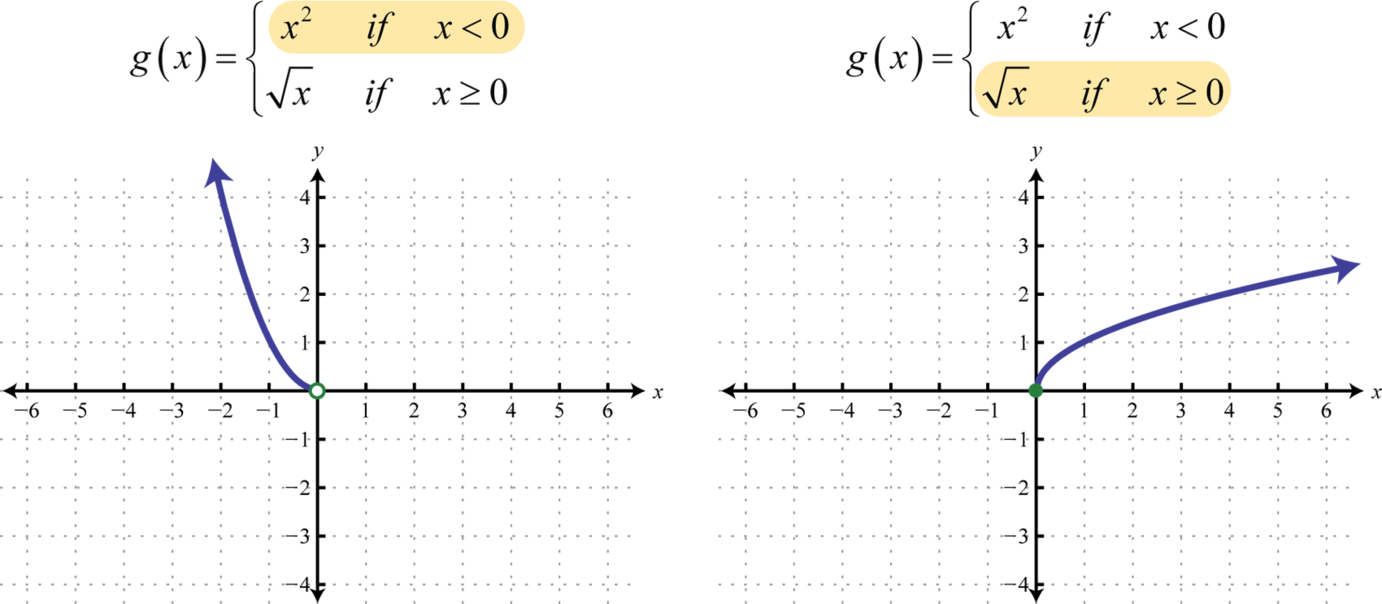
Notice the open dot used at the origin for the squaring function and the closed dot used for the square root function. This was determined by the inequality that defines the domain of each piece of the function. The entire function consists of each piece graphed on the same coordinate plane.
Answer:
When evaluating, the value in the domain determines the appropriate definition to use.
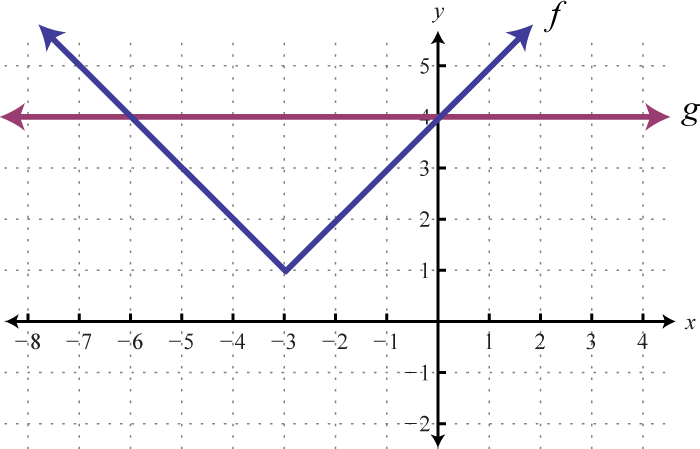
Given the function , find , , and
Solution:
Use where t is negative, as indicated by
Where t is greater than or equal to zero, use
Answer: , , and
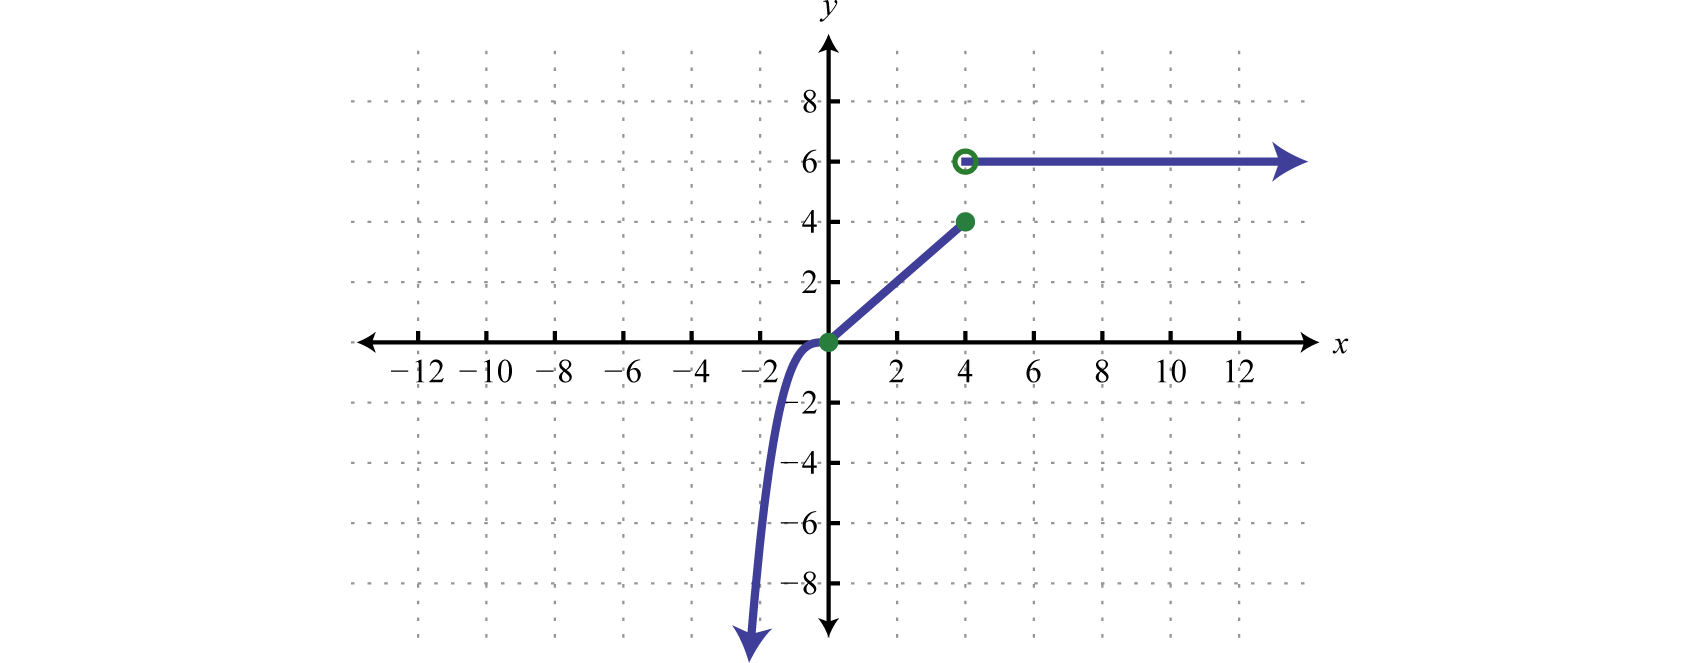
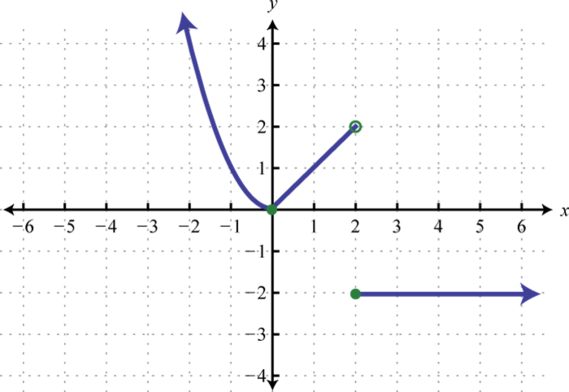
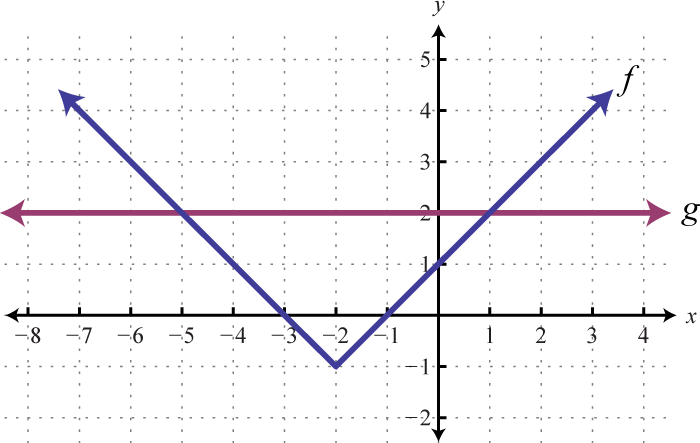
The definition of a function may be different over multiple intervals in the domain.
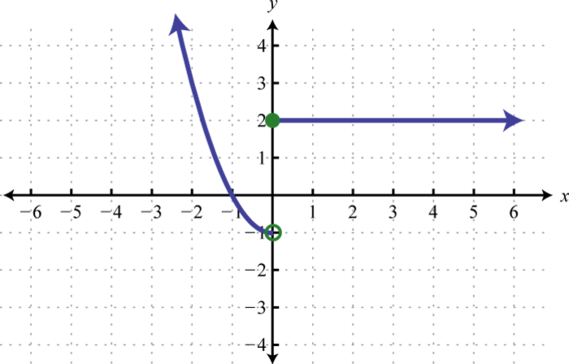
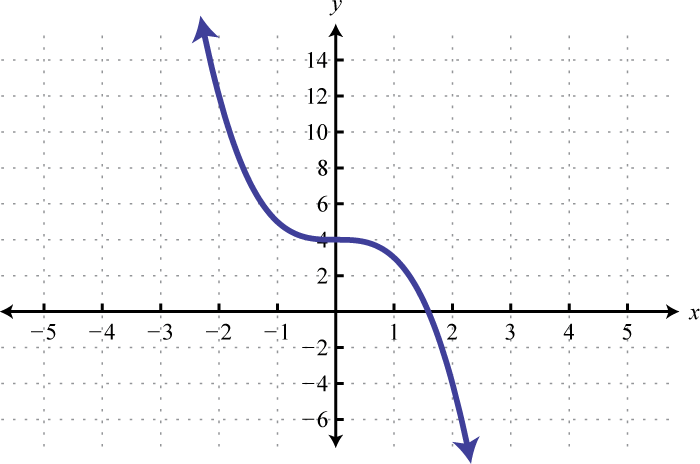
Graph:
Solution:
In this case, graph the cubing function over the interval Graph the identity function over the interval Finally, graph the constant function over the interval And because where , we use an open dot at the point Where , we use and thus is a point on the graph as indicated by a closed dot.
Answer:
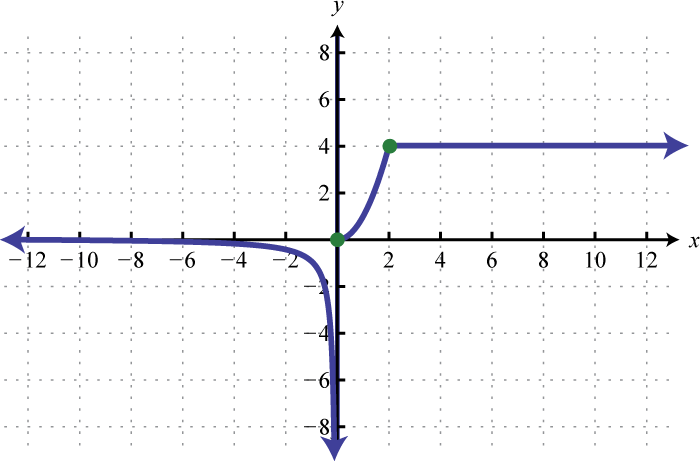
The greatest integer functionThe function that assigns any real number x to the greatest integer less than or equal to x denoted ., denoted , assigns the greatest integer less than or equal to any real number in its domain. For example,
This function associates any real number with the greatest integer less than or equal to it and should not be confused with rounding off.
Graph: .
Solution:
If x is any real number, then is the greatest integer less than or equal to x.
Using this, we obtain the following graph.
Answer:
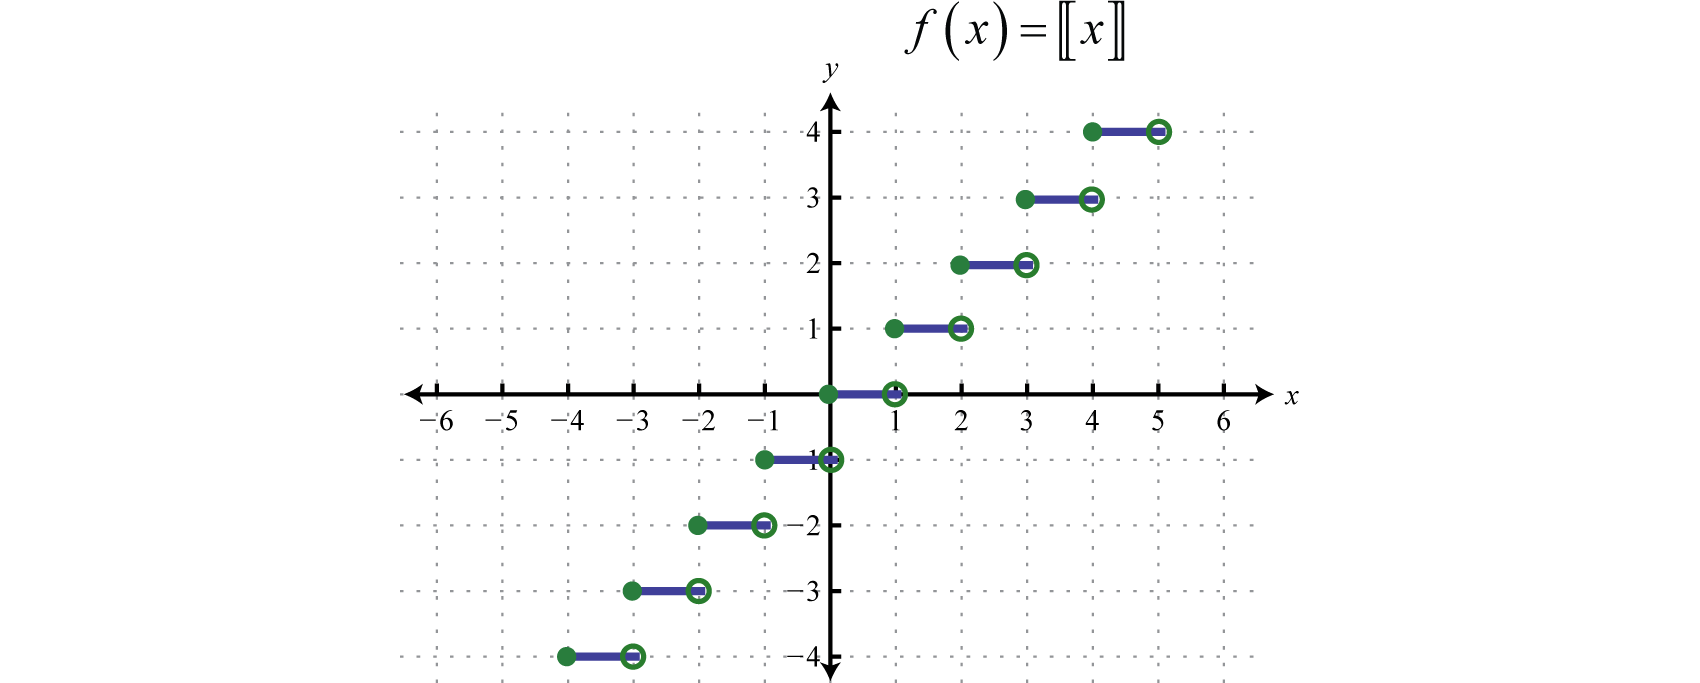
The domain of the greatest integer function consists of all real numbers and the range consists of the set of integers This function is often called the floor functionA term used when referring to the greatest integer function. and has many applications in computer science.
Match the graph to the function definition.
Evaluate.
; find , , and
; find , , and
; find , , and
; find , , and
; find , , and where
; find , , and where
; find , , and
; find , , and
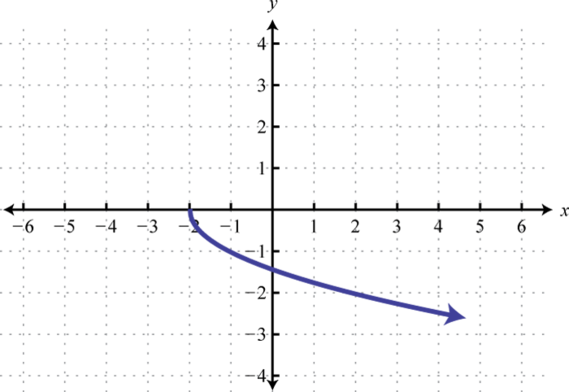
Graph and state its domain and range.
Graph and state its domain and range.
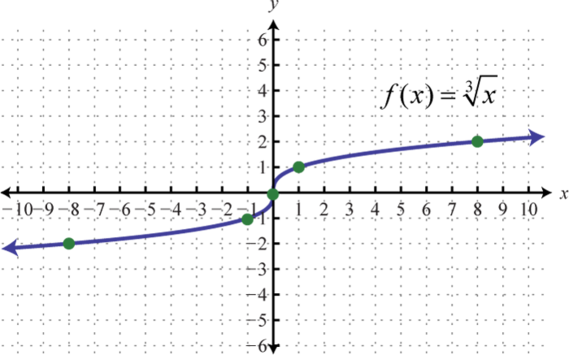
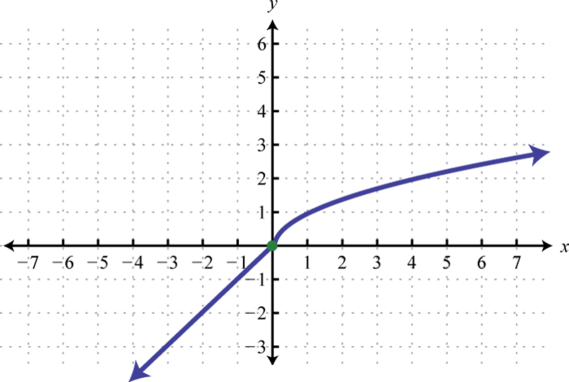
Cube root function.
Find points on the graph of the function defined by with x-values in the set {−8, −1, 0, 1, 8}.
Find points on the graph of the function defined by with x-values in the set {−3, −2, 1, 2, 3}. Use a calculator and round off to the nearest tenth.
Graph the cube root function defined by by plotting the points found in the previous two exercises.
Determine the domain and range of the cube root function.
Find the ordered pair that specifies the point P.
Graph the piecewise functions.
Evaluate.
Find , , and
Find , , and
Find , , and
Find , , and
Find , , and
Find , , and
Find , , and
Find , , and
Evaluate given the graph of f.
Find , , and

Find , , and
Find , , and
Find , , and
Find , , and
Find , , and
Find , , and
Find , , and
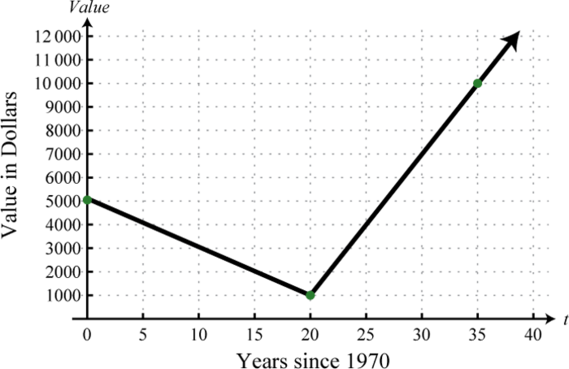
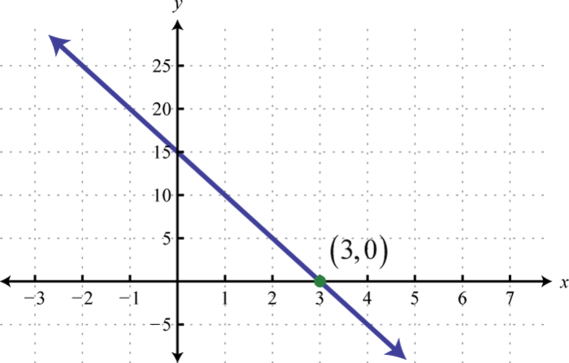
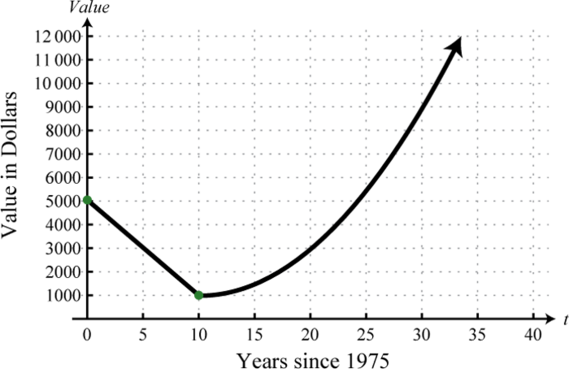
The value of an automobile in dollars is given in terms of the number of years since it was purchased new in 1975:
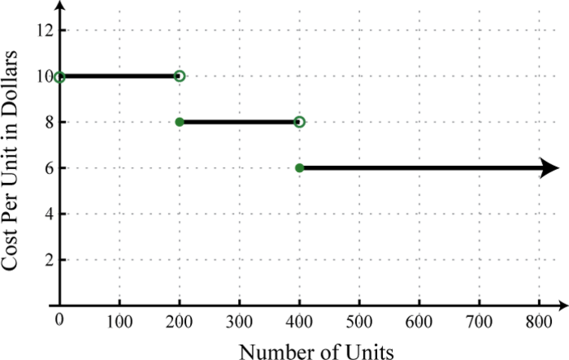
The cost per unit in dollars of custom lamps depends on the number of units produced according to the following graph:
An automobile salesperson earns a commission based on total sales each month x according to the function:
A rental boat costs $32 for one hour, and each additional hour or partial hour costs $8. Graph the cost of the rental boat and determine the cost to rent the boat for hours.
Explain to a beginning algebra student what an asymptote is.
Research and discuss the difference between the floor and ceiling functions. What applications can you find that use these functions?
b
c
a
, ,
, ,
, ,
, ,
Domain: ; range:
{(−8,−2), (−1,−1), (0,0), (1,1), (8,2)}
, , and
, , and
, , and
, , and
, , and
, , and
, , and
, , and
Answer may vary
When the graph of a function is changed in appearance and/or location we call it a transformation. There are two types of transformations. A rigid transformationA set of operations that change the location of a graph in a coordinate plane but leave the size and shape unchanged. changes the location of the function in a coordinate plane, but leaves the size and shape of the graph unchanged. A non-rigid transformationA set of operations that change the size and/or shape of a graph in a coordinate plane. changes the size and/or shape of the graph.
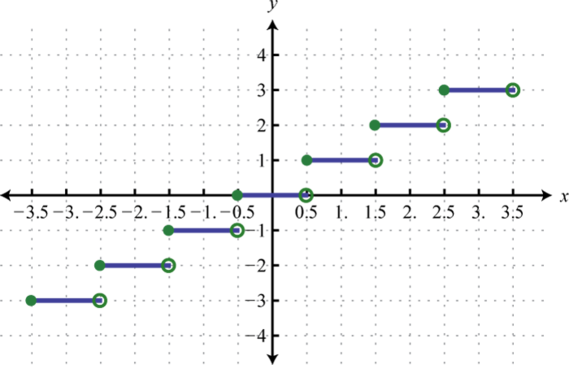
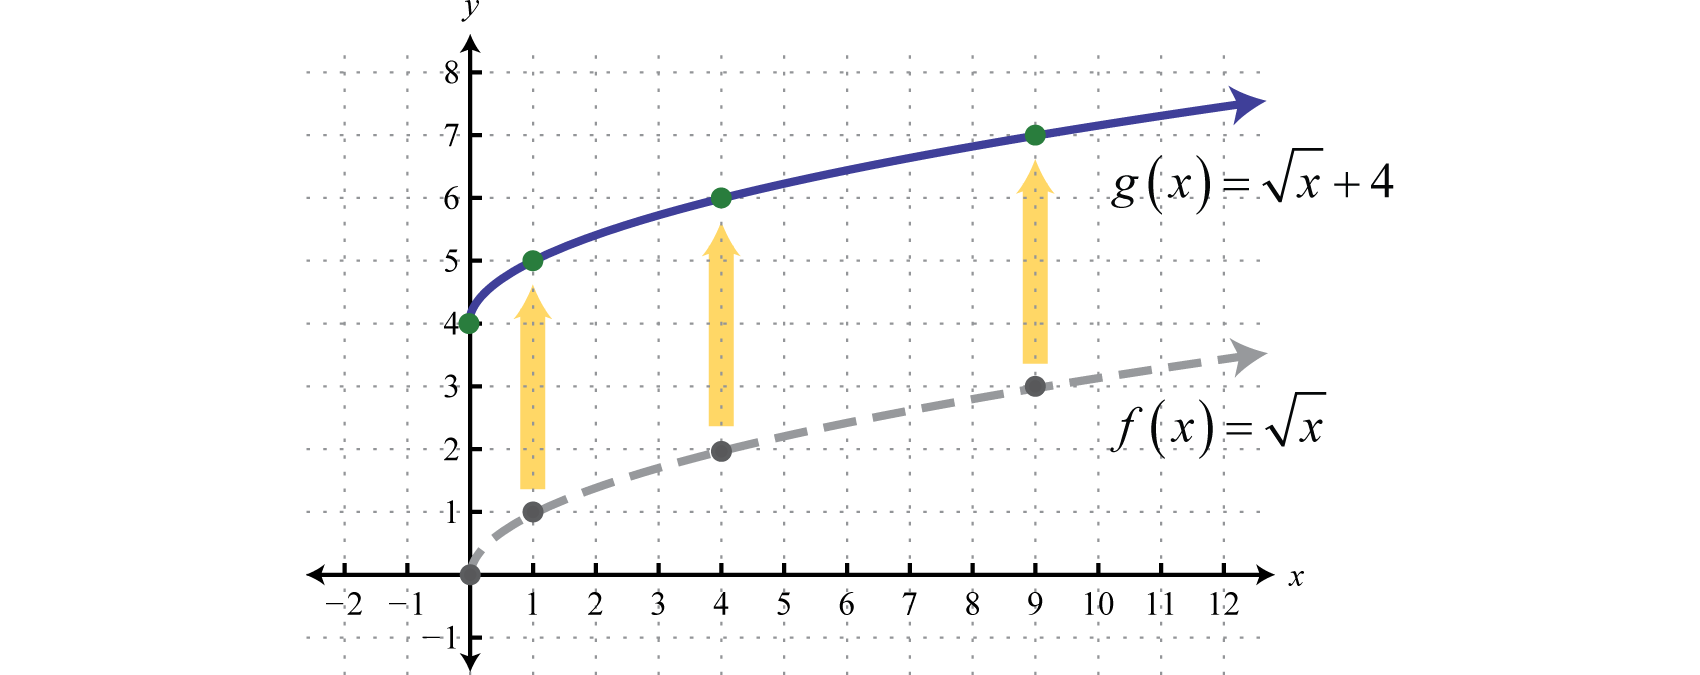
A vertical translationA rigid transformation that shifts a graph up or down. is a rigid transformation that shifts a graph up or down relative to the original graph. This occurs when a constant is added to any function. If we add a positive constant to each y-coordinate, the graph will shift up. If we add a negative constant, the graph will shift down. For example, consider the functions and Begin by evaluating for some values of the independent variable x.

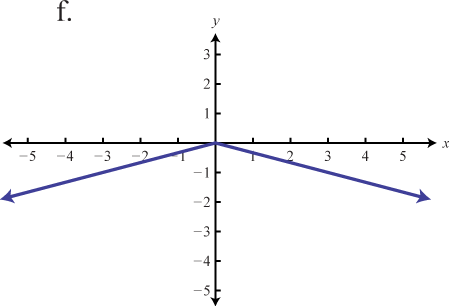
Now plot the points and compare the graphs of the functions g and h to the basic graph of , which is shown using a dashed grey curve below.
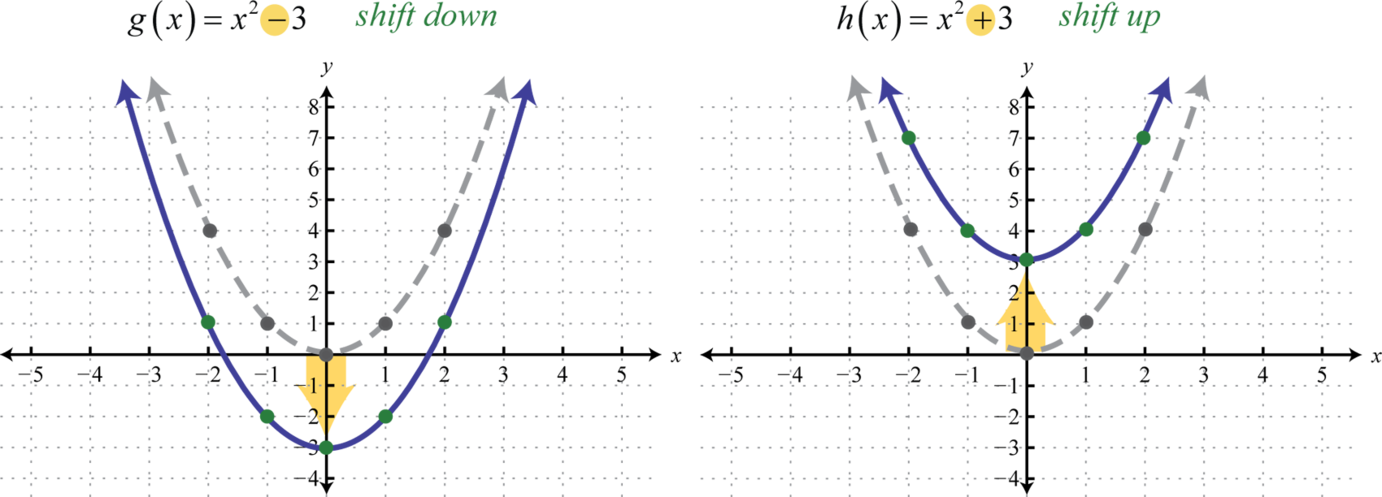
The function g shifts the basic graph down 3 units and the function h shifts the basic graph up 3 units. In general, this describes the vertical translations; if k is any positive real number:
Vertical shift up k units: |
|
Vertical shift down k units: |
Sketch the graph of
Solution:
Begin with the basic function defined by and shift the graph up 4 units.
Answer:
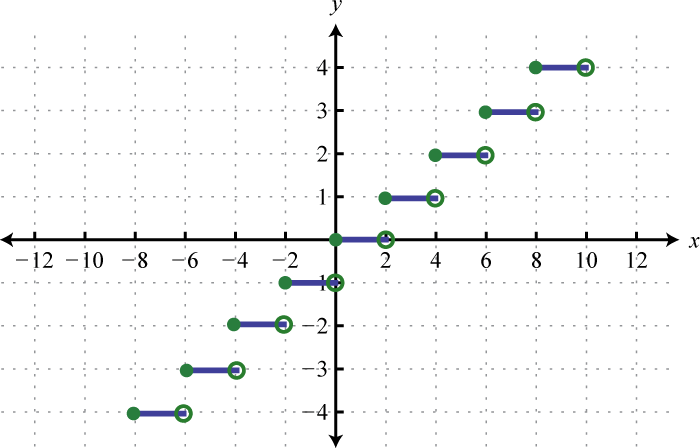
A horizontal translationA rigid transformation that shifts a graph left or right. is a rigid transformation that shifts a graph left or right relative to the original graph. This occurs when we add or subtract constants from the x-coordinate before the function is applied. For example, consider the functions defined by and and create the following tables:
Here we add and subtract from the x-coordinates and then square the result. This produces a horizontal translation.
Note that this is the opposite of what you might expect. In general, this describes the horizontal translations; if h is any positive real number:
Horizontal shift left h units: |
|
Horizontal shift right h units: |
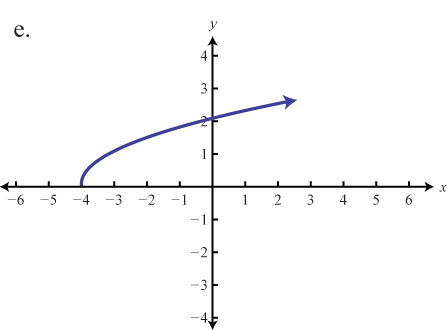
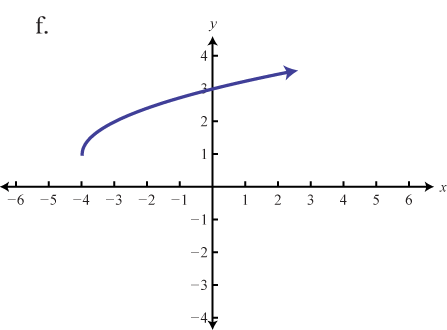
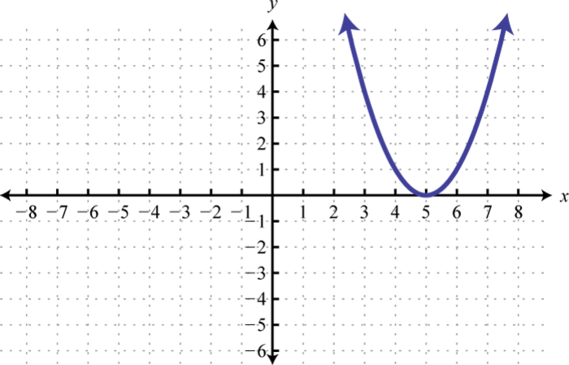
Sketch the graph of
Solution:
Begin with a basic cubing function defined by and shift the graph 4 units to the right.
Answer:
It is often the case that combinations of translations occur.
Sketch the graph of
Solution:
Start with the absolute value function and apply the following transformations.
Answer:
The order in which we apply horizontal and vertical translations does not affect the final graph.
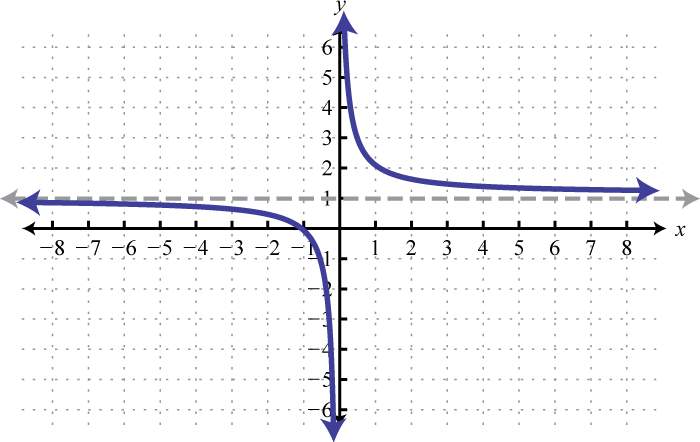
Sketch the graph of
Solution:
Begin with the reciprocal function and identify the translations.
Take care to shift the vertical asymptote from the y-axis 5 units to the right and shift the horizontal asymptote from the x-axis up 3 units.
Answer:
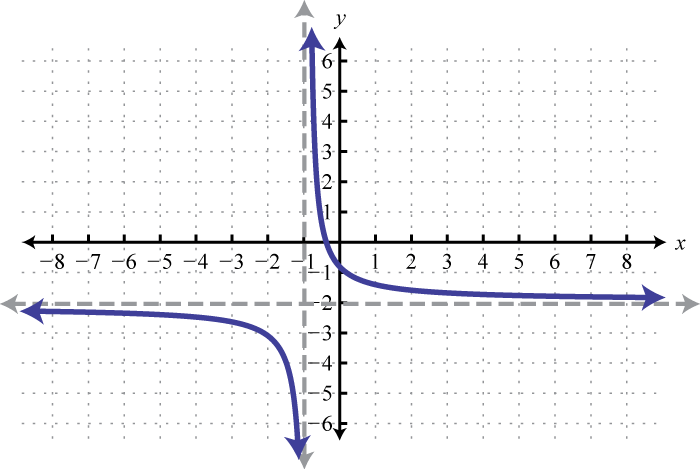
A reflectionA transformation that produces a mirror image of the graph about an axis. is a transformation in which a mirror image of the graph is produced about an axis. In this section, we will consider reflections about the x- and y-axis. The graph of a function is reflected about the x-axis if each y-coordinate is multiplied by −1. The graph of a function is reflected about the y-axis if each x-coordinate is multiplied by −1 before the function is applied. For example, consider and

Compare the graph of g and h to the basic square root function defined by , shown dashed in grey below:
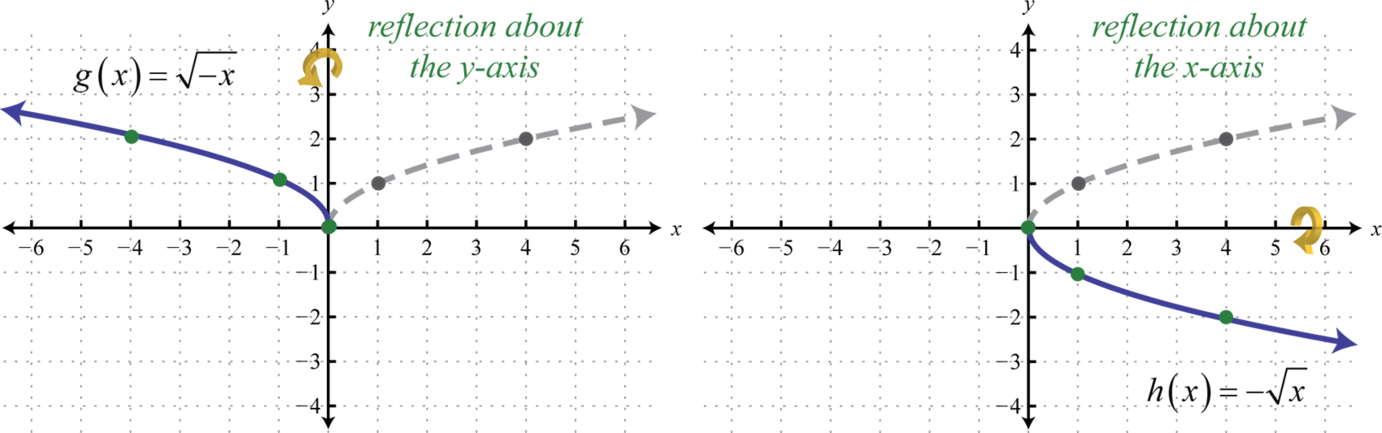
The first function g has a negative factor that appears “inside” the function; this produces a reflection about the y-axis. The second function h has a negative factor that appears “outside” the function; this produces a reflection about the x-axis. In general, it is true that:
Reflection about the y-axis: |
|
Reflection about the x-axis: |
When sketching graphs that involve a reflection, consider the reflection first and then apply the vertical and/or horizontal translations.
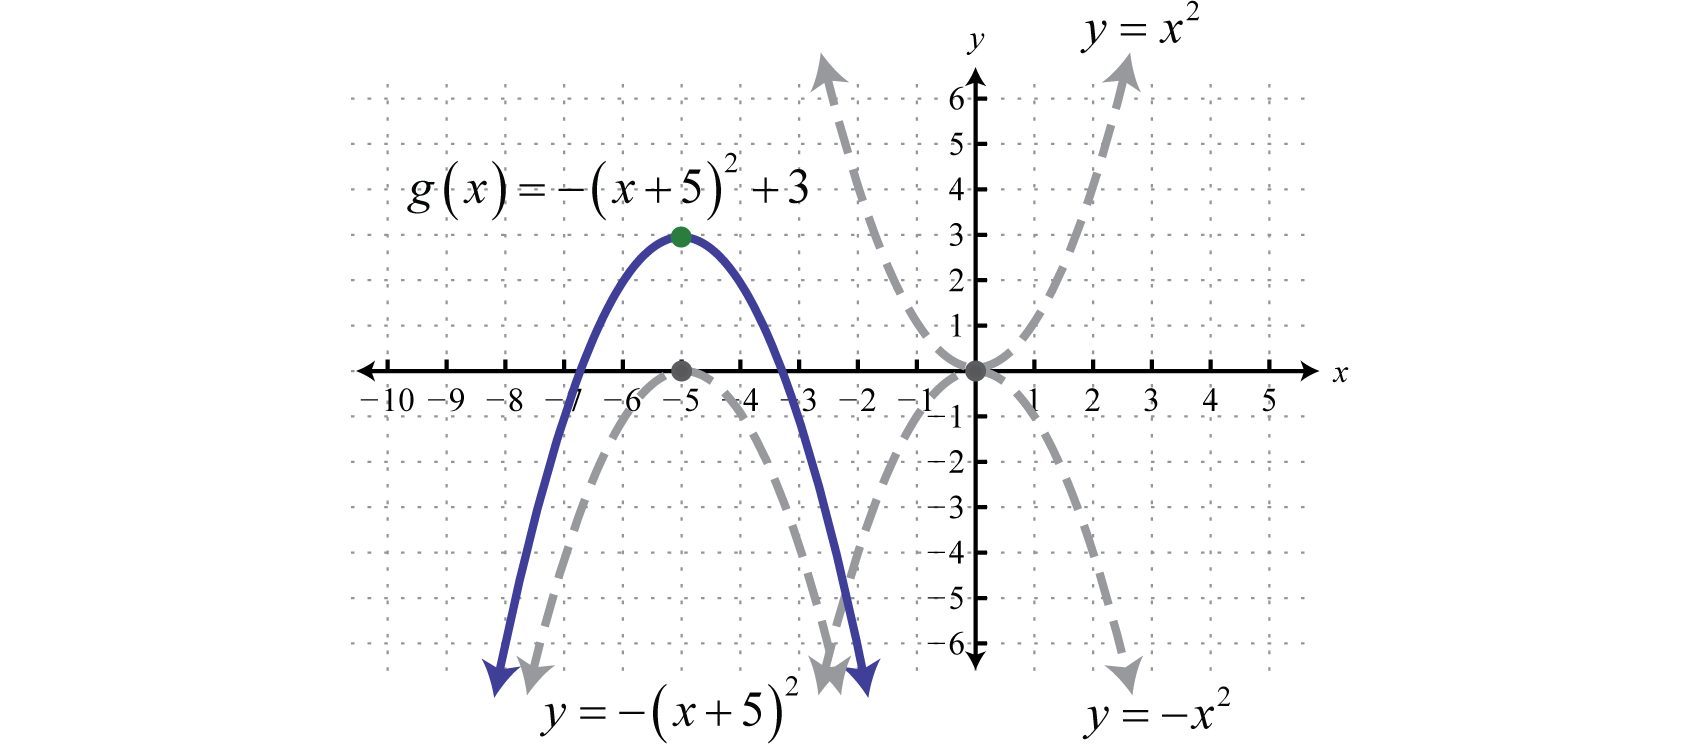
Sketch the graph of
Solution:
Begin with the squaring function and then identify the transformations starting with any reflections.
Use these translations to sketch the graph.
Answer:
Horizontal and vertical translations, as well as reflections, are called rigid transformations because the shape of the basic graph is left unchanged, or rigid. Functions that are multiplied by a real number other than 1, depending on the real number, appear to be stretched vertically or stretched horizontally. This type of non-rigid transformation is called a dilationA non-rigid transformation, produced by multiplying functions by a nonzero real number, which appears to stretch the graph either vertically or horizontally.. For example, we can multiply the squaring function by 4 and to see what happens to the graph.

Compare the graph of g and h to the basic squaring function defined by , shown dashed in grey below:
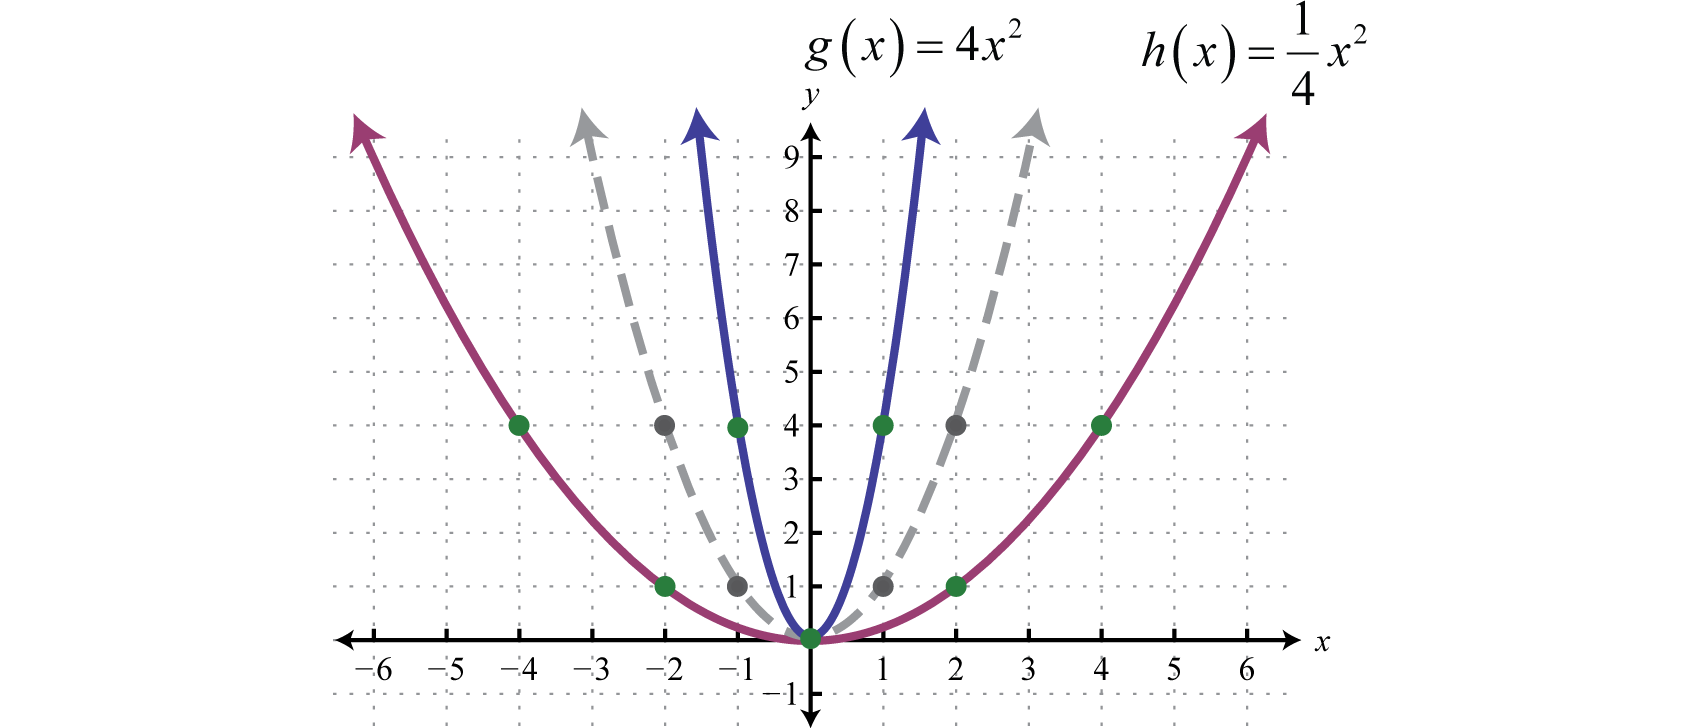
The function g is steeper than the basic squaring function and its graph appears to have been stretched vertically. The function h is not as steep as the basic squaring function and appears to have been stretched horizontally.
In general, we have:
Dilation: |
If the factor a is a nonzero fraction between −1 and 1, it will stretch the graph horizontally. Otherwise, the graph will be stretched vertically. If the factor a is negative, then it will produce a reflection as well.
Sketch the graph of
Solution:
Here we begin with the product of −2 and the basic absolute value function: This results in a reflection and a dilation.
Use the points {(−1, −2), (0, 0), (1, −2)} to graph the reflected and dilated function Then translate this graph 5 units to the right and 3 units down.
Answer:
In summary, given positive real numbers h and k:
Vertical shift up k units: |
|
Vertical shift down k units: |
Horizontal shift left h units: |
|
Horizontal shift right h units: |
Reflection about the y-axis: |
|
Reflection about the x-axis: |
Dilation: |
Match the graph to the function definition.
Graph the given function. Identify the basic function and translations used to sketch the graph. Then state the domain and range.
Graph the piecewise functions.
Write an equation that represents the function whose graph is given.
Match the graph the given function definition.
Use the transformations to graph the following functions.
Use different colors to graph the family of graphs defined by , where What happens to the graph when the denominator of k is very large? Share your findings on the discussion board.
Graph and on the same set of coordinate axes. What does the general shape look like? Try to find a single equation that describes the shape. Share your findings.
Explore what happens to the graph of a function when the domain values are multiplied by a factor a before the function is applied, Develop some rules for this situation and share them on the discussion board.
e
d
f
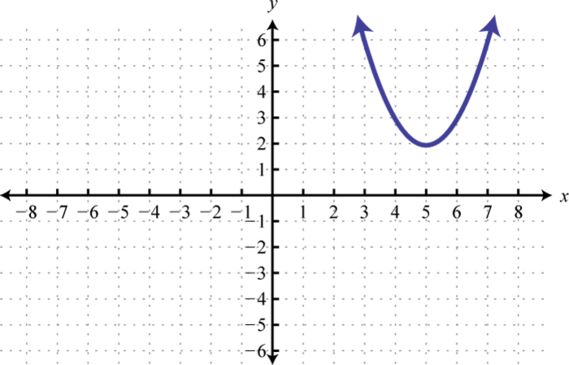
; Shift up 3 units; domain: ; range:
; Shift up 1 unit; domain: ; range:
; Shift right 5 units; domain: ; range:
; Shift right 5 units and up 2 units; domain: ; range:
; Shift left 4 units; domain: ; range:
; Shift right 1 unit and down 3 units; domain: ; range:

; Shift down 5 units; domain: ; range:
; Shift right 2 units and up 1 unit; domain: ; range:
; Shift right 2 units; domain: ; range:
; Shift right 1 unit and down 4 units; domain: ; range:
; Shift right 2 units; domain: ; range:
; Shift up 5 units; domain: ; range:
; Shift left 1 unit and down 2 units; domain: ; range:
Basic graph ; domain: ; range: {−4}
; Shift up 6 units and right 2 units; domain: ; range:
b
d
f

Answer may vary
Answer may vary
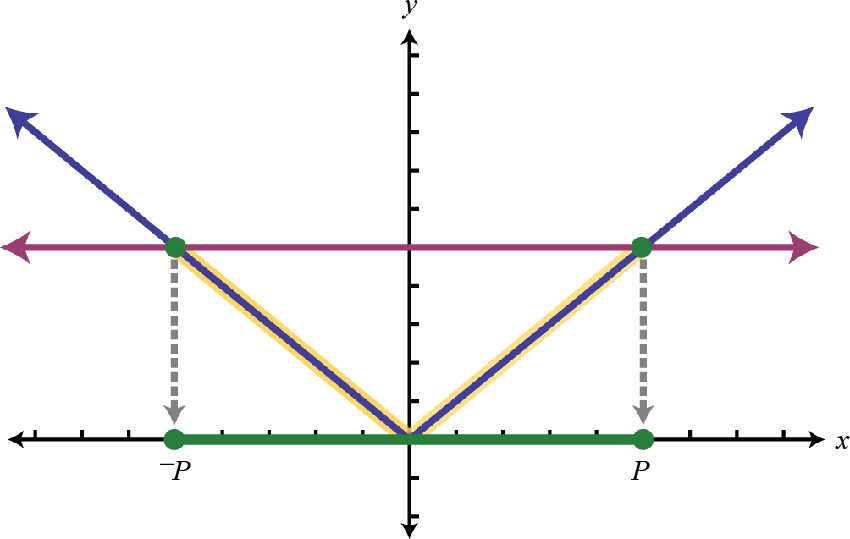
Recall that the absolute valueThe distance from the graph of a number a to zero on a number line, denoted of a real number a, denoted , is defined as the distance between zero (the origin) and the graph of that real number on the number line. For example, and

In addition, the absolute value of a real number can be defined algebraically as a piecewise function.
Given this definition, and Therefore, the equation has two solutions for x, namely {±3}. In general, given any algebraic expression X and any positive number p:
In other words, the argument of the absolute valueThe number or expression inside the absolute value. X can be either positive or negative p. Use this theorem to solve absolute value equations algebraically.
Solve:
Solution:
In this case, the argument of the absolute value is and must be equal to 3 or −3.

Therefore, to solve this absolute value equation, set equal to ±3 and solve each linear equation as usual.
Answer: The solutions are −5 and 1.
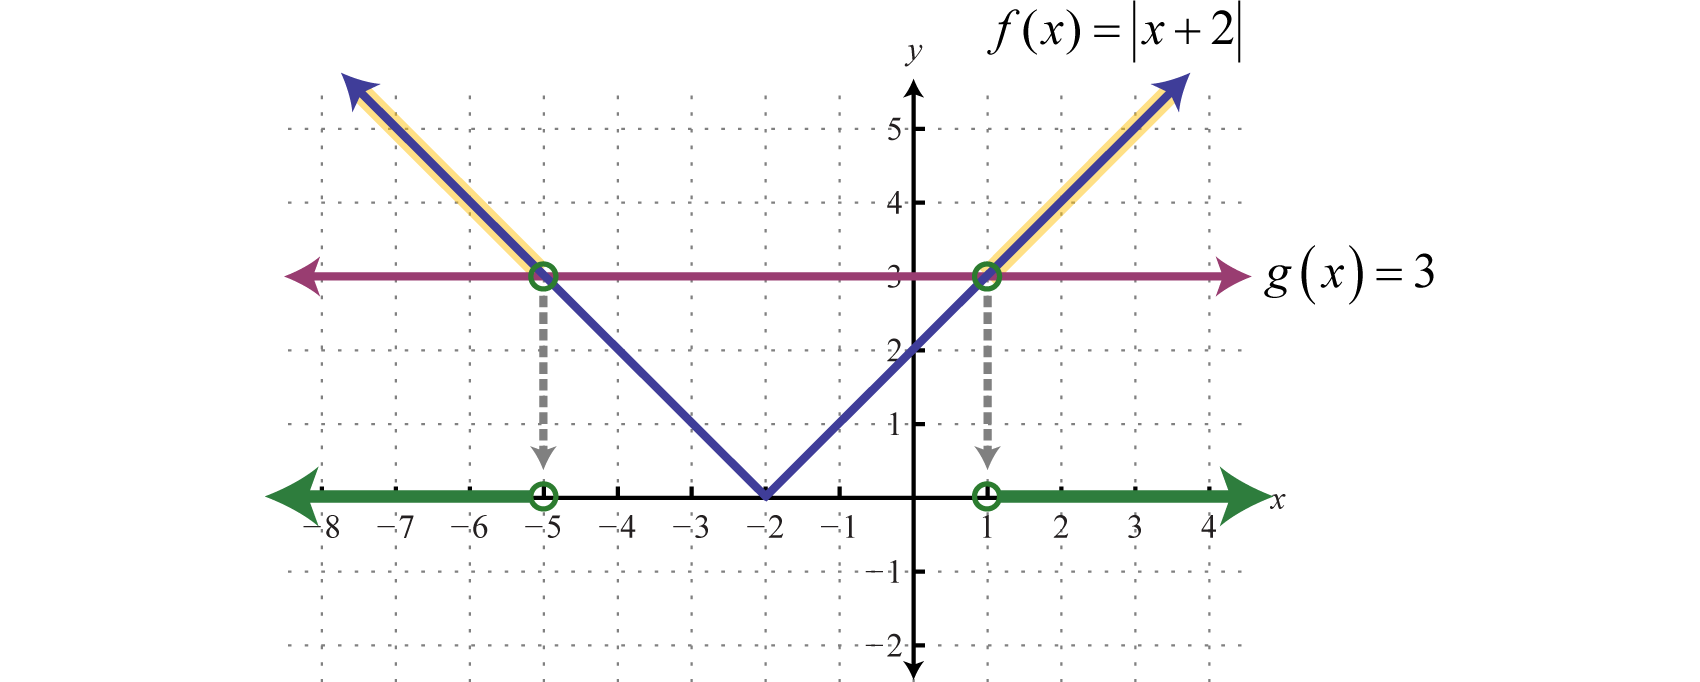
To visualize these solutions, graph the functions on either side of the equal sign on the same set of coordinate axes. In this case, is an absolute value function shifted two units horizontally to the left, and is a constant function whose graph is a horizontal line. Determine the x-values where
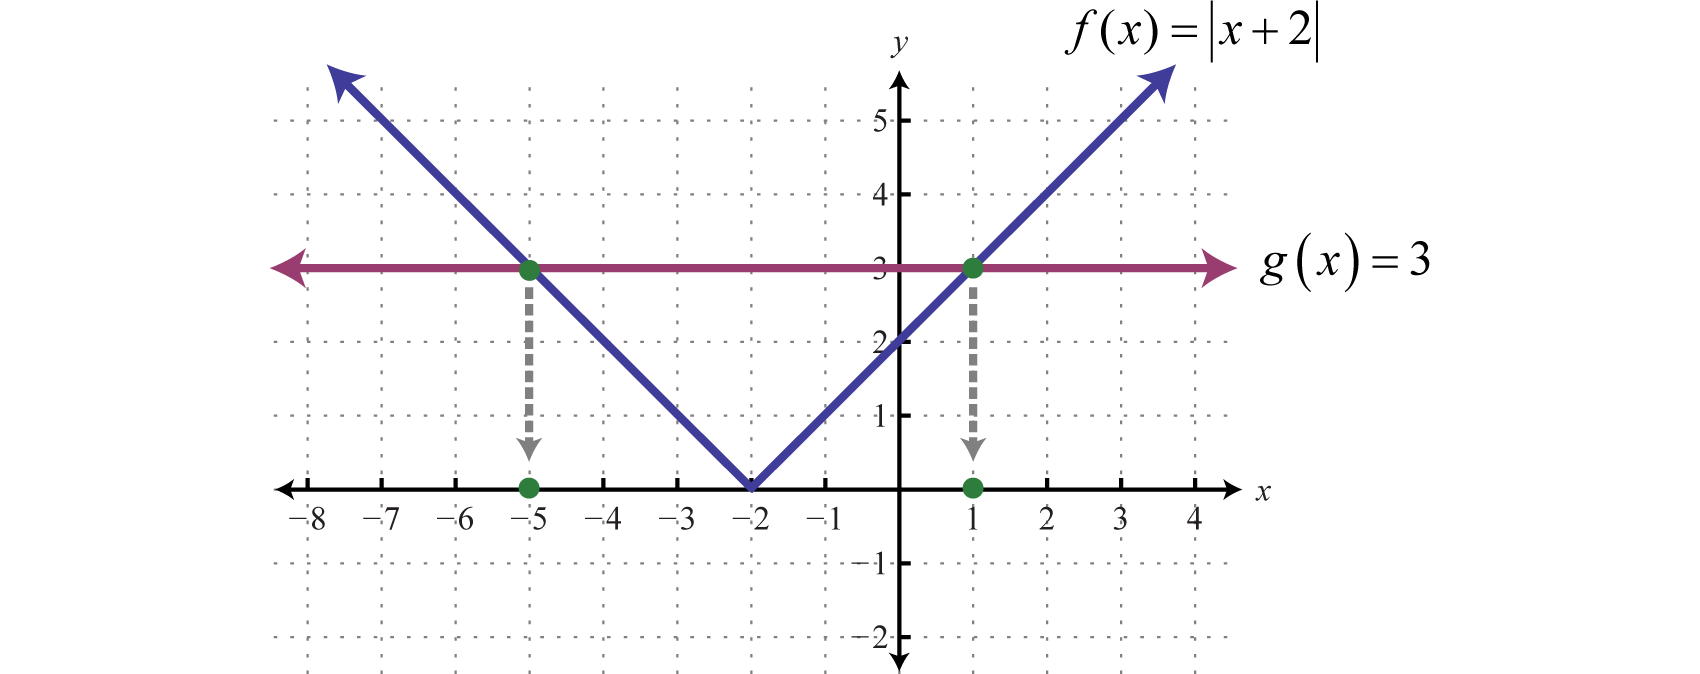
From the graph we can see that both functions coincide where x = −5 and x = 1. The solutions correspond to the points of intersection.
Solve:
Solution:
Here the argument of the absolute value is and can be equal to −4 or 4.
Check to see if these solutions satisfy the original equation.
Check |
Check |
|---|---|
Answer: The solutions are and
To apply the theorem, the absolute value must be isolated. The general steps for solving absolute value equations are outlined in the following example.
Solve:
Solution:
Step 1: Isolate the absolute value to obtain the form
Step 2: Set the argument of the absolute value equal to ±p. Here the argument is and
Step 3: Solve each of the resulting linear equations.
Step 4: Verify the solutions in the original equation.
Check |
Check |
|---|---|
Answer: The solutions are −1 and
Not all absolute value equations will have two solutions.
Solve:
Solution:
Begin by isolating the absolute value.
Only zero has the absolute value of zero, In other words, has one solution, namely Therefore, set the argument equal to zero and then solve for x.
Geometrically, one solution corresponds to one point of intersection.
Answer: The solution is
Solve:
Solution:
Begin by isolating the absolute value.
In this case, we can see that the isolated absolute value is equal to a negative number. Recall that the absolute value will always be positive. Therefore, we conclude that there is no solution. Geometrically, there is no point of intersection.
Answer: There is no solution, Ø.
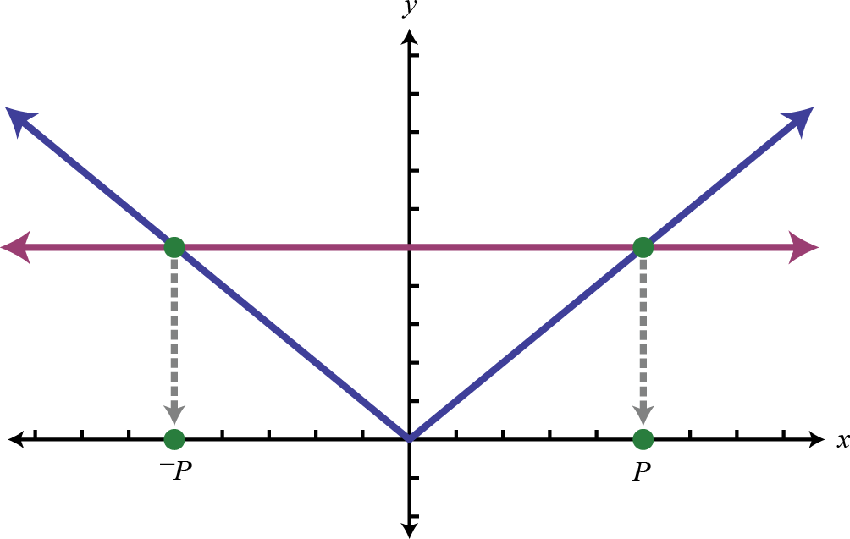
If given an equation with two absolute values of the form , then b must be the same as a or opposite. For example, if a = 5, then b = ±5 and we have:
In general, given algebraic expressions X and Y:
In other words, if two absolute value expressions are equal, then the arguments can be the same or opposite.
Solve:
Solution:
Set equal to and then solve each linear equation.
To check, we substitute these values into the original equation.
Check |
Check |
|---|---|
As an exercise, use a graphing utility to graph both and on the same set of axes. Verify that the graphs intersect where x is equal to 1 and 3.
Answer: The solutions are 1 and 3.
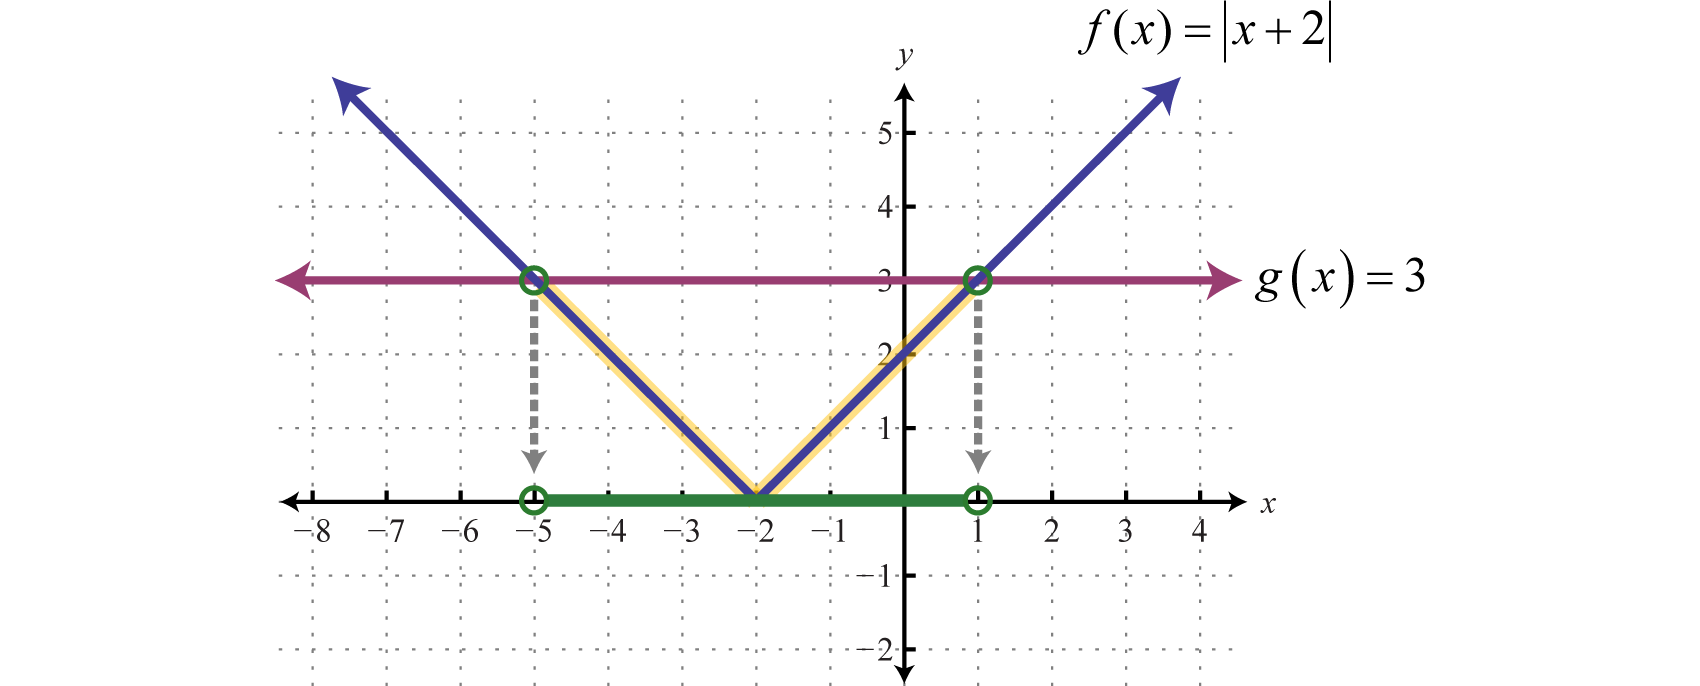
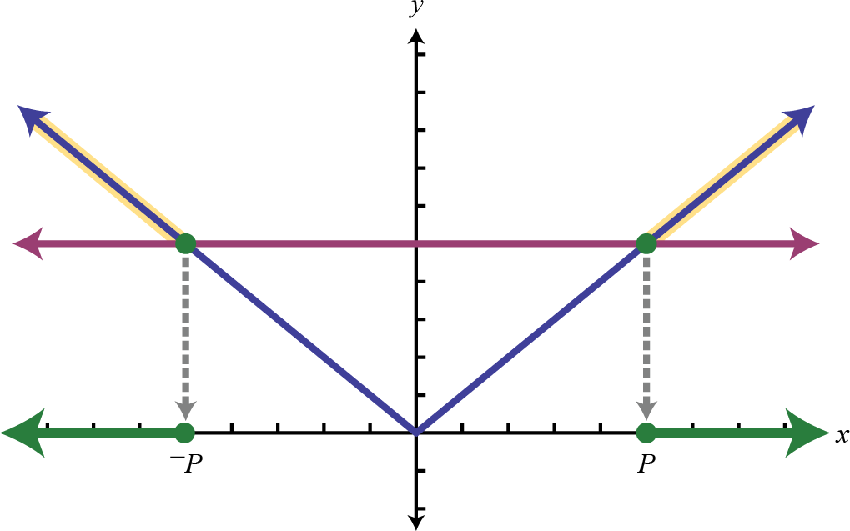
We begin by examining the solutions to the following inequality:
The absolute value of a number represents the distance from the origin. Therefore, this equation describes all numbers whose distance from zero is less than or equal to 3. We can graph this solution set by shading all such numbers.

Certainly we can see that there are infinitely many solutions to bounded by −3 and 3. Express this solution set using set notation or interval notation as follows:
In this text, we will choose to express solutions in interval notation. In general, given any algebraic expression X and any positive number p:
This theorem holds true for strict inequalities as well. In other words, we can convert any absolute value inequality involving “less than” into a compound inequality which can be solved as usual.
Solve and graph the solution set:
Solution:
Bound the argument by −3 and 3 and solve.
Here we use open dots to indicate strict inequalities on the graph as follows.

Answer: Using interval notation,
The solution to can be interpreted graphically if we let and and then determine where by graphing both f and g on the same set of axes.
The solution consists of all x-values where the graph of is below the graph of In this case, we can see that where the x-values are between −5 and 1. To apply the theorem, we must first isolate the absolute value.
Solve:
Solution:
Begin by isolating the absolute value.
Next, apply the theorem and rewrite the absolute value inequality as a compound inequality.
Solve.
Shade the solutions on a number line and present the answer in interval notation. Here we use closed dots to indicate inclusive inequalities on the graph as follows:

Answer: Using interval notation,
Next, we examine the solutions to an inequality that involves “greater than,” as in the following example:
This inequality describes all numbers whose distance from the origin is greater than or equal to 3. On a graph, we can shade all such numbers.

There are infinitely many solutions that can be expressed using set notation and interval notation as follows:
In general, given any algebraic expression X and any positive number p:
The theorem holds true for strict inequalities as well. In other words, we can convert any absolute value inequality involving “greater than” into a compound inequality that describes two intervals.
Solve and graph the solution set:
Solve
The argument must be less than −3 or greater than 3.

Answer: Using interval notation,
The solution to can be interpreted graphically if we let and and then determine where by graphing both f and g on the same set of axes.
The solution consists of all x-values where the graph of is above the graph of In this case, we can see that where the x-values are less than −5 or are greater than 1. To apply the theorem we must first isolate the absolute value.
Solve:
Solution:
Begin by isolating the absolute value.
Next, apply the theorem and rewrite the absolute value inequality as a compound inequality.
Solve.
Shade the solutions on a number line and present the answer using interval notation.

Answer: Using interval notation,
Up to this point, the solution sets of linear absolute value inequalities have consisted of a single bounded interval or two unbounded intervals. This is not always the case.
Solve and graph:
Solution:
Begin by isolating the absolute value.
Notice that we have an absolute value greater than a negative number. For any real number x the absolute value of the argument will always be positive. Hence, any real number will solve this inequality.

Geometrically, we can see that is always greater than
Answer: All real numbers,
Solve and graph:
Solution:
Begin by isolating the absolute value.
In this case, we can see that the isolated absolute value is to be less than or equal to a negative number. Again, the absolute value will always be positive; hence, we can conclude that there is no solution.
Geometrically, we can see that is never less than
Answer: Ø
In summary, there are three cases for absolute value equations and inequalities. The relations =, and determine which theorem to apply.
Case 1: An absolute value equation:
|
Case 2: An absolute value inequality involving “less than.”
|
Case 3: An absolute value inequality involving “greater than.”
|
Assume all variables in the denominator are nonzero.
Solve for x:
Solve for x:
Solve and graph the solution set. In addition, give the solution set in interval notation.
Solve and graph the solution set.
Assume all variables in the denominator are nonzero.
Solve for x where :
Solve for x where :
Given the graph of and , determine the x-values where:
Make three note cards, one for each of the three cases described in this section. On one side write the theorem, and on the other write a complete solution to a representative example. Share your strategy for identifying and solving absolute value equations and inequalities on the discussion board.
Make your own examples of absolute value equations and inequalities that have no solution, at least one for each case described in this section. Illustrate your examples with a graph.
−9, 9
4, 10
−12
Ø
−6, 7
−1,
1,
−26, 10
0, 6
0,
1, 15
Ø
−3, 1
4, 6
Ø
−2.2, 7.8
1, 5
, 5
, 1
−4, 0.75
0, 4
;

;

Ø;

;

;

;

;

;

;

;

;

;

;

;

;

;

;

;
;

;

;

;

;

;

;

;

Answer may vary
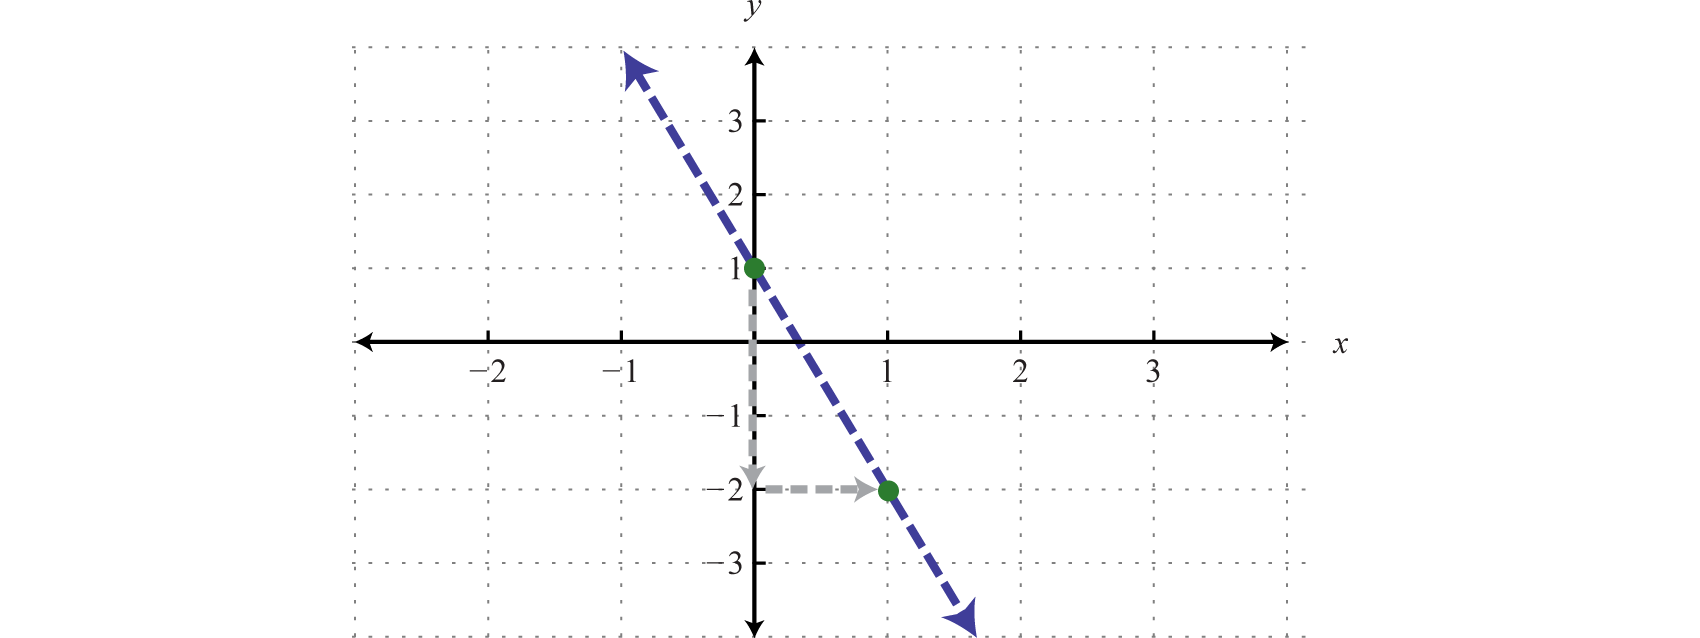
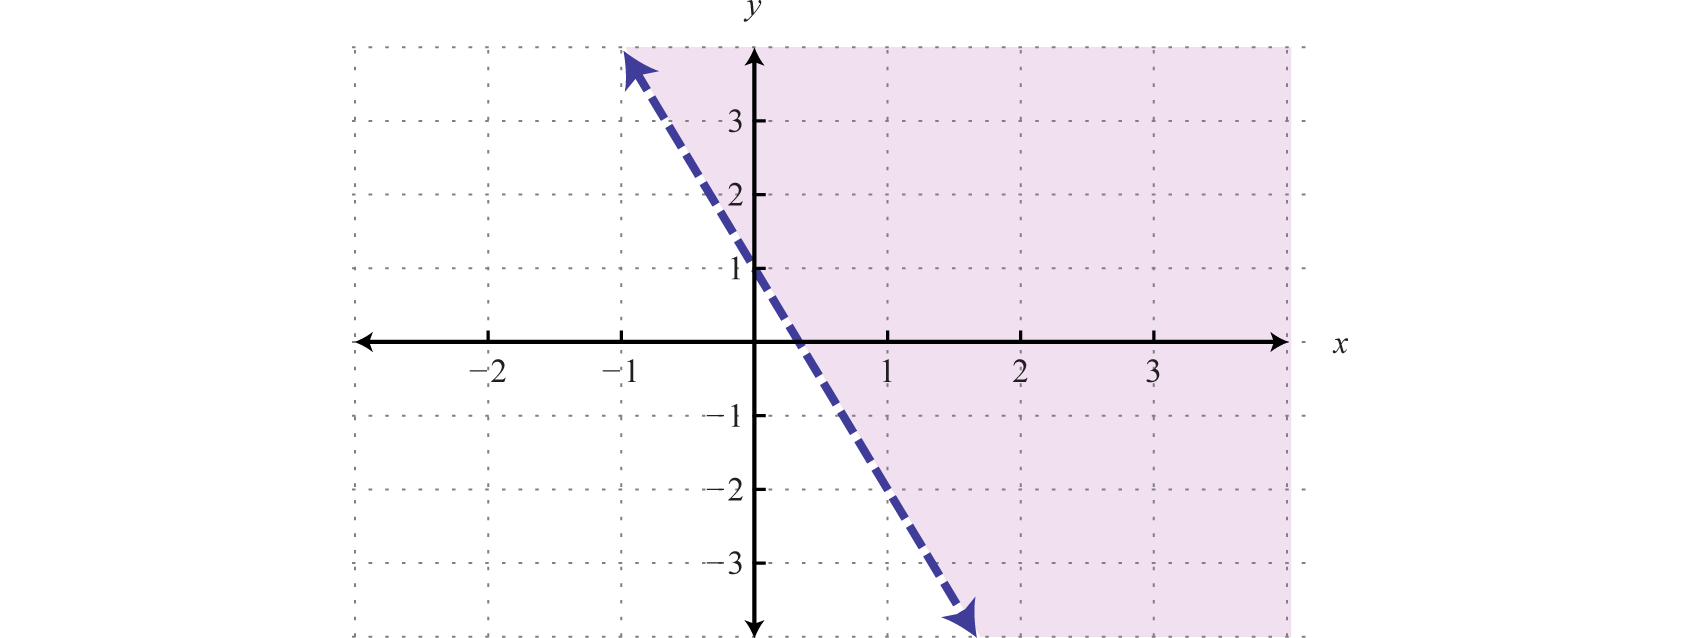
We know that a linear equation with two variables has infinitely many ordered pair solutions that form a line when graphed. A linear inequality with two variablesAn inequality relating linear expressions with two variables. The solution set is a region defining half of the plane., on the other hand, has a solution set consisting of a region that defines half of the plane.
Linear Equation |
Linear Inequality |
|---|---|
|
|
For the inequality, the line defines the boundary of the region that is shaded. This indicates that any ordered pair in the shaded region, including the boundary line, will satisfy the inequality. To see that this is the case, choose a few test pointsA point not on the boundary of the linear inequality used as a means to determine in which half-plane the solutions lie. and substitute them into the inequality.
Test point |
|
(0, 0) |
|
(2, 1) |
|
(−2, −1) |
Also, we can see that ordered pairs outside the shaded region do not solve the linear inequality.
Test point |
|
(−2, 3) |
The graph of the solution set to a linear inequality is always a region. However, the boundary may not always be included in that set. In the previous example, the line was part of the solution set because of the “or equal to” part of the inclusive inequality If given a strict inequality , we would then use a dashed line to indicate that those points are not included in the solution set.
Non-Inclusive Boundary |
Inclusive Boundary |
|---|---|
|
|
Consider the point (0, 3) on the boundary; this ordered pair satisfies the linear equation. It is the “or equal to” part of the inclusive inequality that makes the ordered pair part of the solution set.
So far we have seen examples of inequalities that were “less than.” Now consider the following graphs with the same boundary:
Greater Than (Above) |
Less Than (Below) |
|---|---|
|
|
Given the graphs above, what might we expect if we use the origin (0, 0) as a test point?
Determine whether or not is a solution to
Solution:
Substitute the x- and y-values into the equation and see if a true statement is obtained.
Answer: is a solution.
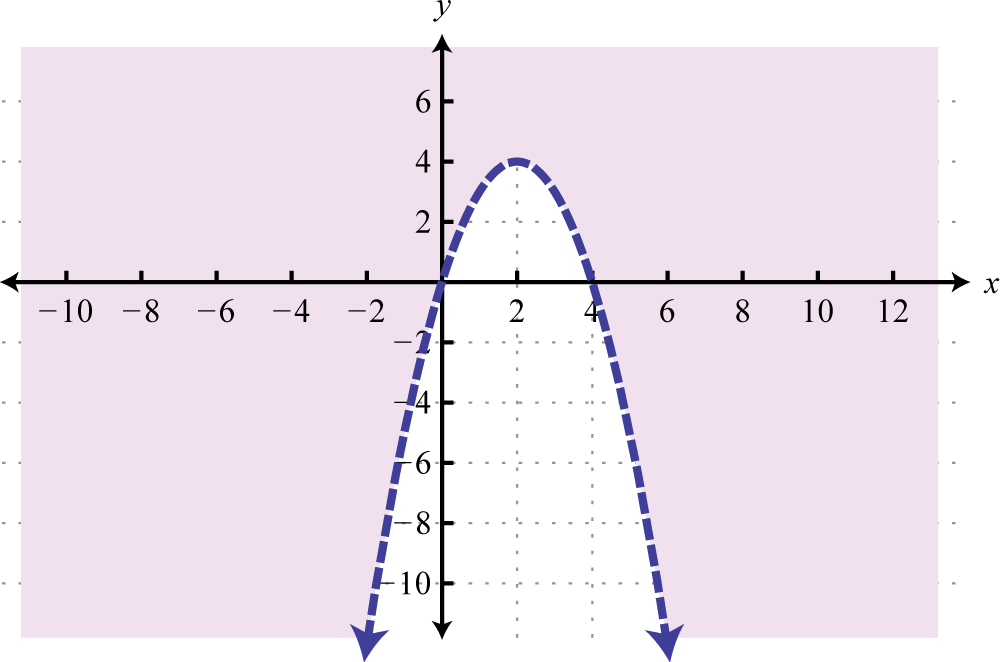
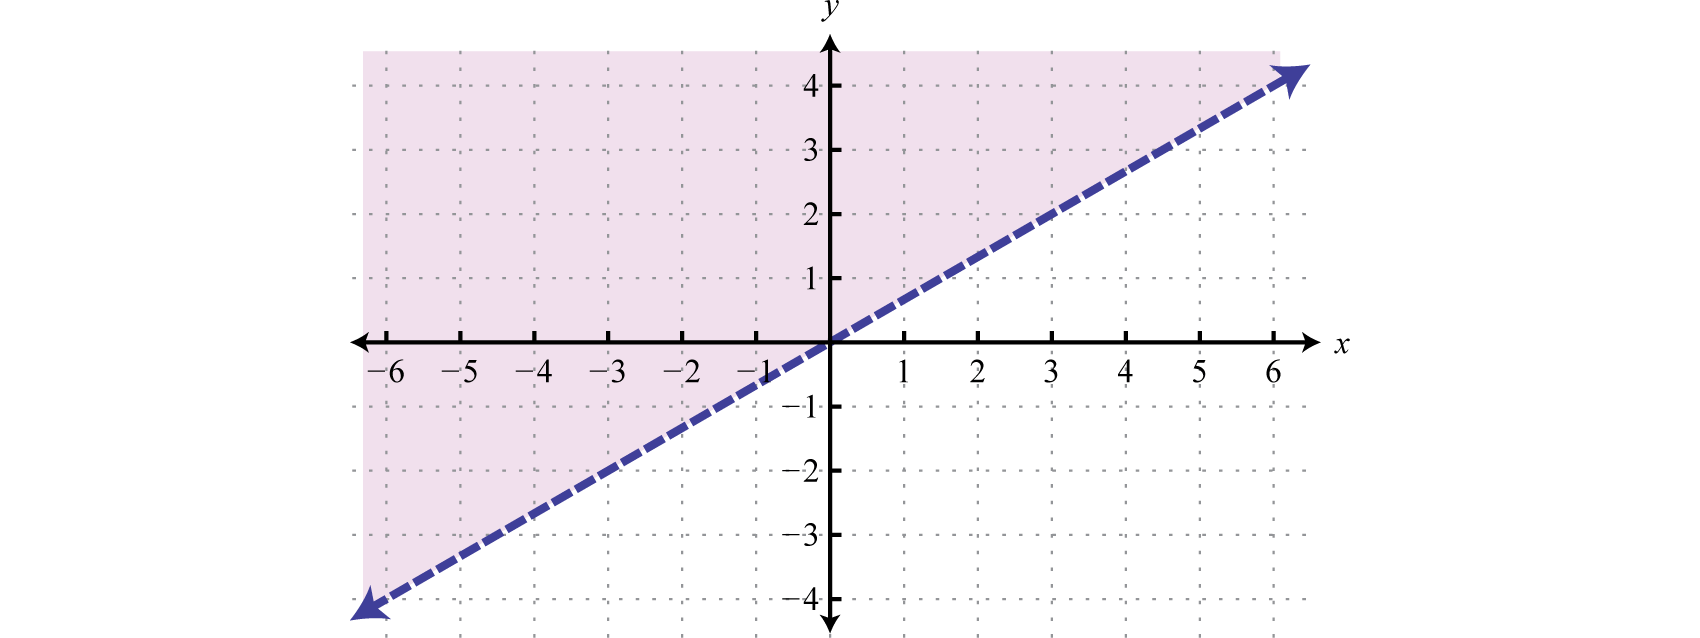
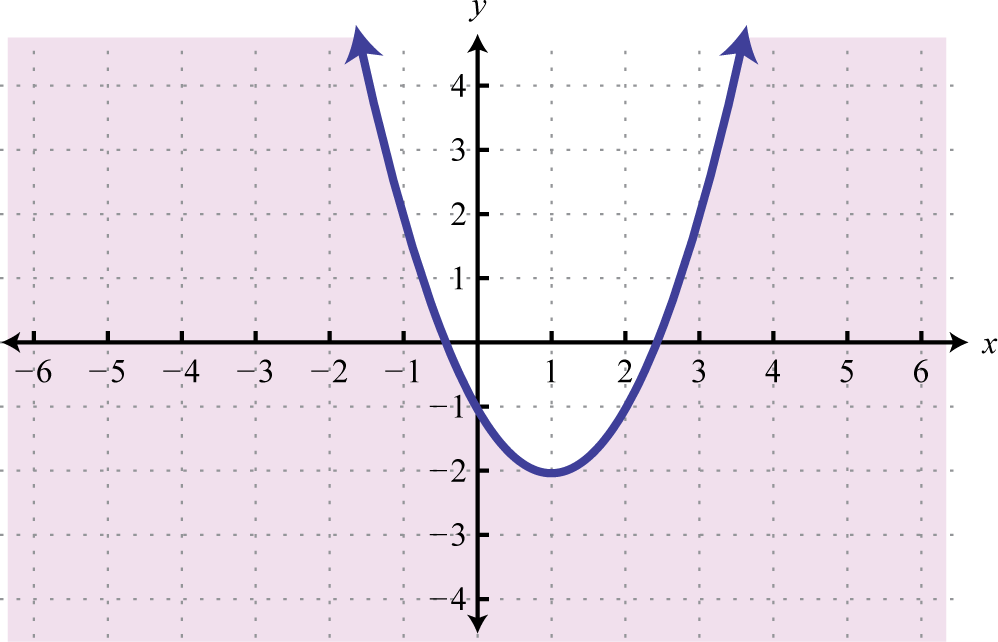
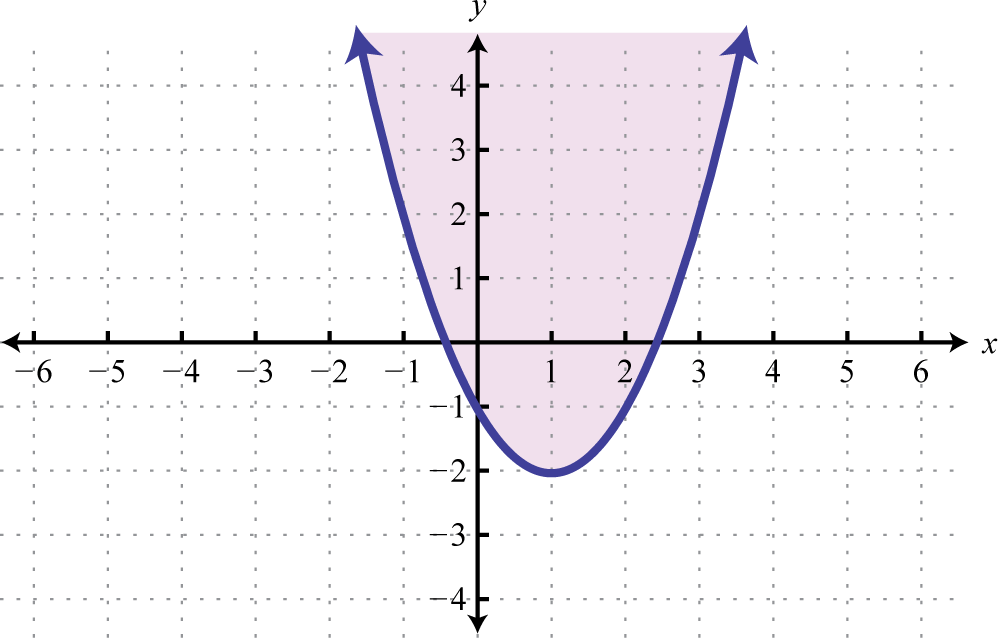
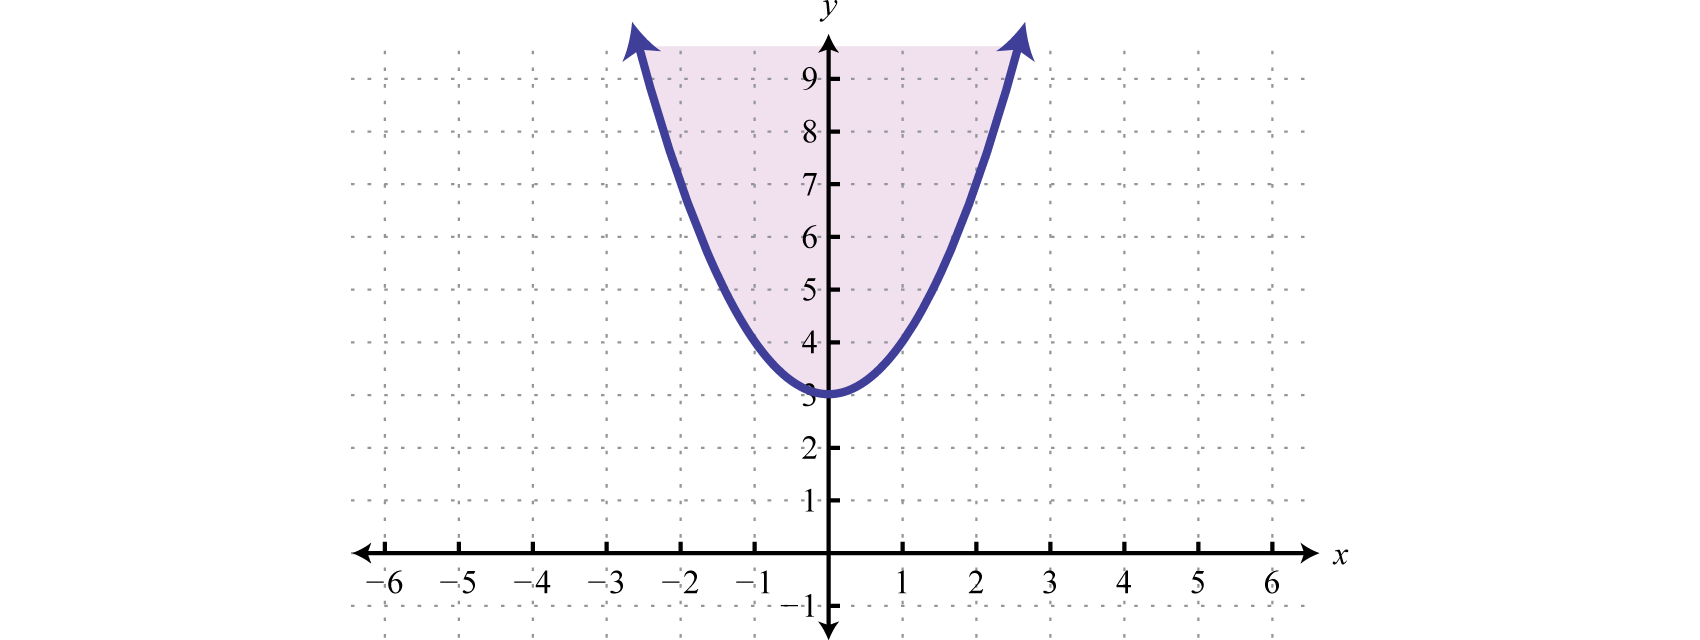
These ideas and techniques extend to nonlinear inequalities with two variables. For example, all of the solutions to are shaded in the graph below.
The boundary of the region is a parabola, shown as a dashed curve on the graph, and is not part of the solution set. However, from the graph we expect the ordered pair (−1,4) to be a solution. Furthermore, we expect that ordered pairs that are not in the shaded region, such as (−3, 2), will not satisfy the inequality.
Check (−1,4) |
Check (−3, 2) |
|---|---|
Following are graphs of solutions sets of inequalities with inclusive parabolic boundaries.
|
|
You are encouraged to test points in and out of each solution set that is graphed above.
Solutions to linear inequalities are a shaded half-plane, bounded by a solid line or a dashed line. This boundary is either included in the solution or not, depending on the given inequality. If we are given a strict inequality, we use a dashed line to indicate that the boundary is not included. If we are given an inclusive inequality, we use a solid line to indicate that it is included. The steps for graphing the solution set for an inequality with two variables are shown in the following example.
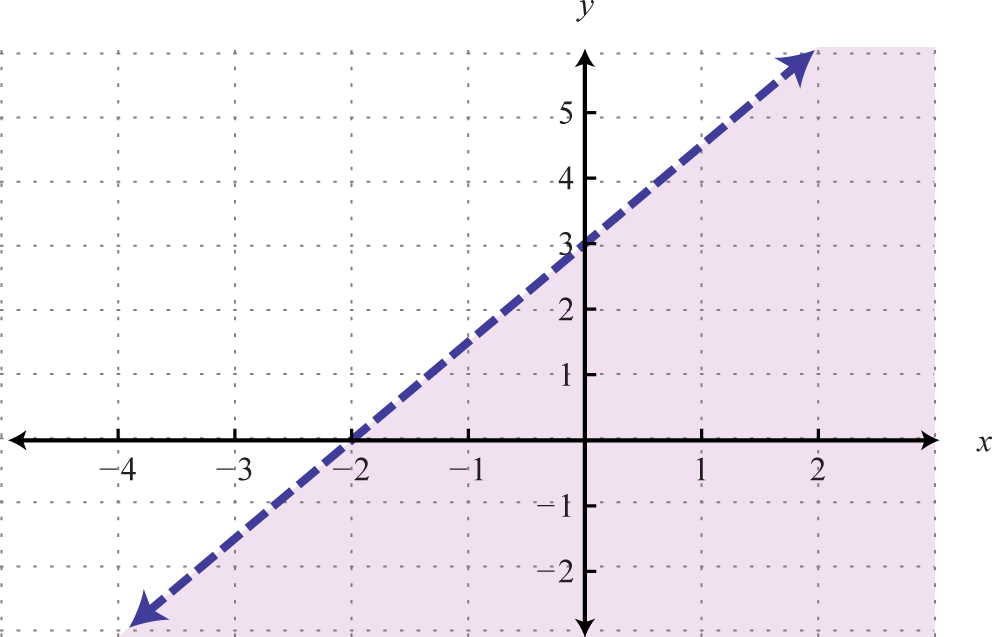
Graph the solution set
Solution:
Step 1: Graph the boundary. Because of the strict inequality, we will graph the boundary using a dashed line. We can see that the slope is and the y-intercept is (0, 1).
Step 2: Test a point that is not on the boundary. A common test point is the origin, (0, 0). The test point helps us determine which half of the plane to shade.
Test point |
|
(0, 0) |
Answer:
Consider the problem of shading above or below the boundary line when the inequality is in slope-intercept form. If , then shade above the line. If , then shade below the line. Shade with caution; sometimes the boundary is given in standard form, in which case these rules do not apply.
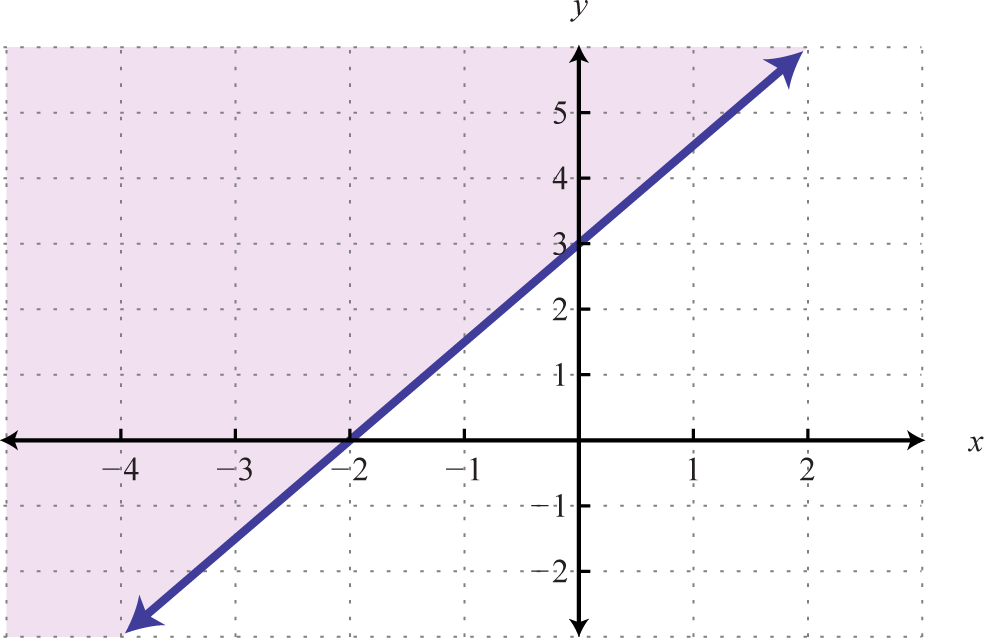
Graph the solution set
Solution:
Here the boundary is defined by the line Since the inequality is inclusive, we graph the boundary using a solid line. In this case, graph the boundary line using intercepts.
To find the x-intercept, set y = 0. |
To find the y-intercept, set x = 0. |
|---|---|
|
|
|
x-intercept: (−5, 0) |
y-intercept: (0, 2) |
Next, test a point; this helps decide which region to shade.
Test point |
|
(0, 0) |
Since the test point is in the solution set, shade the half of the plane that contains it.
Answer:
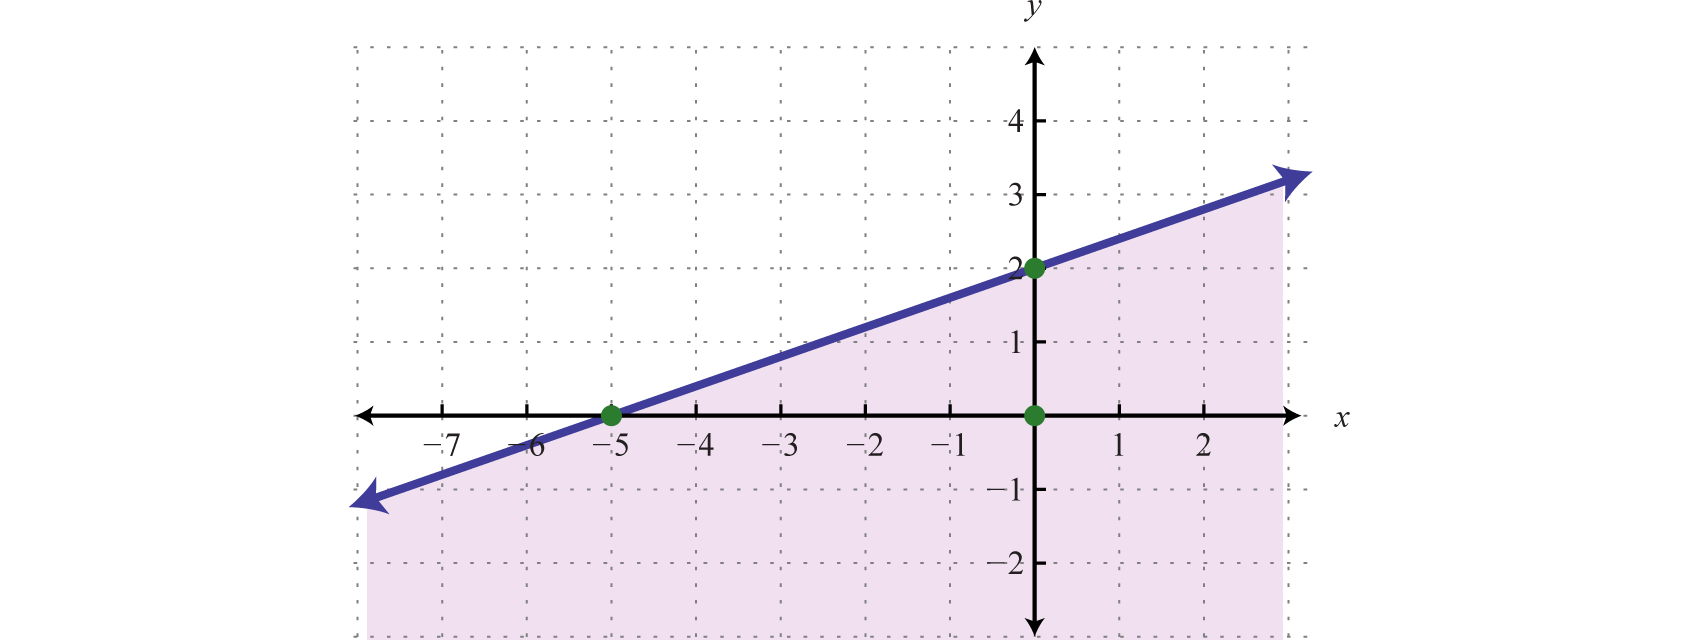
In this example, notice that the solution set consists of all the ordered pairs below the boundary line. This may seem counterintuitive because the original inequality involved “greater than” This illustrates that it is a best practice to actually test a point. Solve for y and you see that the shading is correct.
In slope-intercept form, you can see that the region below the boundary line should be shaded. An alternate approach is to first express the boundary in slope-intercept form, graph it, and then shade the appropriate region.
Graph the solution set
Solution:
First, graph the boundary line with a dashed line because of the strict inequality. Next, test a point.
Test point |
|
(0, 0) |
In this case, shade the region that contains the test point.
Answer:
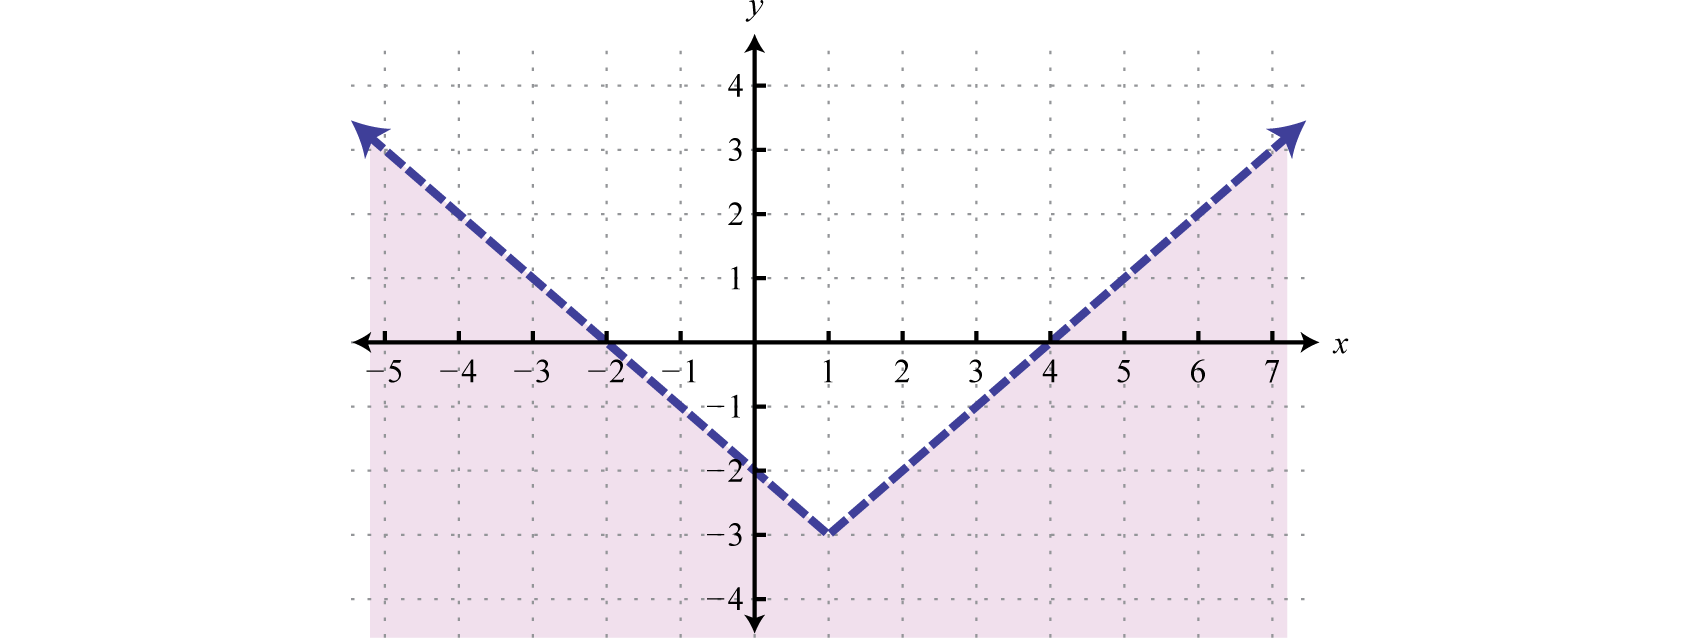
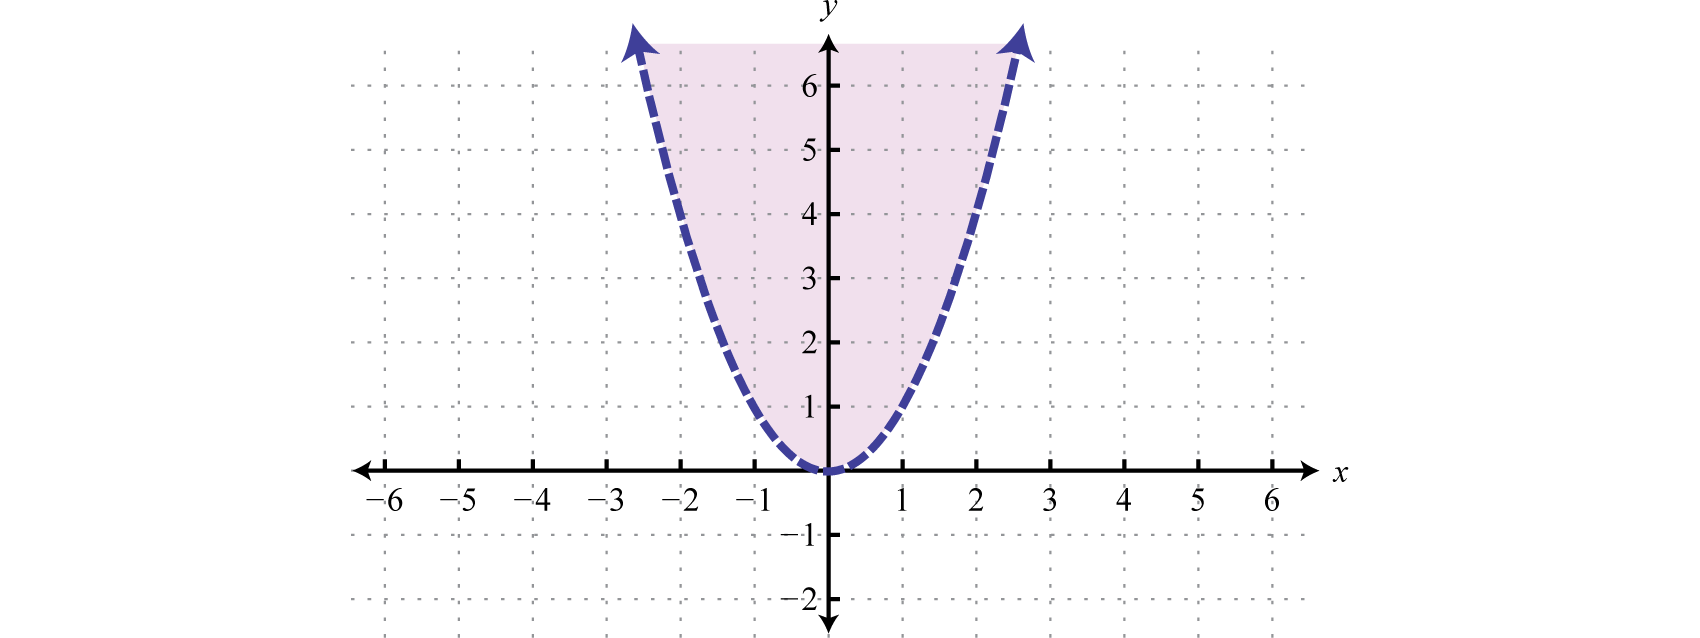
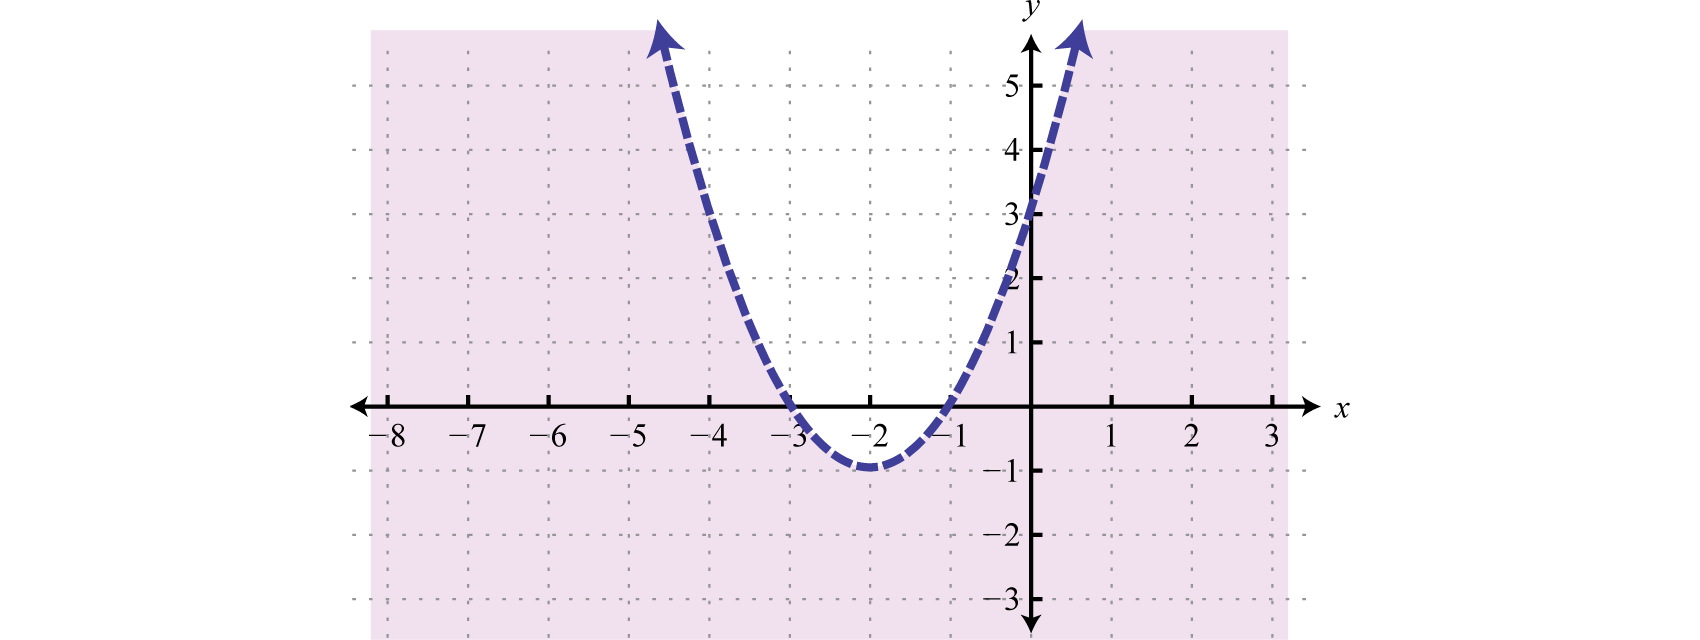
The steps are the same for nonlinear inequalities with two variables. Graph the boundary first and then test a point to determine which region contains the solutions.
Graph the solution set
Solution:
The boundary is a basic parabola shifted 2 units to the left and 1 unit down. Begin by drawing a dashed parabolic boundary because of the strict inequality.

Next, test a point.
Test point |
|
(0, 0) |
In this case, shade the region that contains the test point
Answer:
Graph the solution set
Solution:
The boundary is a basic parabola shifted 3 units up. It is graphed using a solid curve because of the inclusive inequality.
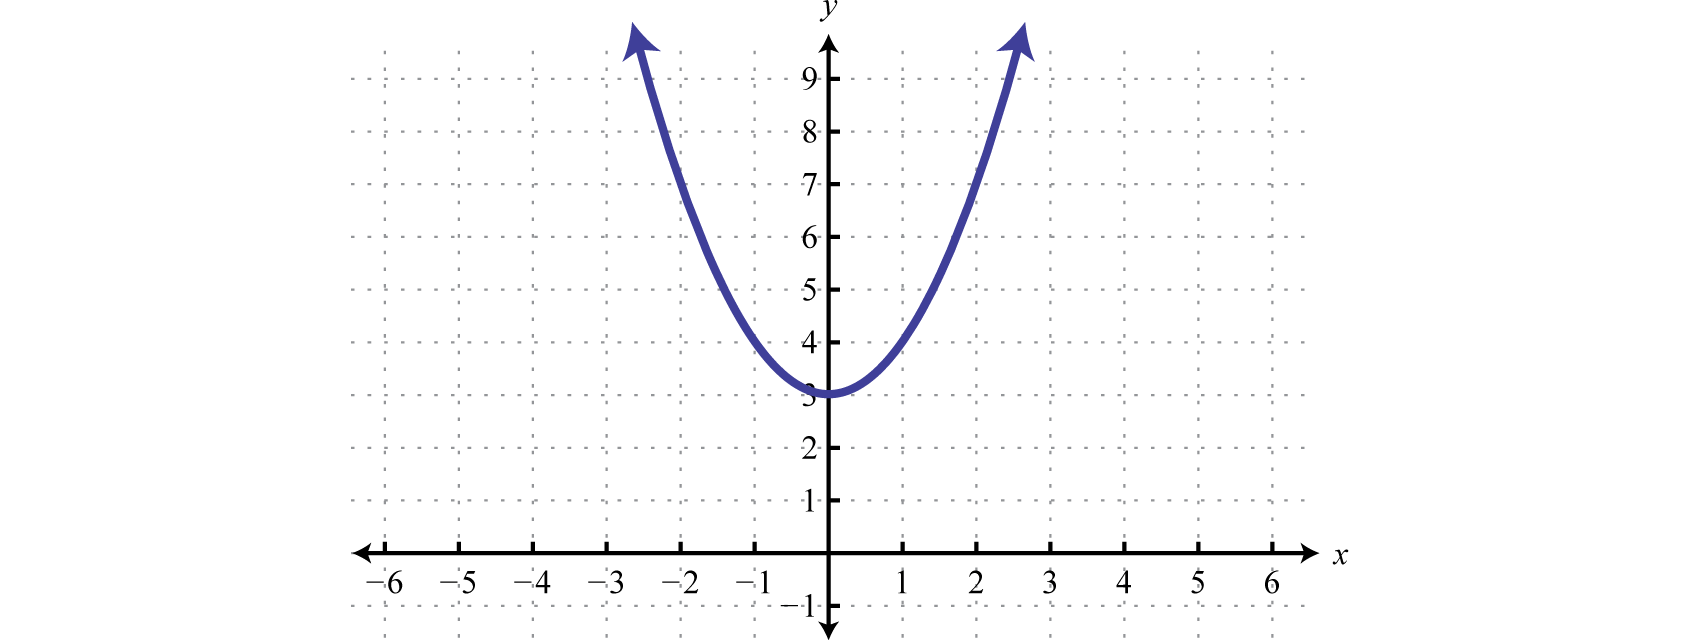
Next, test a point.
Test point |
|
(0, 0) |
In this case, shade the region that does not contain the test point
Answer:
Is the ordered pair a solution to the given inequality?
;
;
;
;
;
;
;
;
Graph the solution set.
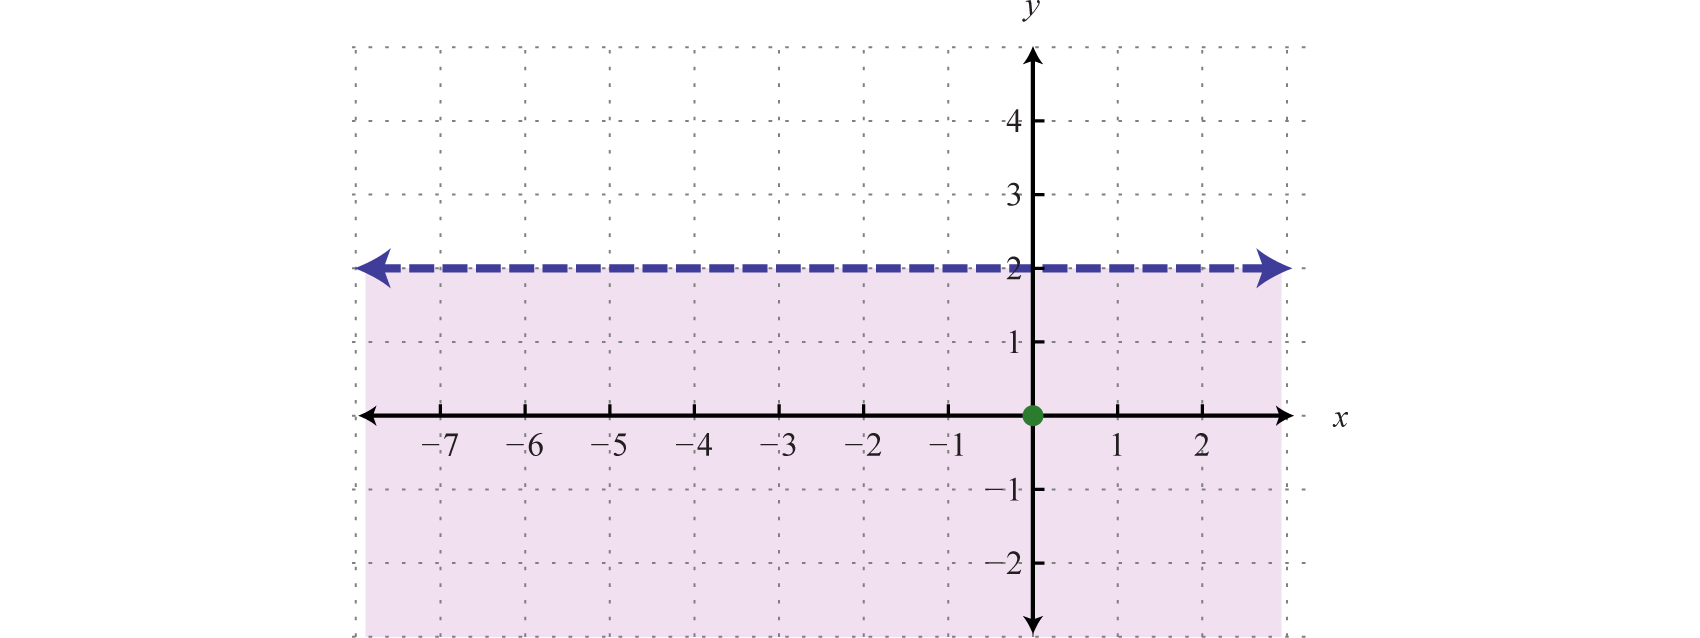
Write an inequality that describes all points in the upper half-plane above the x-axis.
Write an inequality that describes all points in the lower half-plane below the x-axis.
Write an inequality that describes all points in the half-plane left of the y-axis.
Write an inequality that describes all points in the half-plane right of the y-axis.
Write an inequality that describes all ordered pairs whose y-coordinate is at least k units.
Write an inequality that describes all ordered pairs whose x-coordinate is at most k units.
Graph the solution set.
A rectangular pen is to be constructed with at most 200 feet of fencing. Write a linear inequality in terms of the length l and the width w. Sketch the graph of all possible solutions to this problem.
A company sells one product for $8 and another for $12. How many of each product must be sold so that revenues are at least $2,400? Let x represent the number of products sold at $8 and let y represent the number of products sold at $12. Write a linear inequality in terms of x and y and sketch the graph of all possible solutions.
No
Yes
Yes
No
No
No
Yes
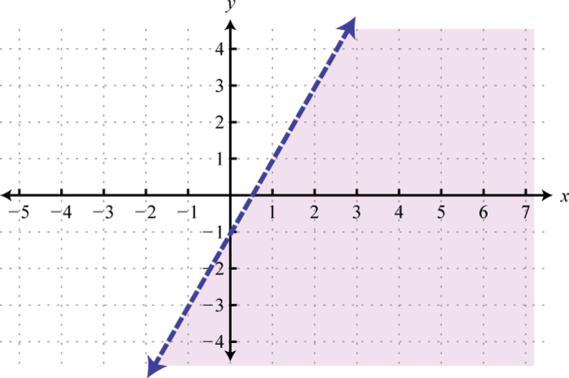
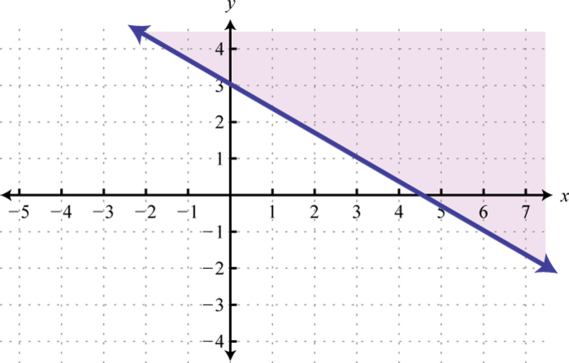
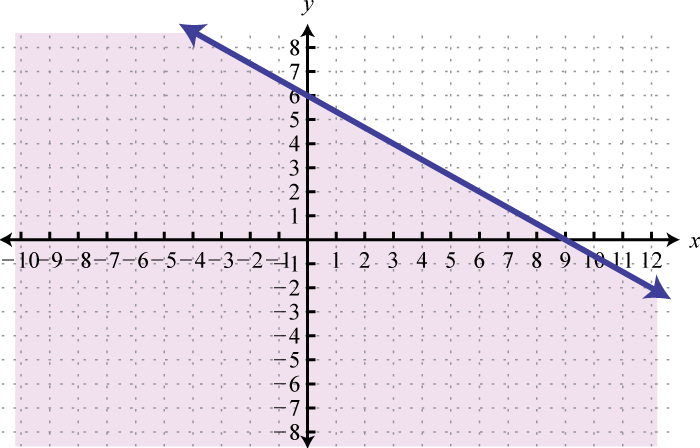
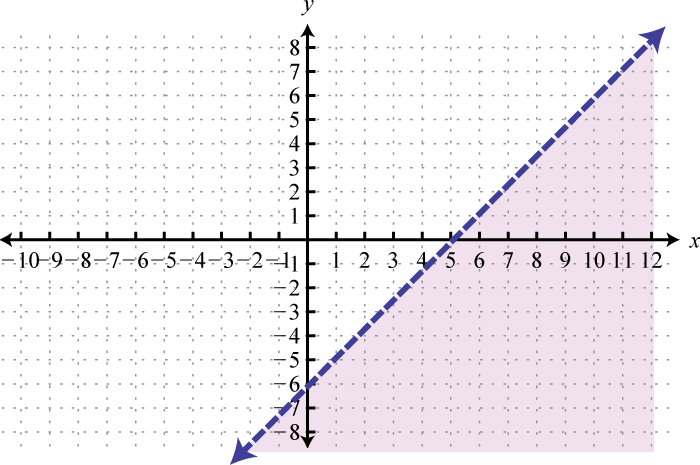
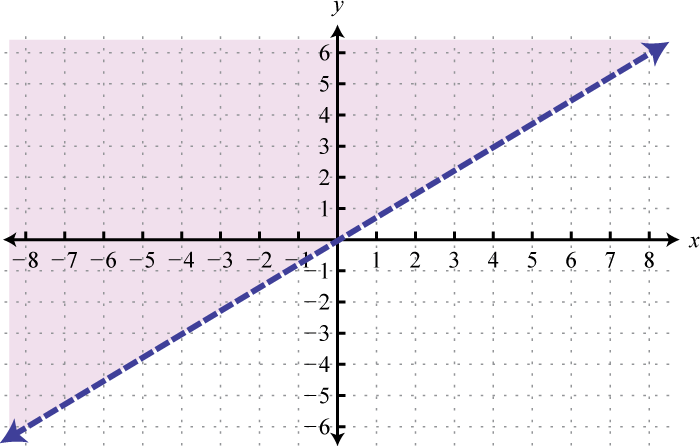
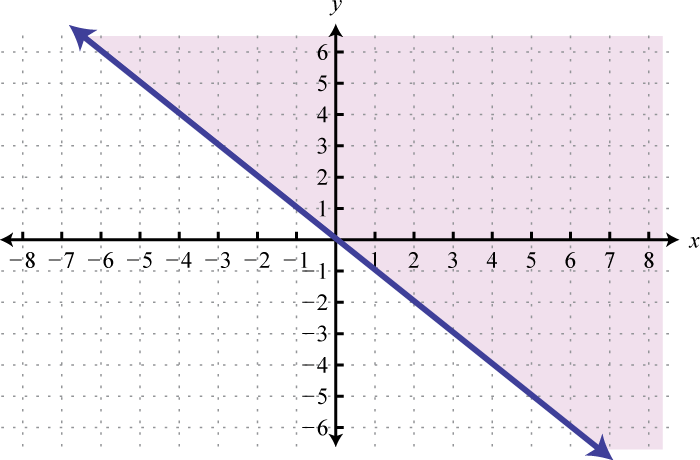
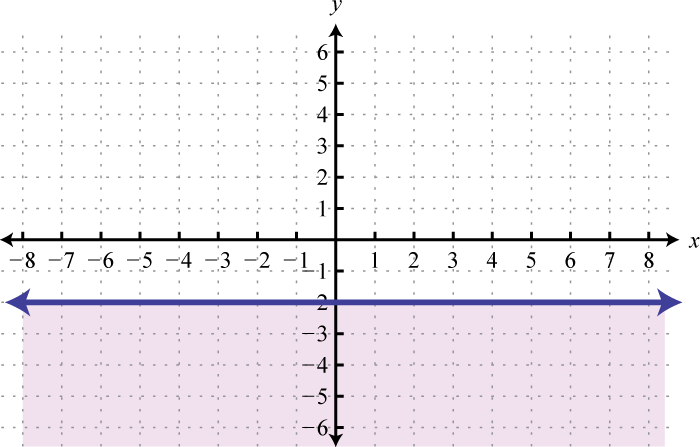
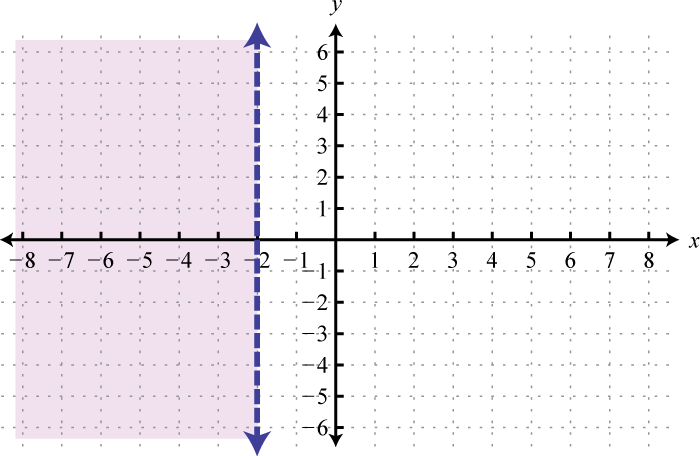
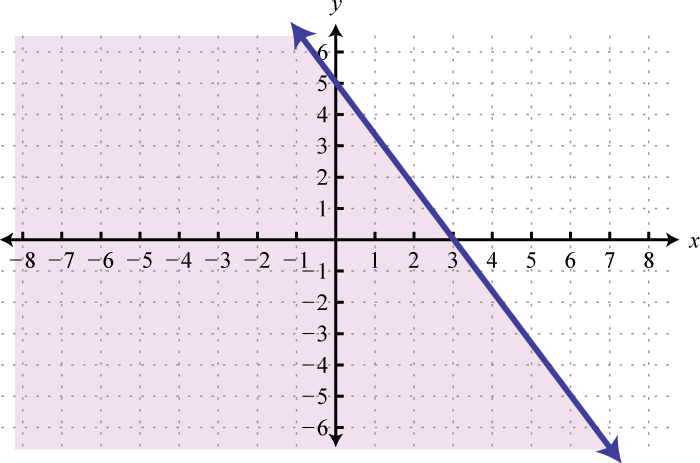
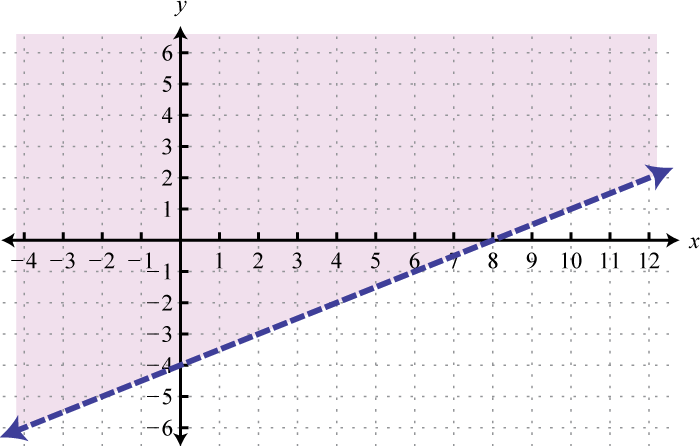
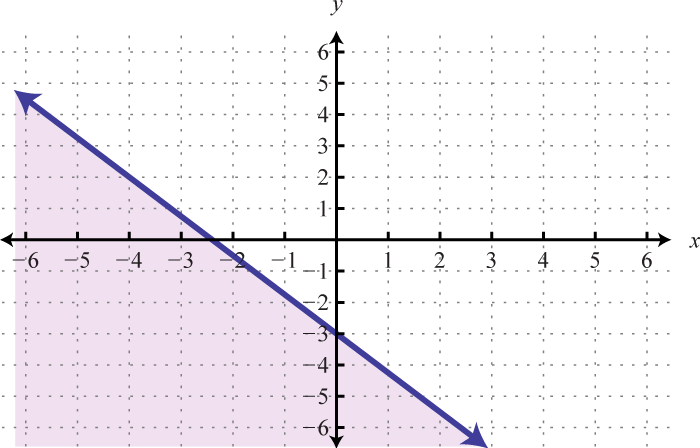
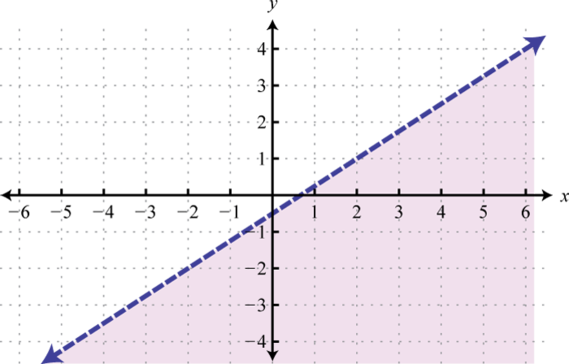
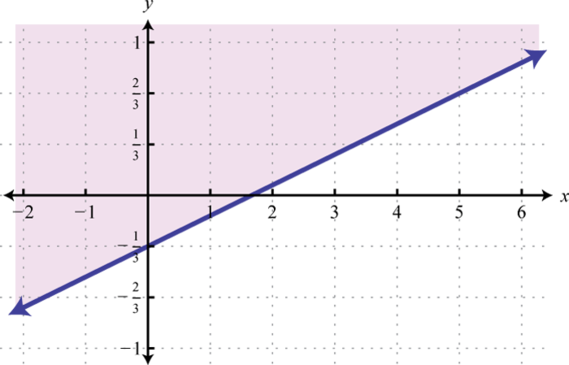
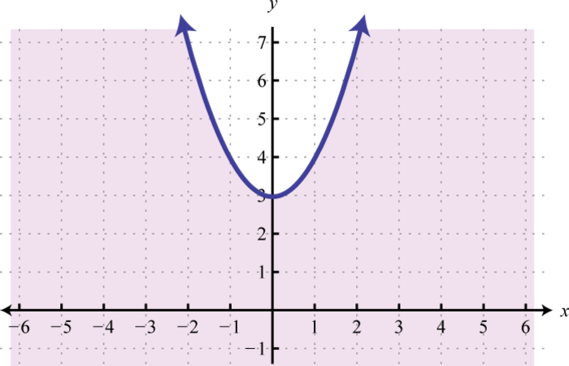
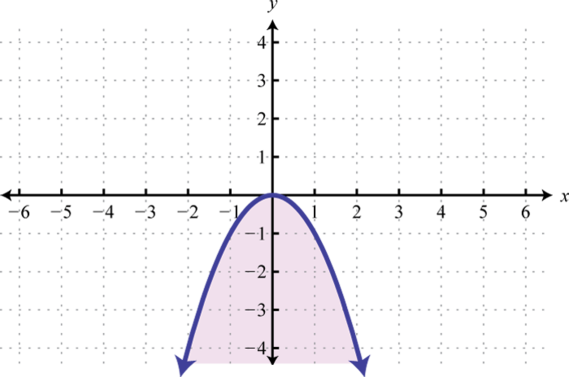
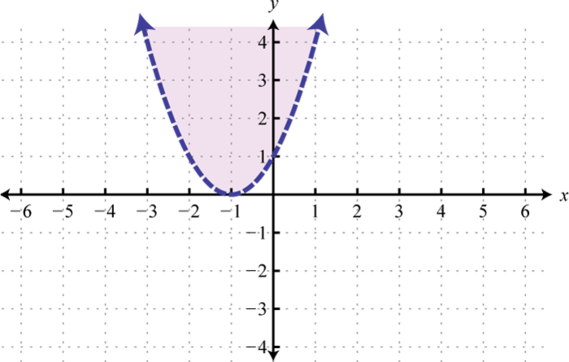
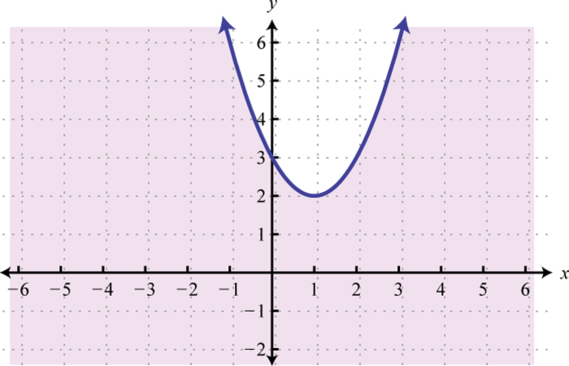
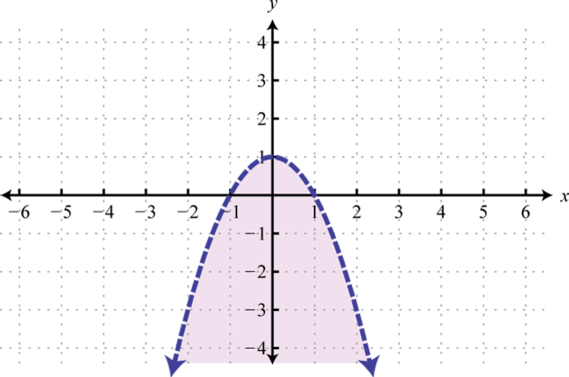
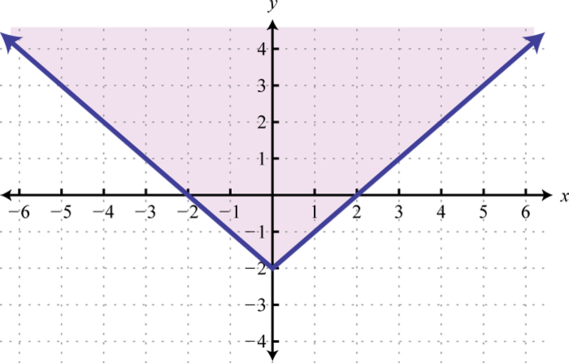
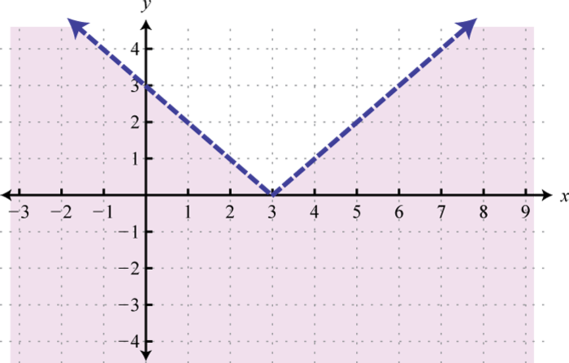
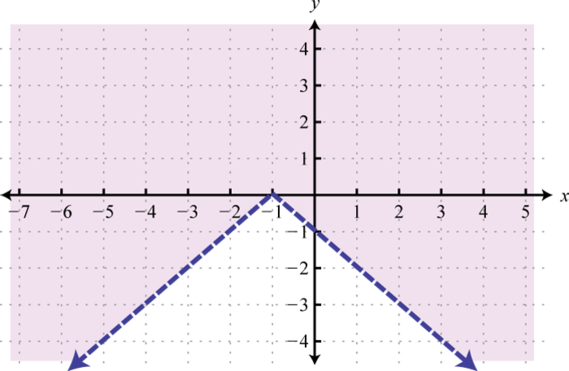
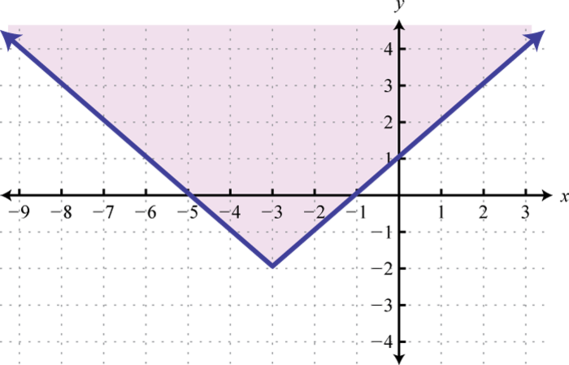
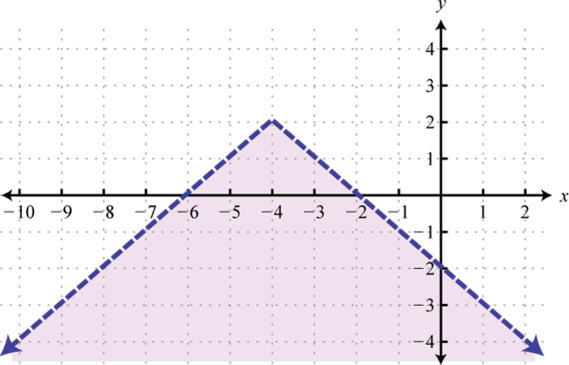
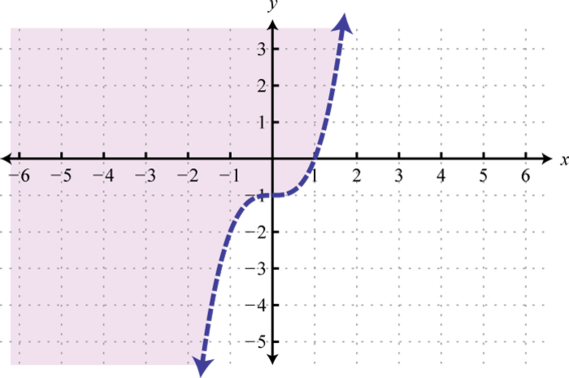
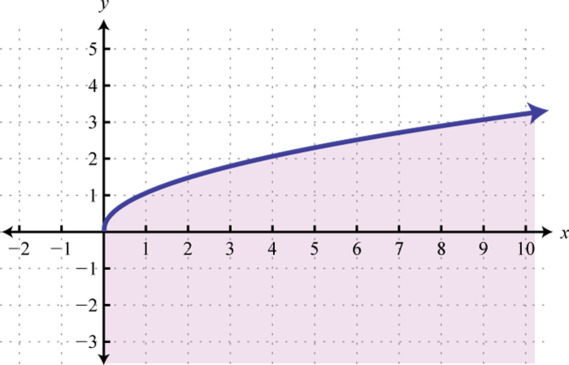
;
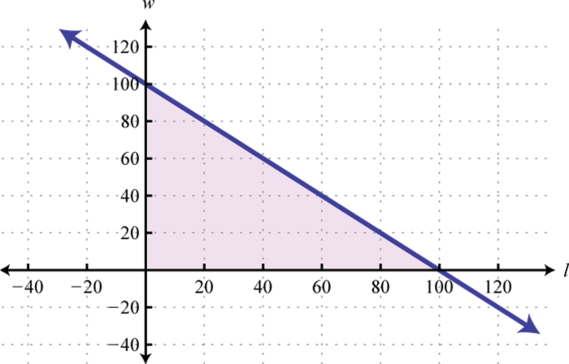
Determine the domain and range and state whether the function is a relation or not.
{(−4, −1), (−5, 3), (10, 3), (11, 2), (15, 1)}
{(−3, 0), (−2, 1), (1, 3), (2, 7), (2, 5)}
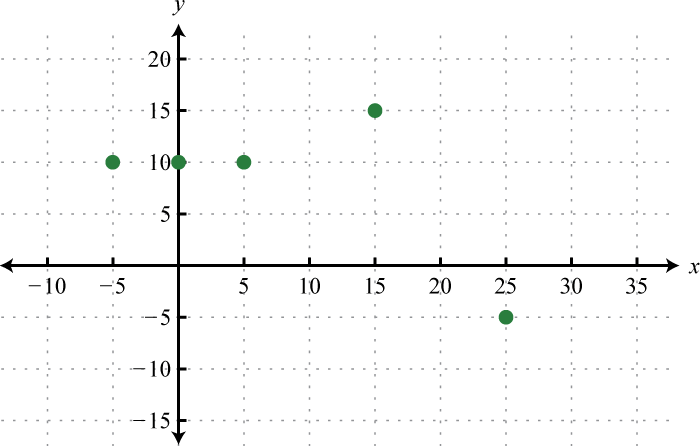
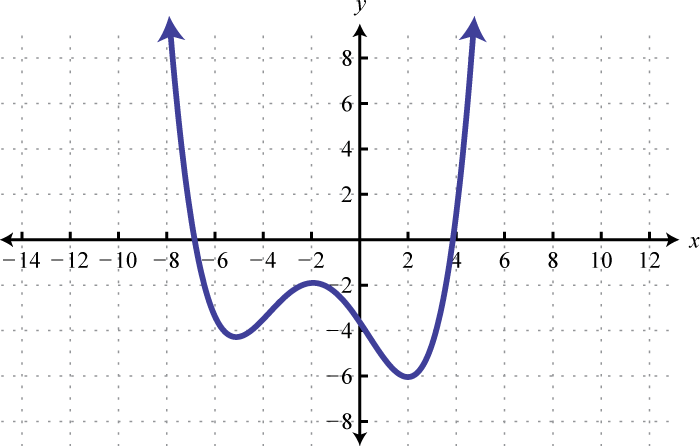
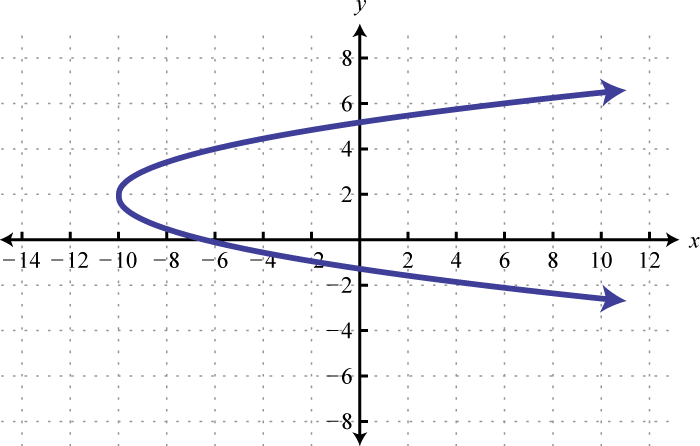
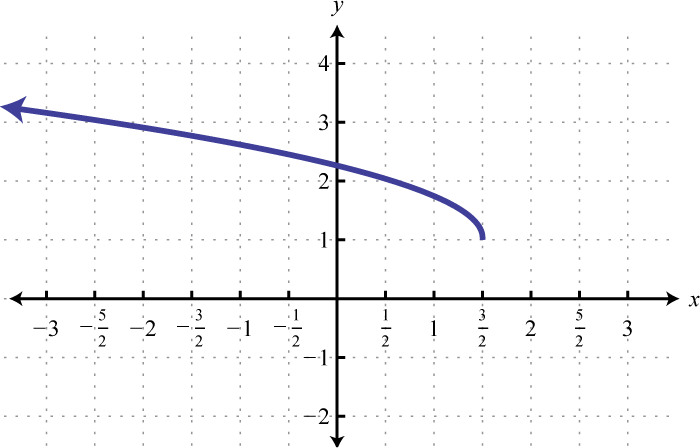
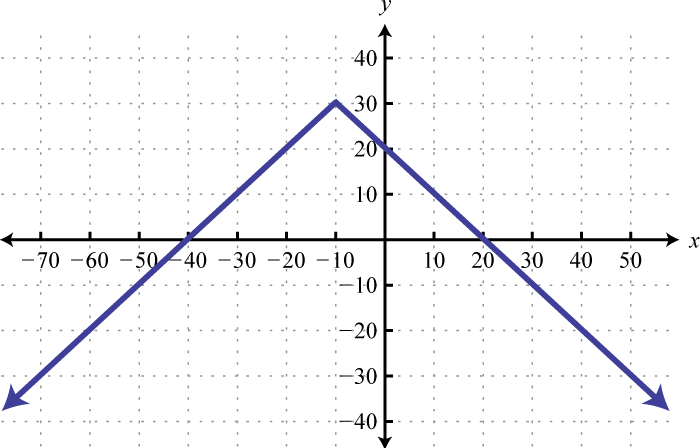
Evaluate.
; , , and
; , , and
; find , , and
; find , , and
; find , ,
; find , , and
; find x where
; find x where
Given the graph of below, find , , and
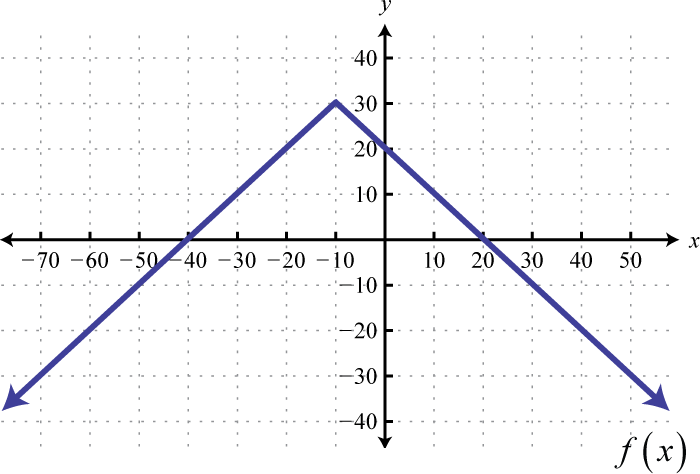
Given the graph of below, find x where and
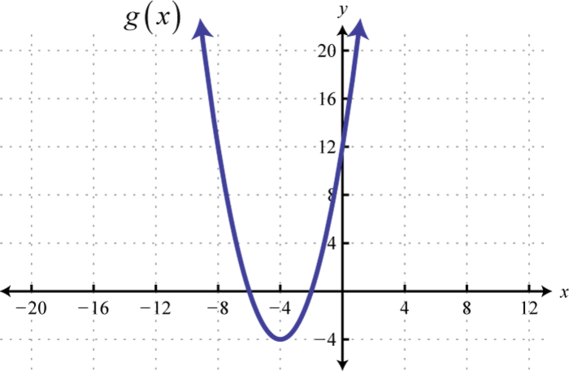
Graph and label the intercepts.
Graph the linear function and label the x-intercept.
Find the slope of the line passing through the given points.
and
and
and
and
and
and
Graph and on the same rectangular coordinate plane. Use the graph to find all values of x for which the given relation is true. Verify your answer algebraically.
, ;
, ;
, ;
, ;
Find the linear function passing through the given points.
and
and
and
and
Find the equation of the given linear function:
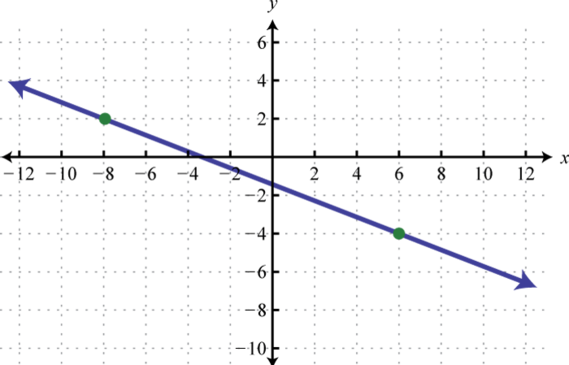
Find the equation of the given linear function:
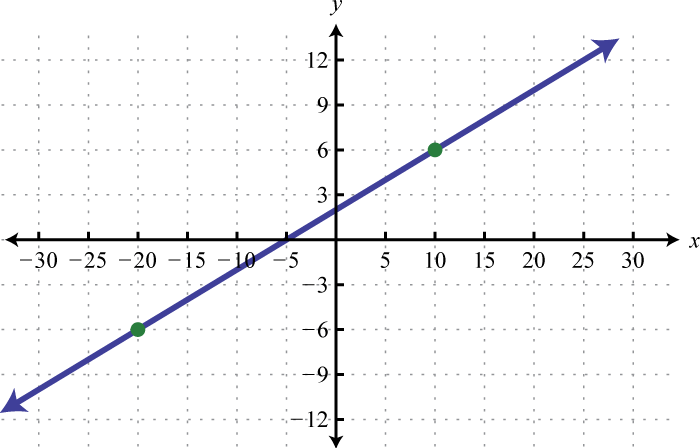
Find the equation of the line:
Parallel to and passing through
Parallel to and passing through
Parallel to and passing through
Perpendicular to and passing through
Perpendicular to and passing through
Perpendicular to and passing through
Use algebra to solve the following.
A taxi fare in a certain city includes an initial charge of $2.50 plus $2.00 per mile driven. Write a function that gives the cost of a taxi ride in terms of the number of miles driven. Use the function to determine the number of miles driven if the total fare is $9.70.
A salesperson earns a base salary of $1,800 per month and 4.2% commission on her total sales for that month. Write a function that gives her monthly salary based on her total sales. Use the function to determine the amount of sales for a month in which her salary was $4,824.
A certain automobile sold for $1,200 in 1980, after which it began to be considered a collector’s item. In 1994, the same automobile sold at auction for $5,750. Write a linear function that models the value of the automobile in terms of the number of years since 1980. Use it to estimate the value of the automobile in the year 2000.
A specialized industrial robot was purchased new for $62,400. It has a lifespan of 12 years, after which it will be considered worthless. Write a linear function that models the value of the robot. Use the function to determine its value after 8 years of operation.
In 1950, the U.S. Census Bureau estimated the population of Detroit, MI to be 1.8 million people. In 1990, the population was estimated to have decreased to 1 million. Write a linear function that gives the population of Detroit in millions of people, in terms of years since 1950. Use the function to estimate the year in which the population decreased to 700,000 people.
Online sales of a particular product are related to the number of clicks on its advertisement. It was found that 100 clicks in a week result in $112 of online sales, and that 500 clicks result in $160 of online sales. Write a linear function that models the online sales of the product based on the number of clicks on its advertisement. How many clicks are needed to result in $250 of weekly online sales from this product?
The cost in dollars of producing n bicycles is given by the formula If each bicycle can be sold for $132, write a function that gives the profit generated by producing and selling n bicycles. Use the formula to determine the number of bicycles that must be produced and sold to profit at least $10,000.
Determine the breakeven point from the previous exercise.
Find the ordered pair that specifies the point P.
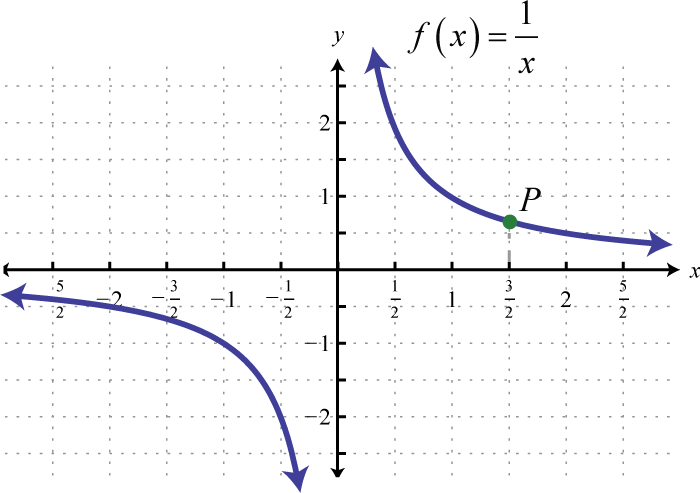
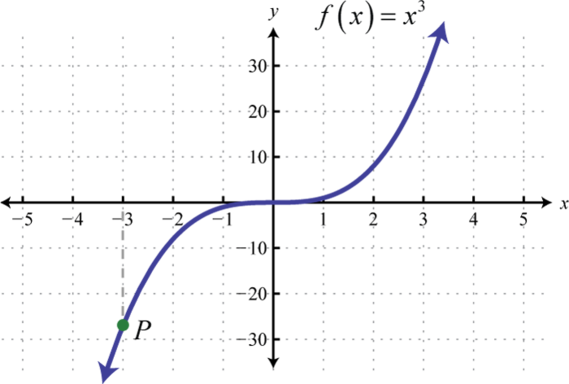

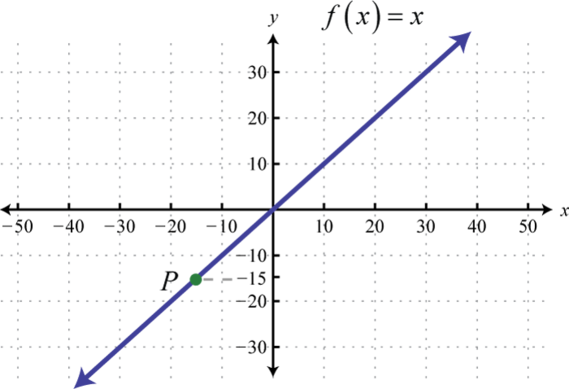
Graph the piecewise defined functions.
Evaluate.
Find , , and
Find , , and
Find , and
Find , and
Sketch the graph of the given function.
Write an equation that represents the function whose graph is given.
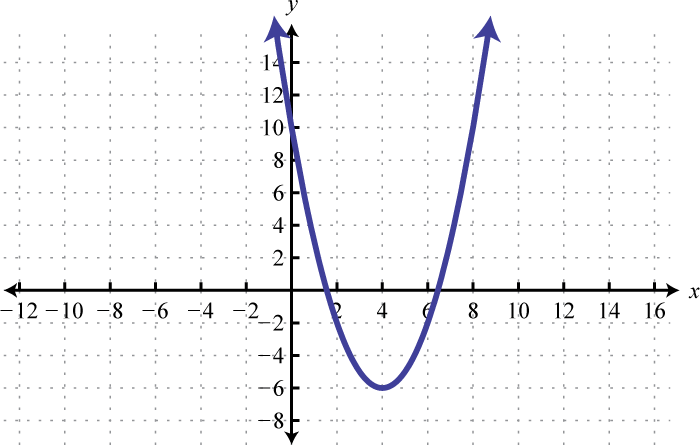
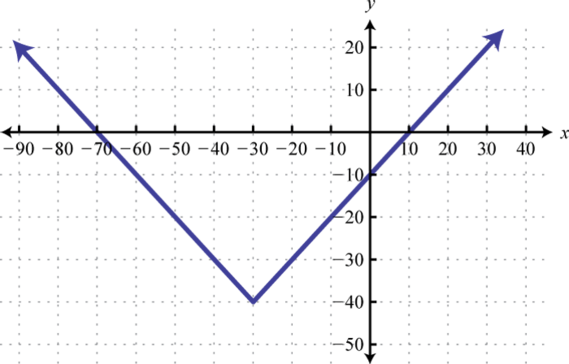
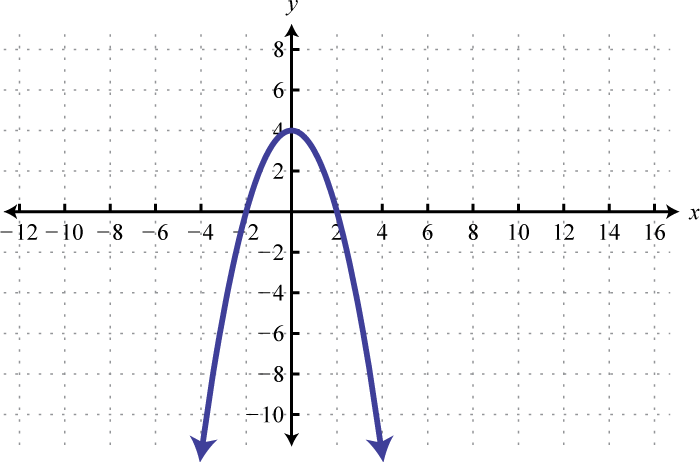
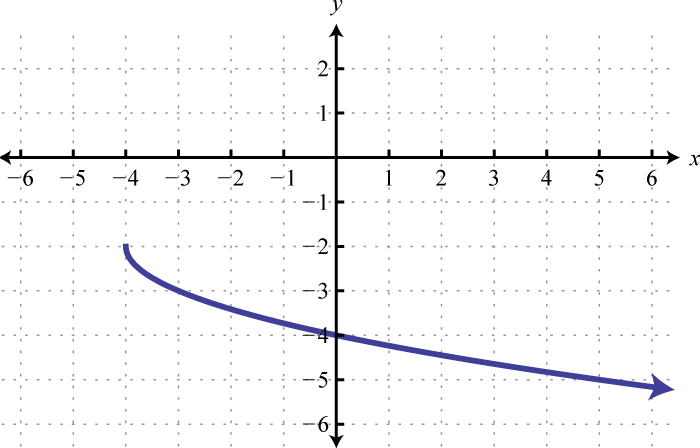
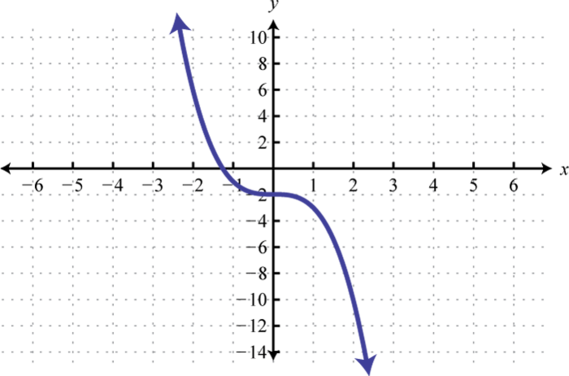
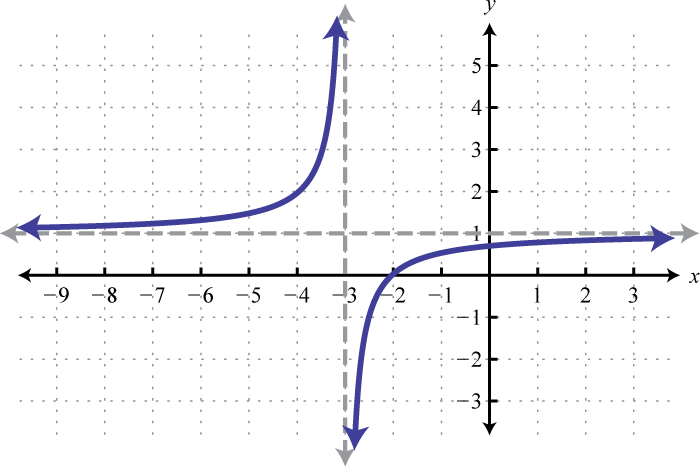
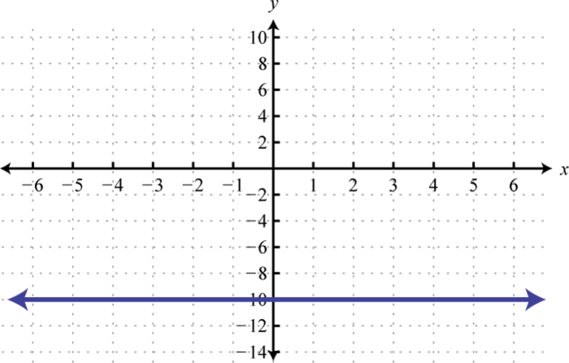
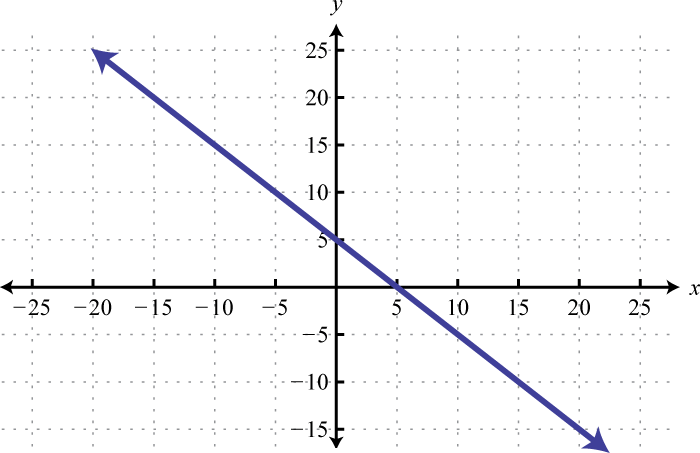
Solve.
Solve. Graph the solutions on a number line and give the corresponding interval notation.
Is the ordered pair a solution to the given inequality?
;
;
;
;
;
;
;
;
Graph the solution set.
Domain: {−5, −4, 10, 11, 15}; range:{−1, 1, 2, 3}; function: yes
Domain: {−5, 5, 15, 30}; range: {−5, 0, 5, 10, 15}; function: no
Domain: ; range: ; function: yes
Domain: ; range: ; function: yes
, , and
, , and
, ,
, ,
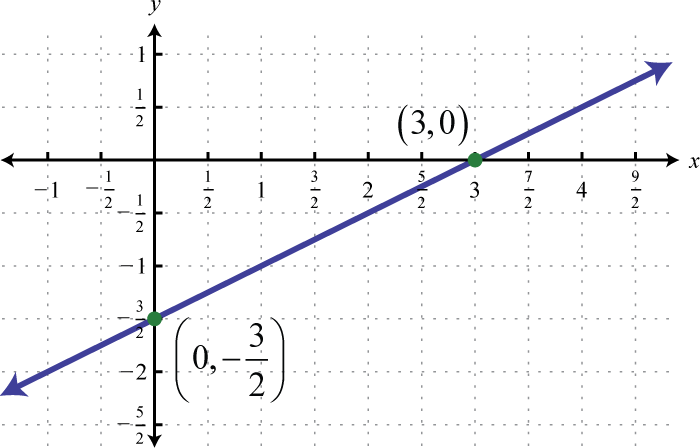
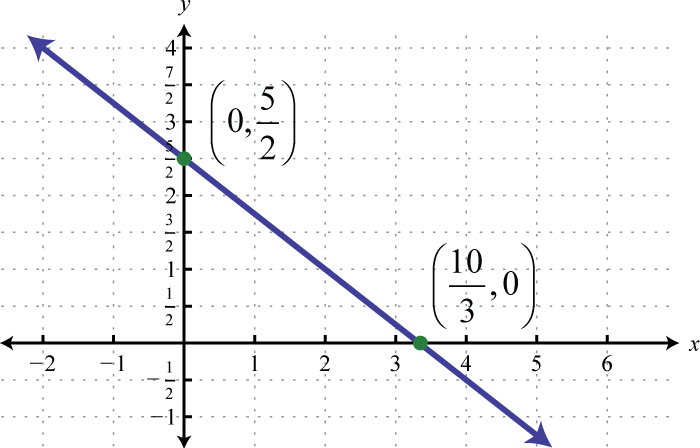
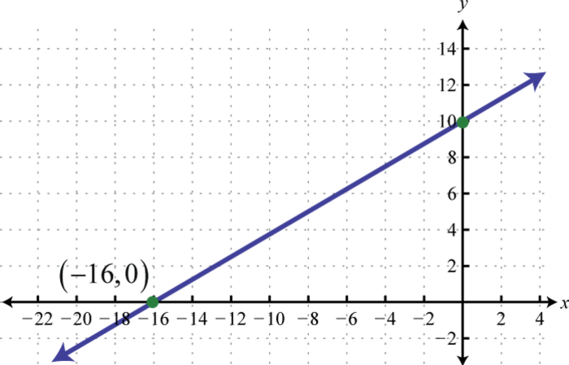
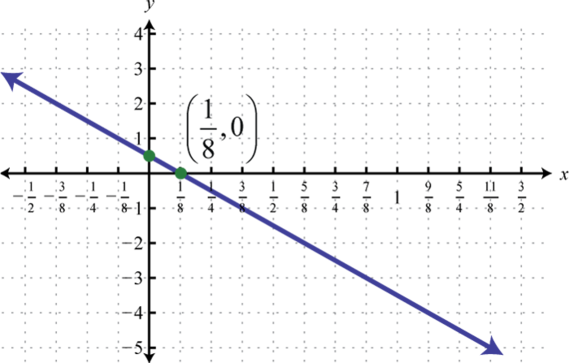
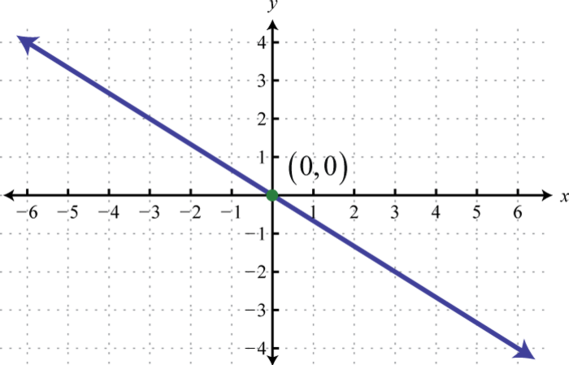
; 3.6 miles
; $7,700
; 2005
; 258 bicycles
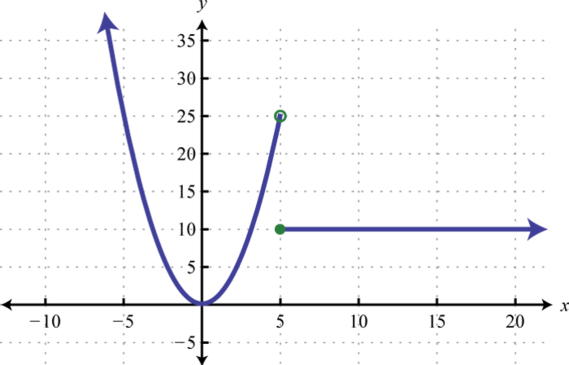
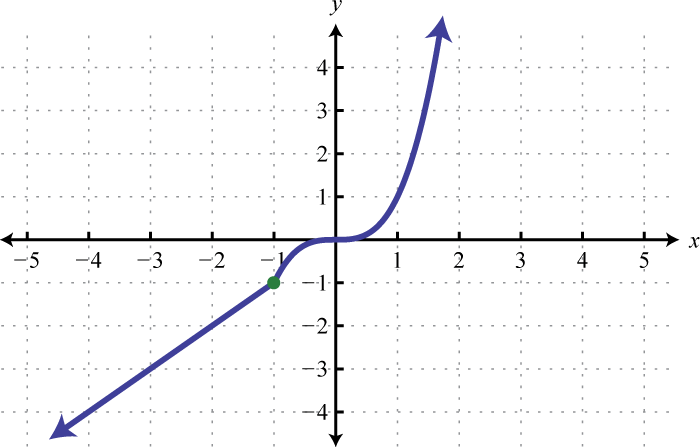
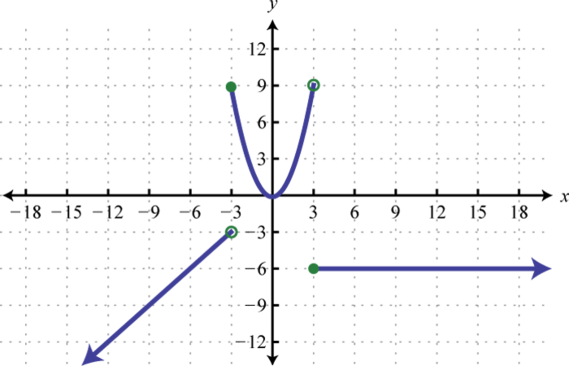
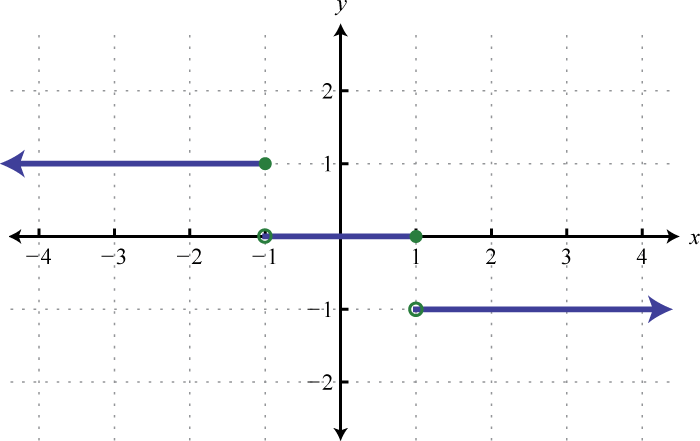
, ,
, ,
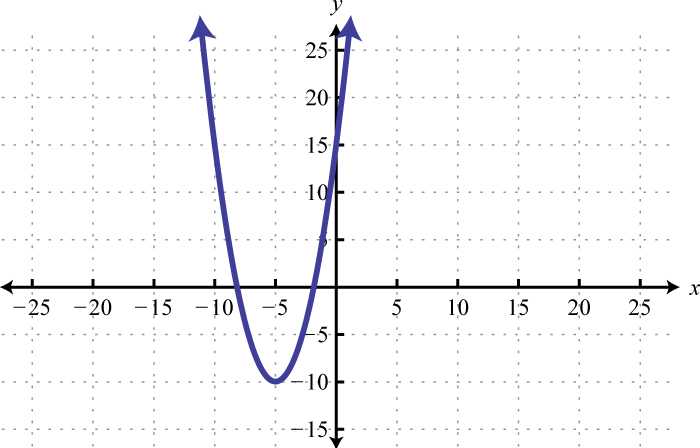
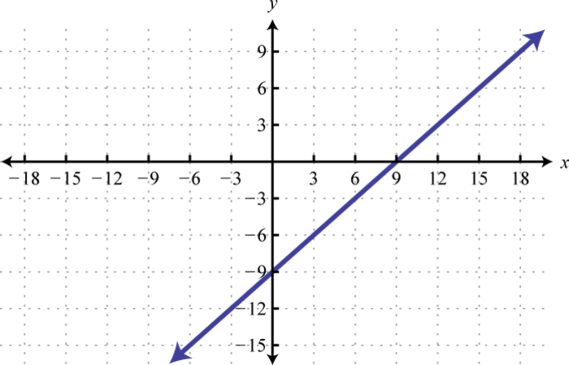
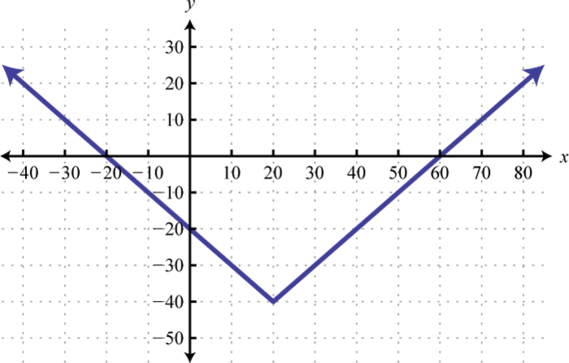
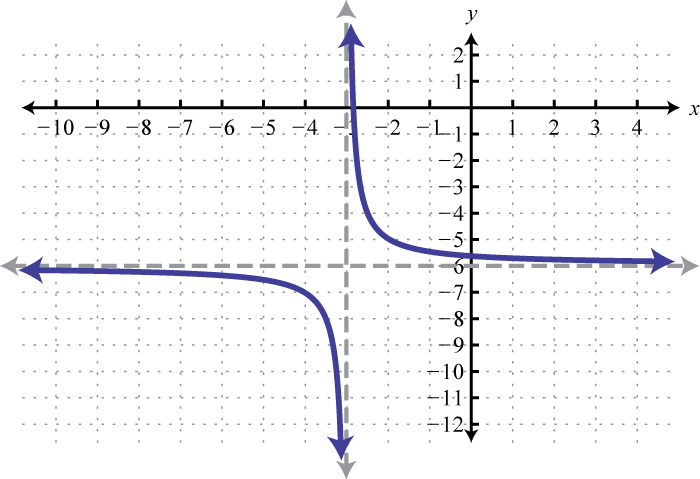
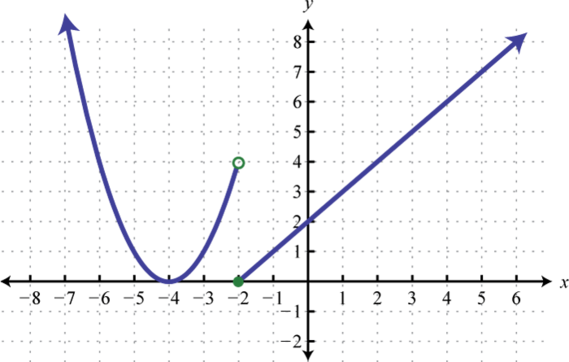
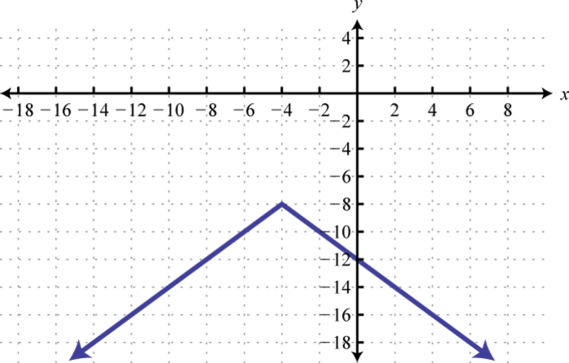
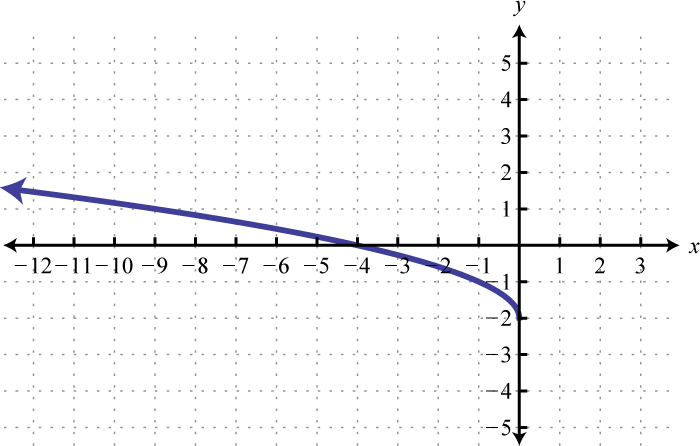
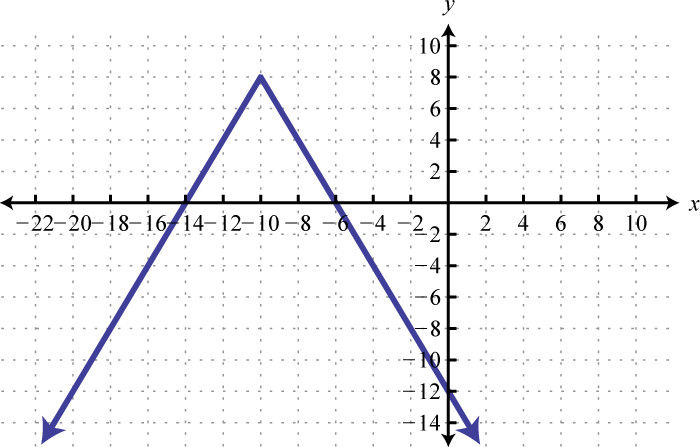
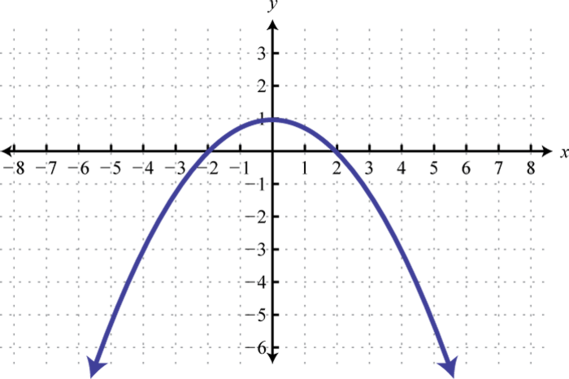
−2,
3, 5
2
−1,
−12,
;

;

;

Ø;

;

Yes
Yes
Yes
No
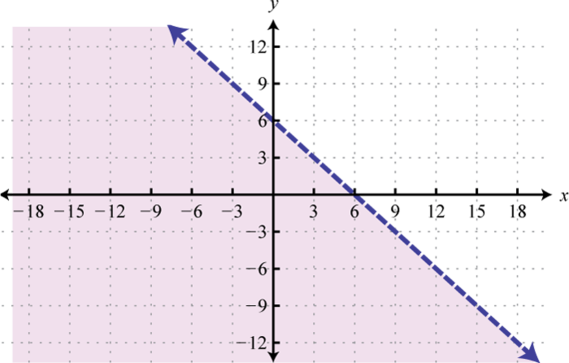
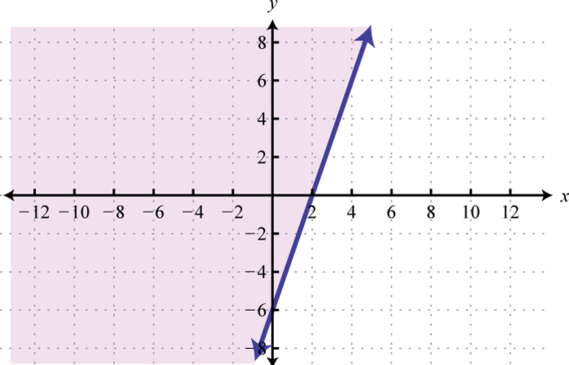
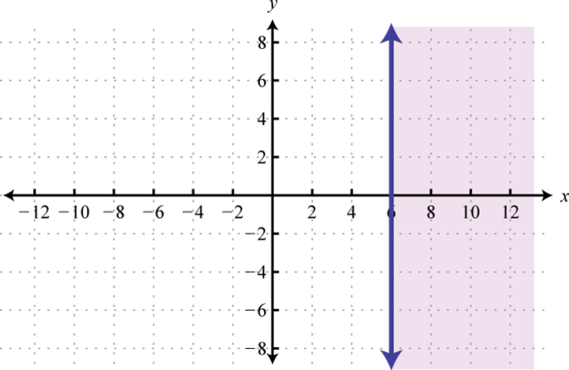
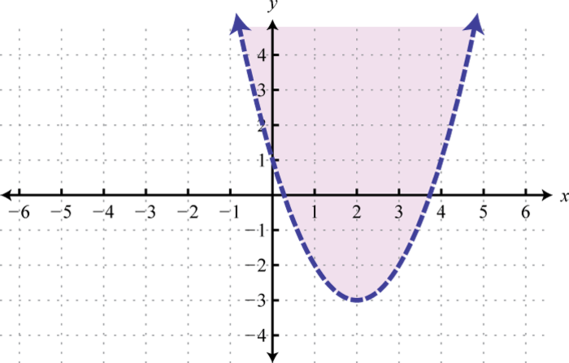
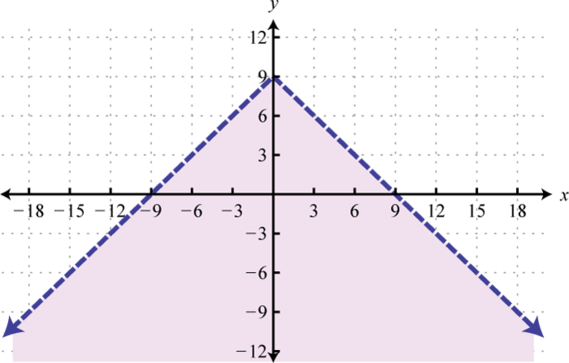
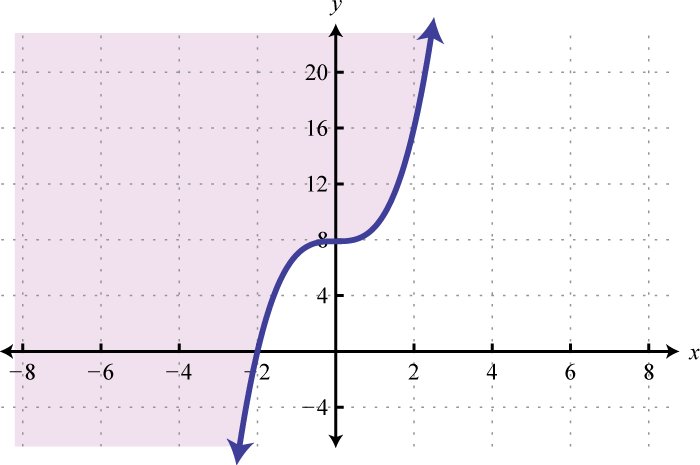
Determine whether or not the following graph represents a function or not. Explain.
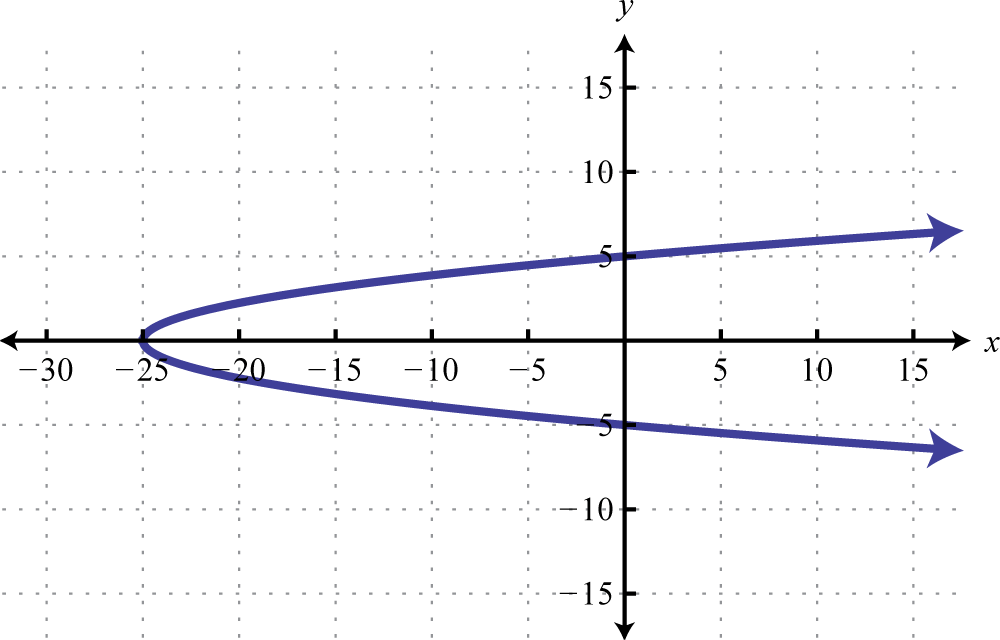
Determine the domain and range of the following function.
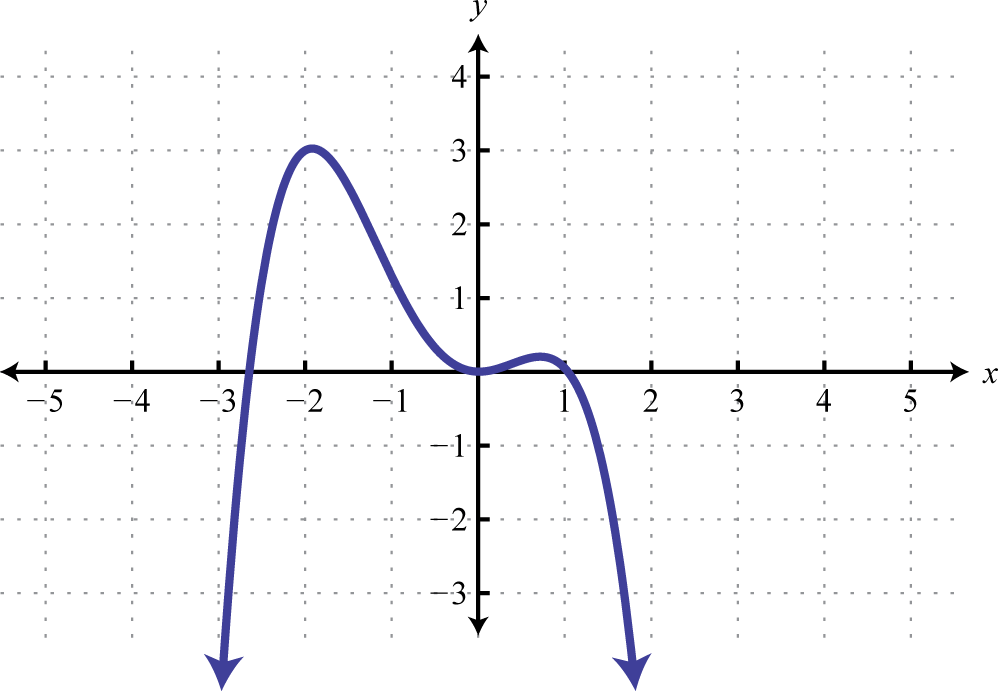
Given , find , , and
Given the graph of a function :
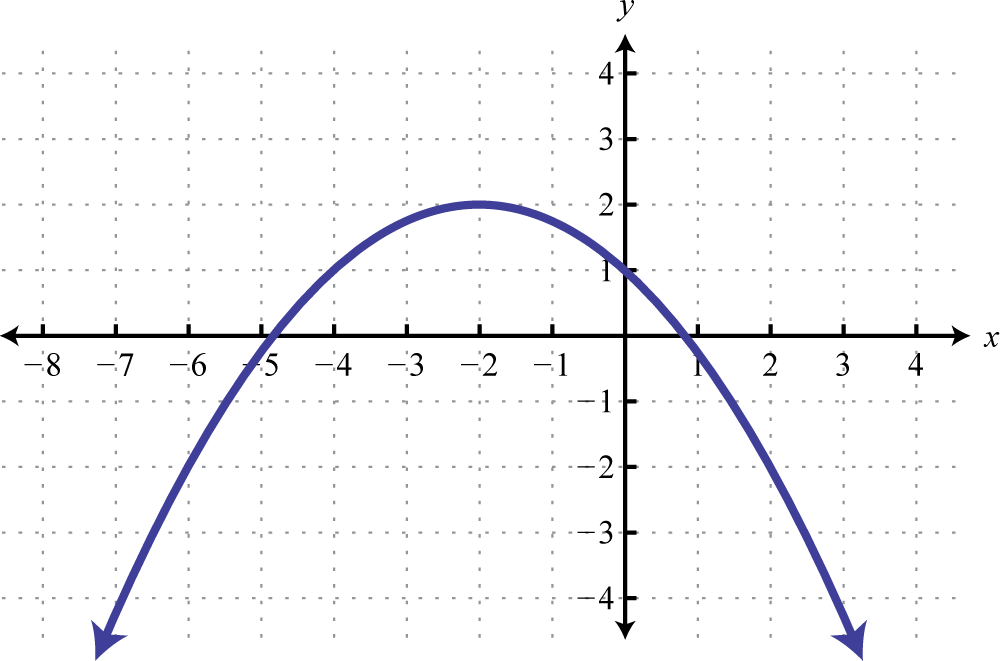
Graph and label the x-intercept.
Find a linear function passing through and
Find the equation of the line parallel to and passing through
Find the equation of the line perpendicular to and passing through
The annual revenue of a new web-services company in dollars is given by where n represents the number of users the company has registered. The annual maintenance cost of the company’s registered user base in dollars is given by the formula where n represents the users.
A particular search engine assigns a ranking to a webpage based on the number of links that direct users to the webpage. If no links are found, the webpage is assigned a ranking of 1. If 40 links are found directing users to the webpage, the search engine assigns a page ranking of 5.
Use the transformations to sketch the graph of the following functions and state the domain and range.
Given the graph, determine the function definition and its domain and range:
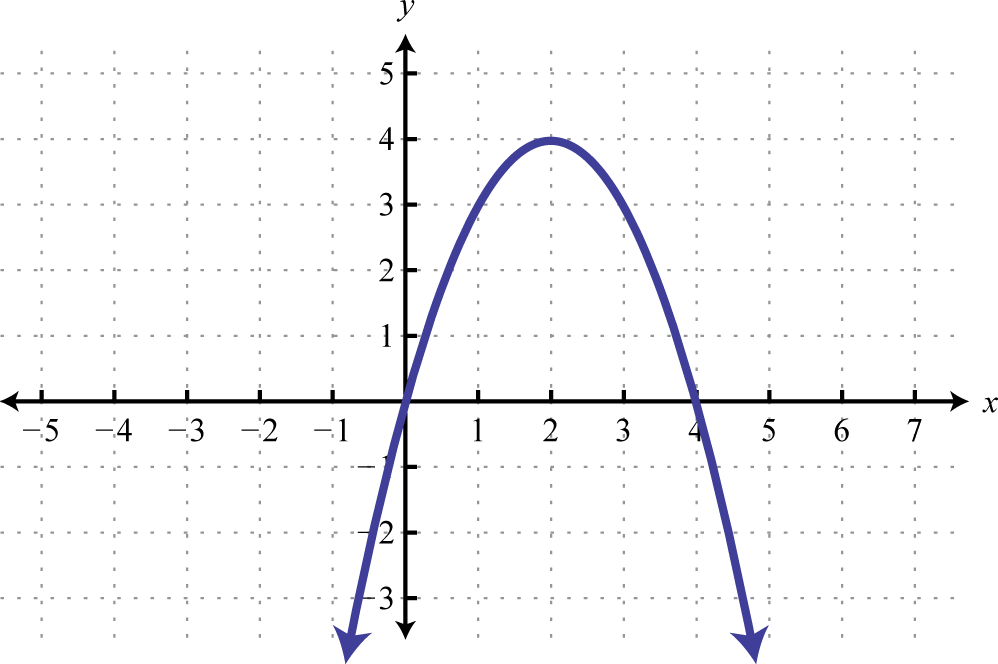
Sketch the graph:
Sketch the graph:
Solve.
Solve and graph the solution set.
Graph the solution set.
The graph is not a function; it fails the vertical line test.
, , and
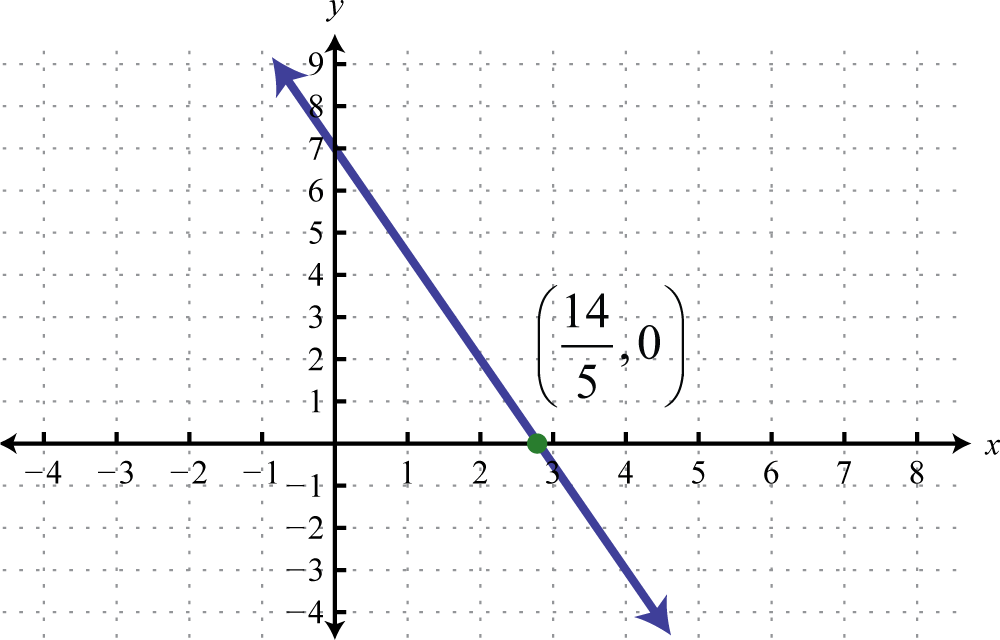
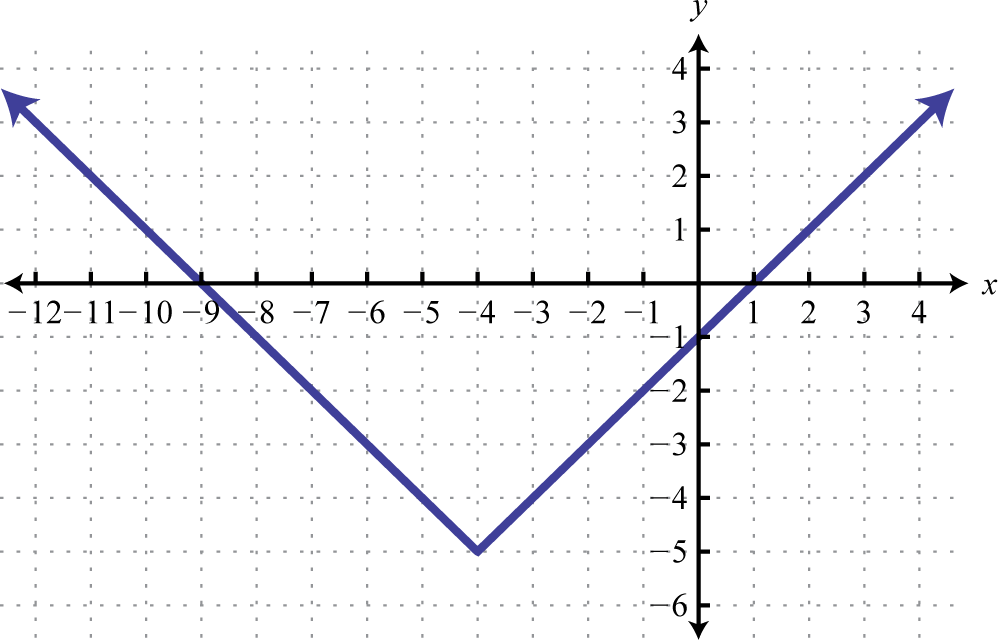
Domain: ; range:
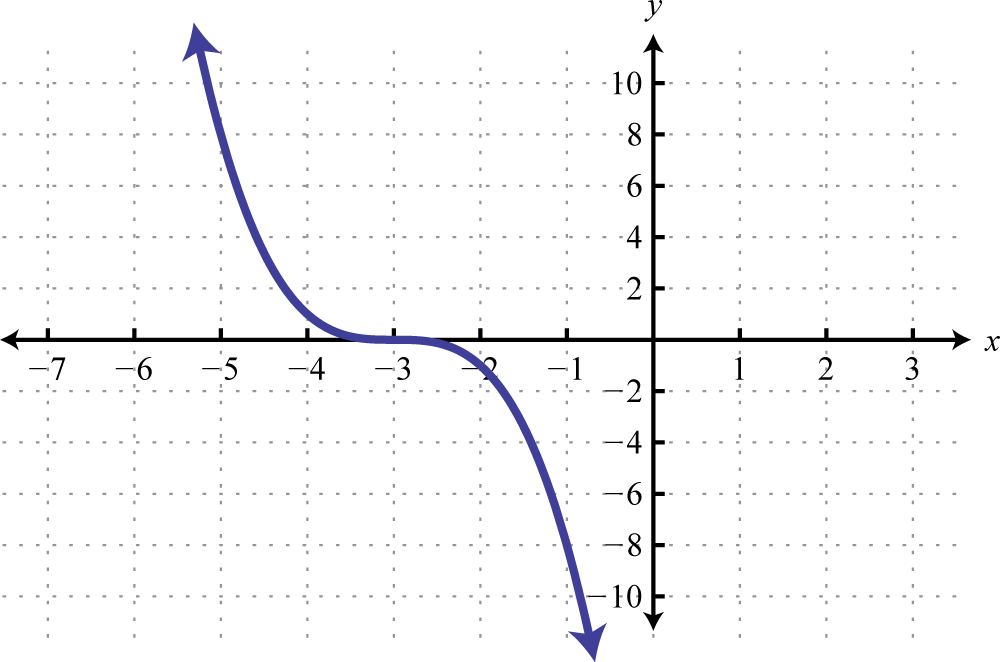
Domain: ; range:
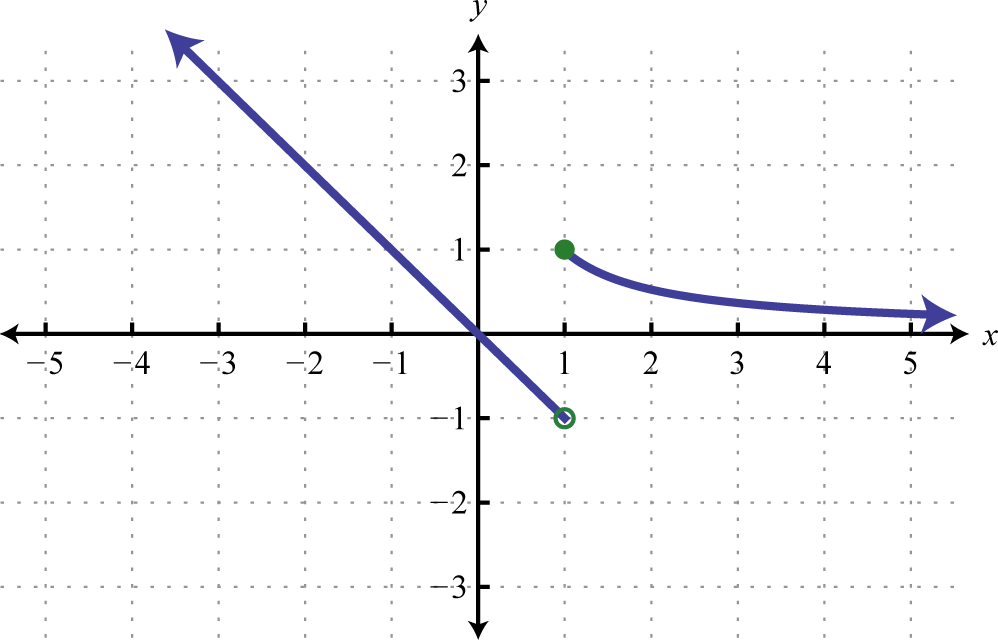
−2, 3
;

Ø;