
connections | networks | computers | names | numbers | news | Web servers | security | capacity
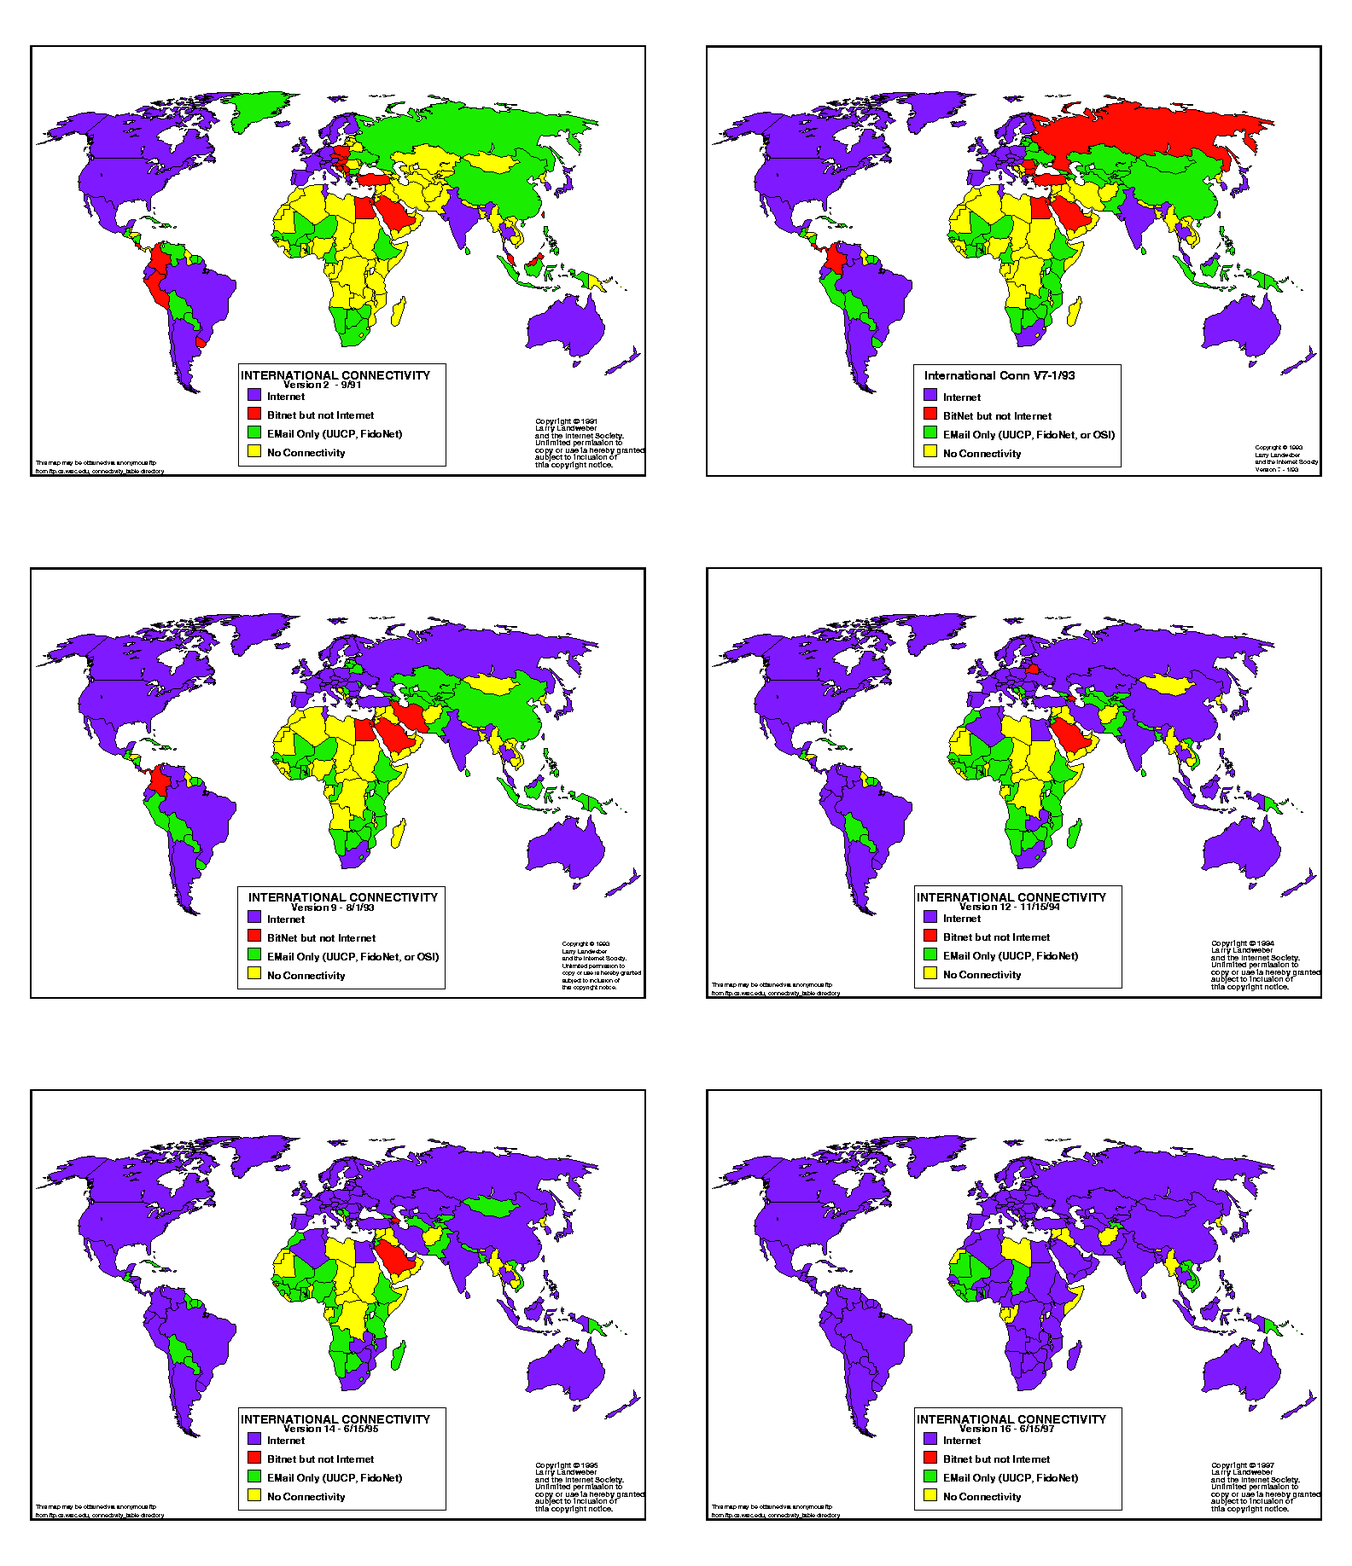
During the 1990s, the Internet has spread rapidly to most countries in the world, as can be seen from Larry Landweber's map of international connections. E-mail and BITNET/EARN, with their less demanding services, reached most countries slightly ahead of the Internet.
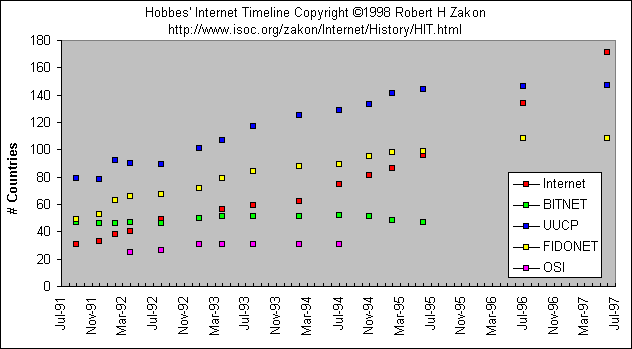
This section provides more precise figures for the above animation. We can see that BITNET and especially the OSI networks, which once aspired to form the worldwide network of the future, have fallen out of use. Meanwhile, FIDONET and UUCP have continued to exist alongside the Internet, as low-cost dial-up networks for e-mail and news, although the Internet has expanded to almost all the nations of the globe in recent years.
Worldwide Networks Growth: (I)nternet (B)ITNET (U)UCP (F)IDONET (O)SI
           ____# Countries____                         ____# Countries____

   Date     I   B   U   F   O                  Date     I   B   U   F   O

   -----   --- --- --- --- ---                 -----   --- --- --- --- ---

   09/91    31  47  79  49                     02/94    62  51 125  88  31

   12/91    33  46  78  53                     07/94    75  52 129  89  31

   02/92    38  46  92  63                     11/94    81  51 133  95  --

   04/92    40  47  90  66  25                 02/95    86  48 141  98  --

   08/92    49  46  89  67  26                 06/95    96  47 144  99  --

   01/93    50  50 101  72  31                 06/96   134  -- 146 108  --

   04/93    56  51 107  79  31                 07/97   171  -- 147 108  --

   08/93    59  51 117  84  31
Figure: Worldwide Networks Growth
Internet | Networks | WWW | USENET | Security
Internet growth:
   Date       Hosts        |      Date       Hosts     Networks   Domains

   -----    ---------      +      -----    ---------   --------  ---------

    1969            4      |      07/89      130,000        650      3,900

   04/71           23      |      10/89      159,000        837

   06/74           62      |      10/90      313,000      2,063      9,300

   03/77          111      |      01/91      376,000      2,338

   08/81          213      |      07/91      535,000      3,086     16,000

   05/82          235      |      10/91      617,000      3,556     18,000

   08/83          562      |      01/92      727,000      4,526

   10/84        1,024      |      04/92      890,000      5,291     20,000

   10/85        1,961      |      07/92      992,000      6,569     16,300

   02/86        2,308      |      10/92    1,136,000      7,505     18,100

   11/86        5,089      |      01/93    1,313,000      8,258     21,000

   12/87       28,174      |      04/93    1,486,000      9,722     22,000

   07/88       33,000      |      07/93    1,776,000     13,767     26,000

   10/88       56,000      |      10/93    2,056,000     16,533     28,000

   01/89       80,000      |      01/94    2,217,000     20,539     30,000

                           |      07/94    3,212,000     25,210     46,000

                           |      10/94    3,864,000     37,022     56,000

                           |      01/95    4,852,000     39,410     71,000

                           |      07/95    6,642,000     61,538    120,000

                           |      01/96    9,472,000     93,671    240,000

                           |      07/96   12,881,000    134,365    488,000

                           |      01/97   16,146,000               828,000

                           |      07/97   19,540,000             1,301,000

                           |      01/98   29,670,000

                           |      07/98   36,739,000


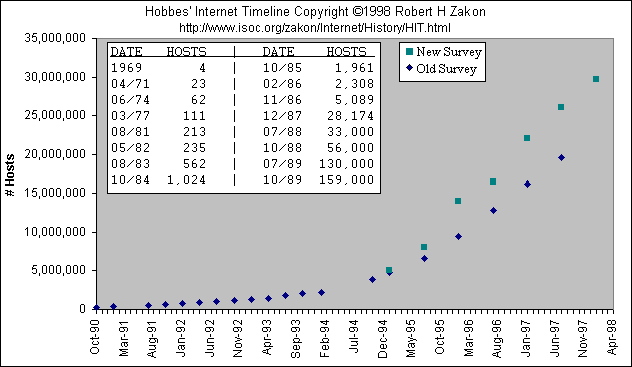
  Note: A more accurate survey mechanism was developed in 1/98; corrected

        numbers are shown in the chart below dating back to 1/95.

        For further info, see Sources section below.
Figure: Internet Hosts
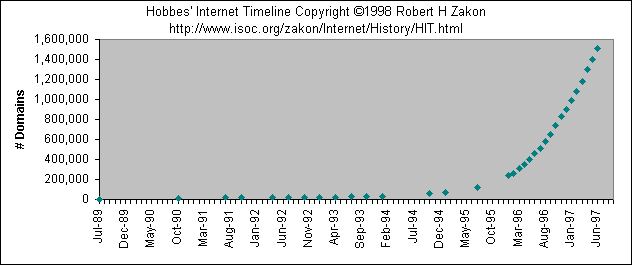
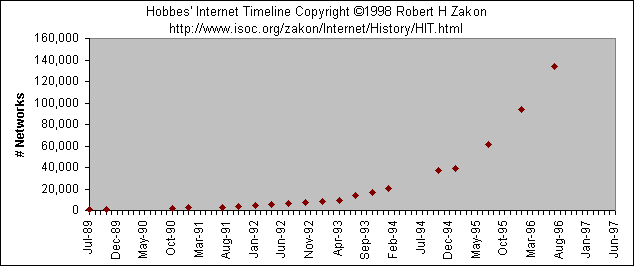
This figure largely reflects the growth in the number of organisations
Figure: Internet Domains
An Internet network address is a kind of postcode for computer networks. This figure largely indicates the growth in the work done by the routers in the backbone network, since they have to know where to send packets for each network. New methods are constantly being developed to reduce the load, so that the Internet will not crash because of its own expansion, as some have predicted.
Figure: Internet Networks
WWW Growth:
   Date     Sites     |   Date     Sites     |   Date     Sites

   -----  ----------  +   -----  ----------  +   -----  ----------

   06/93         130  |   11/96     525,906  |   10/97   1,466,906

   12/93         623  |   12/96     603,367  |   11/97   1,553,998

   06/94       2,738  |   01/97     646,162  |   12/97   1,681,868

   12/94      10,022  |   02/97     739,688  |   01/98   1,834,710

   06/95      23,500  |   03/97     883,149  |   02/98   1,920,933

   01/96     100,000  |   04/97   1,002,612  |   03/98   2,084,473

   06/96     252,000  |   05/97   1,044,163  |   04/98   2,215,195

   07/96     299,403  |   06/97   1,117,255  |

   08/96     342,081  |   07/97   1,203,096  |

   09/96     397,281  |   08/97   1,269,800  |

   10/96     462,047  |   09/97   1,364,714  |
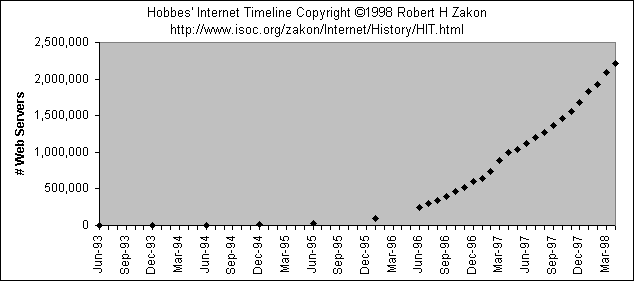
Figure: WWW Server Growth
This figure indicates the growth in the Internet 'Letters Page', i.e. public discussion groups. This service, which originated in the UUCP network system, now distributes hundreds of thousands of messages (posts) a day to hundreds of thousands of servers (sites) in various parts of the world. It is possible to keep up with the discussion because users can group their messages hierarchically into 'groups' representing tens of thousands of different topics.
USENET Growth:
   Date  Sites  ~MB  ~Posts  Groups  |  Date   Sites   ~MB   ~Posts  Groups

   ----  -----  ---  ------  ------  +  ----  -------  ---   ------  ------

   1979      3            2       3  |  1987    5,200    2      957     259

   1980     15           10          |  1988    7,800    4     1933     381

   1981    150  0.05     20          |  1990   33,000   10    4,500   1,300

   1982    400           35          |  1991   40,000   25   10,000   1,851

   1983    600          120          |  1992   63,000   42   17,556   4,302

   1984    900          225          |  1993  110,000   70   32,325   8,279

   1985  1,300  1.0     375          |  1994  180,000  157   72,755  10,696

   1986  2,200  2.0     946     241  |  1995  330,000  586  131,614


      ~ approximate: MB - megabytes per day, Posts - articles per day
Among the millions of Internet users, there are some lost individuals who are unable to act according to the ethical rules of the Net. Fortunately, however, they are few in number compared with the many tens of millions of computers in the Internet. This is presumably a result of the high ethical standards of the majority of users, as well as of the firewalls erected by most organisations to act as gatekeepers. In order to coordinate the resolution of security problems, CERT (Computer Emergency Response Team) centres have been set up, which can be contacted if you suspect computer crime. The CERT network also provides information about any security problems detected, mostly in software, and ways of correcting them. The FUNET's CERT can be found at the addresses http://www.cert.funet.fi and cert@cert.funet.fi
Security (CERT) Incidents:
                     1988 1989 1990 1991 1992 1993 1994 1995 1996 1997

                   + ---- ---- ---- ---- ---- ---- ---- ---- ---- ----

   Incidents       |    6  132  252  406  773 1334 2340 2412 2573 2134

   Advisories      |    1    7   12   23   21   19   15   18   27   28

   Vulnerabilities |                                     171  345  311
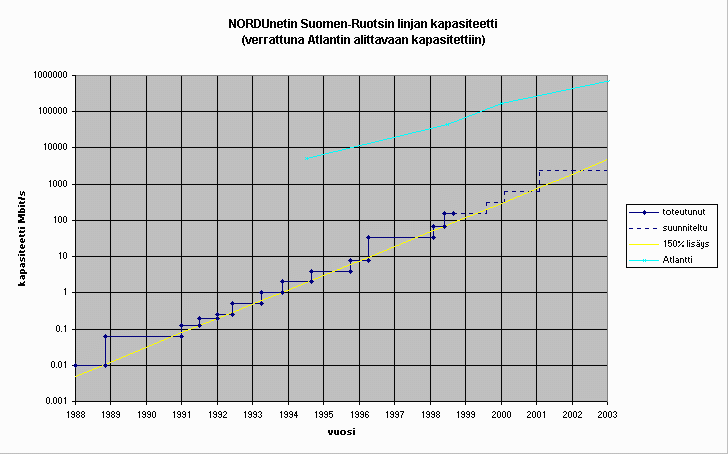
The following diagram shows the growth in the FUNET's foreign-connection capacity and, for comparison, the total capacity of the sub-Atlantic optic cables. The speed scale is logarithmic in the vertical axis, i.e. each square corresponds to a 10-times increase in speed. From this it is easy to see that the demand for extra FUNET capacity has been about 150% a year for ten years. If development continues like this, then, at the beginning of the 2000s, the FUNET will go over to gigabit-class connections and sub-Atlantic optic-cable capacity will be over a terabit per second. A terabit/s can accommodate about 16 million ordinary 64 Kbit/s phone calls or 200,000 simultaneous MPEG-2-encoded DVD-quality digital TV transmissions at an average speed of 5 Mbit/s. All of this will presumably be integrated into the Internet of the future, when all phone calls are local calls, and almost everyone can set up their own TV station if they want to; even in their hat, as Sci-Fi author David Brin describes the future global network in his book "Earth". The technology needed for hat-TV stations worn by floral-headgeared aunties is already being developed. The communications links would be handled using the future mobile phones, either via earth stations or via a high-density constellation of low-Earth orbit Internet satellites.
Picture: Markus Sadeniemi CSC/FUNET