Excel 2003
Editing Charts
Introduction
By the end of this lesson, you should be able to:
- Change chart data
- Change chart title
- Change series names or legend names
- Change chart type
Changing chart data
When you add a chart to your worksheet, Excel creates a link between the chart and your source data. Any changes made to the original source data are automatically reflected in the chart.
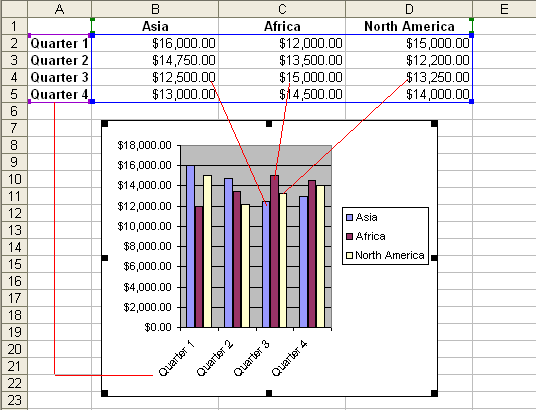
To change chart values directly in worksheet cells:
- Open the worksheet that contains the chart to be changed.
- Click in the cell whose value will change, and type the new value.
- Press Enter to accept the new value.
Changing chart data
To add data to an existing chart:
Rows or columns of data can be added to an existing chart by selecting the Add Data option on the chart menu.
- Input any new source data into the worksheet (e.g., a new column called South America).

- Click on the chart to select it for editing.
- Choose Chart
 Add Data from the menu bar.

- The Add Data dialog box appears.
- Select the cell range of new data to be added to the chart. Marching ants appear around the cell range. The selected cells are added to the Add Data dialog box.
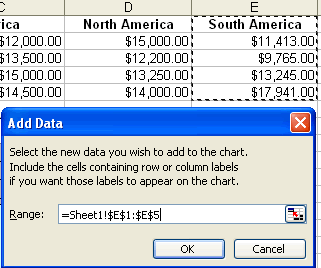
- Click the OK button to add the new data to the chart.
Changing the chart title
The chart title can be changed at any time to a name that's meaningful to you.
To change the chart title on the chart:
- Click on the chart title.
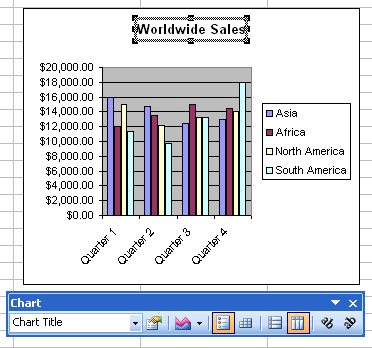
- Click anywhere in the title name, and make any changes to the text.
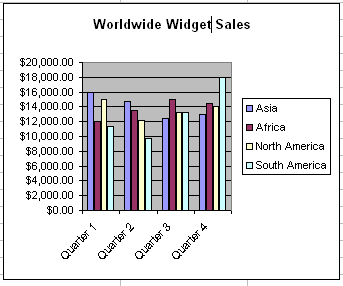
- Click anywhere outside of the title to apply your changes.
Changing the data series names or legend text
Data series names and legend text are changed in much the same manner as when we changed chart values in the worksheet.
To change the data series names or legend text on the worksheet:
- Click the cell that contains the data series name or legend you want to change.
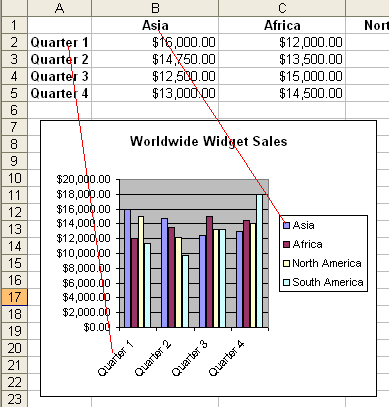
- Type the new name.
- Press the Enter key to add the new name to the chart.
Changing the chart type
There are 14 different types of charts in Excel 2003, and with each chart type there can be several variations. You can see that you can create any number of different charts. The chart type can be changed at any time with a few clicks of the mouse.
To select a different chart type:
- Click on the chart to select it for editing.
- Click on the chart type drop-down list box, and select a different chart.
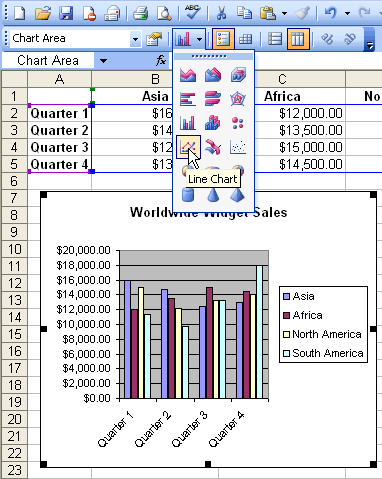
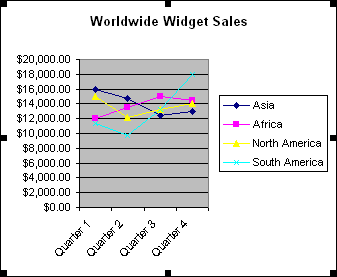
The new chart replaces that one selected for change.
Challenge!
- Open your Monthly Budget file.
- Change the dollar amount of Gas you spent in the month of February (cell C11), and press Enter to accept the new value.
- Notice how the chart changes when you make this modification. Also, the values in C16 and C18 change automatically.
- If you did not see the chart change, try entering another number into C11.
- Add the data for the month of March to the chart.
- Change the chart title from My Budget to whatever you wish to name it.
- Save and close the document.


